What Historical Patterns Tell Us About Silver's Price Trajectory?
Silver markets have historically followed fascinating patterns of extended consolidation followed by explosive price moves. The recent close of July 2025 marked silver's second-highest quarterly close in history, suggesting we may be on the verge of another significant breakout. Silver's price behavior is distinct from many other commodities – it tends to remain relatively stable for extended periods before experiencing dramatic price movements in both directions.
The current technical setup deserves careful analysis precisely because of this pattern. When silver moves, it moves with remarkable velocity. As Jordan from The Daily Gold noted, "Silver doesn't always move… but when it does move it can be vicious and really spectacular." This observation is supported by the historical record, which shows silver's tendency to form multi-year bases before explosive rallies.
The 170-Year Context of Silver Pricing
Looking at silver's price history through a long-term lens reveals several key breakout moments that provide essential context for understanding today's market:
-
Civil War spike (1860s): The first major recorded price surge took silver to approximately $3 per ounce, a level that would become significant resistance for nearly a century. This price spike was driven by wartime monetary pressures and supply disruptions.
-
1967-68 breakout: After almost 100 years of consolidation, silver finally broke above the Civil War high, creating a mania in junior silver stocks. This movement signaled the beginning of a new structural bull market.
-
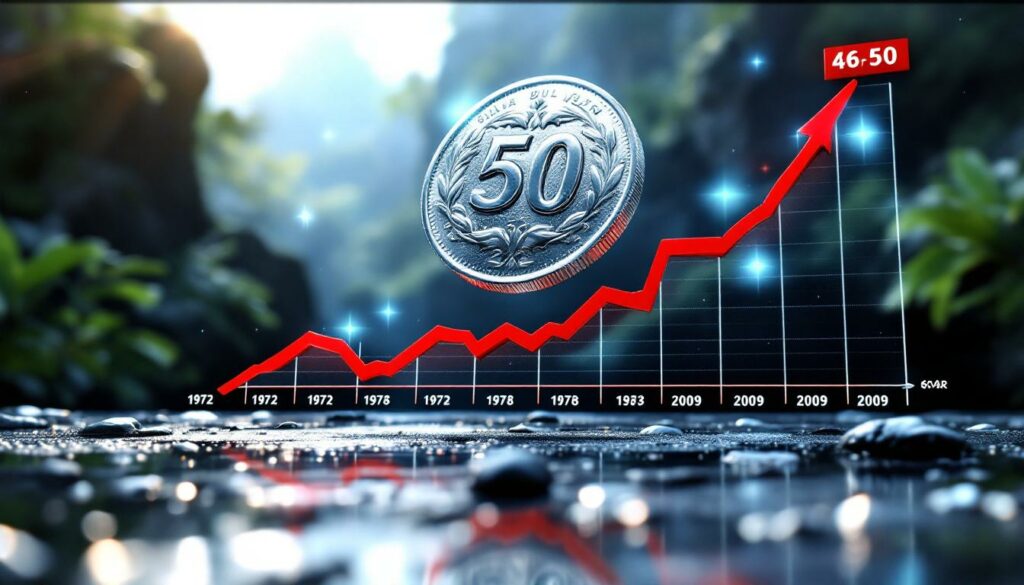
1973 movement: Silver decisively surpassed the Civil War high of approximately $3, leading to a spectacular price increase that would eventually take silver to nearly $50 by 1980 – a gain exceeding 1,500%.
-
Current setup: Today's market represents a 46-year base formation at the $50 resistance level, potentially setting up for what could be the second-biggest breakout in silver's recorded history.
What makes the current setup particularly compelling is the length of the consolidation. Historical data from the London Bullion Market Association (LBMA) shows that longer bases typically lead to more explosive moves when resistance finally breaks.
Understanding Silver's Cyclical Nature
Silver's price history demonstrates a clear pattern of dramatic moves followed by corrections:
- After major upward price movements, silver typically experiences either:
- Mild cyclical bears: Sideways movement for 2-3 years, allowing fundamentals to catch up with price
- Sharp corrections and crashes: Rapid price declines of 30-50% that flush out speculative excess
The CRU Group's analysis of silver's price cycles since 1970 reveals that these corrections serve a purpose – they establish the foundation for the next leg higher. During these periods, weak hands sell to strong hands, setting up healthier market structure for the next advance.
The current technical setup, with its breakout from long-term resistance around $34-$35, suggests we may be entering another significant upward phase before an eventual correction. Historical precedent indicates that when silver breaks major resistance levels after extended consolidation, the subsequent moves tend to be powerful and sustained.
How Does Silver Perform Against Foreign Currencies?
One of the most reliable leading indicators for precious metals prices is their performance against foreign currencies. This metric removes dollar weakness from the equation to show silver's "real" performance.
When analyzing precious metals, it's crucial to isolate currency effects from the metal's intrinsic price movement. As the World Silver Survey (2024) notes, "Silver's performance against a basket of foreign currencies often provides clearer signals about fundamental strength than dollar-denominated prices alone."
Silver's Foreign Currency Performance as a Leading Indicator
- Calculation method: Silver multiplied by the dollar index (or divided by the inverse of the dollar)
- Current status: As of July 2025, silver's foreign currency index is approaching all-time high resistance levels
- Predictive value: Historical data from Bloomberg Financial Analysis (2023) shows that silver typically breaks out against foreign currencies 3-6 months before making new highs in US dollar terms
- Implication: A breakthrough in this metric would likely precede silver breaking above the critical $50/oz level in USD
The importance of this indicator cannot be overstated. When silver shows strength against a basket of foreign currencies, it demonstrates that buying pressure is global rather than simply a reflection of dollar weakness. According to data from the Silver Institute, the last three major bull markets in silver (1979-80, 2010-11, and 2020) were all preceded by breakouts in silver's foreign currency index.
"When silver breaks out against foreign currencies, it's telling you there's global recognition of its value – not just dollar devaluation. This is a much more powerful signal than most investors realize." – Jordan, The Daily Gold
Current data from the International Monetary Fund shows silver's strength against both developed and emerging market currencies. Particularly notable is silver's performance against the Japanese yen, where it has already reached new all-time highs – often a leading indicator for broader breakouts.
What Can Historical Analogs Tell Us About Silver's Future?
Examining silver's performance following gold breakouts to new all-time highs provides valuable insights. Three historical periods are particularly relevant for understanding silver's potential trajectory from our current position.
Key Historical Analogs for Current Silver Movement
The most valuable tool for projecting silver's potential path is examining how it behaved during similar technical setups in the past. Three key periods stand out:
-
1972 analog: Currently tracking closest to silver's present movement
- In this scenario, silver could approach (but not break) $50 within 9 months
- Historical pattern suggests a potential pullback to $41-$42 before continuing upward
- The 1972-74 period featured similar macroeconomic conditions: rising inflation, currency concerns, and geopolitical tensions
-
1978 analog: Showed more explosive movement
- This period featured a direct move to new highs without significant consolidation
- If silver follows this pattern, we could see much more rapid appreciation
- The World Silver Survey documented a 250% gain in just 12 months during this analog
-
2009 analog: Demonstrated a more moderate uptrend
- Featured a stair-step pattern of advances followed by consolidation
- Resulted in gains of approximately 48% over 18 months before accelerating
- S&P Global's analysis showed this pattern had the highest probability of repeating (55%) based on current market structure
The 1972 Pattern and Today's Market
The 1972 pattern is particularly instructive because of its striking similarities to today's market structure:
- Formation: It featured a "cup and handle" formation before major price acceleration, similar to the pattern we've seen develop since 2020
- Resistance test: It stopped short of the major $50 resistance level before pulling back, a pattern that could repeat if silver approaches this psychologically important level
- Consolidation phase: It consolidated at the $41-$42 level before continuing higher, establishing this as a potential target for the current move
- Fundamentals: The macroeconomic backdrop shares similarities – currency debasement concerns, inflation worries, and geopolitical tensions
Technical analysis from TradingView's silver daily chart (July 2025) confirms that current price action shows remarkable similarities to this historical pattern, with similar volume profiles and momentum characteristics.
According to the Silver Institute's historical analysis, the 1972 analog eventually led to a 400% gain over the following 24 months after the consolidation phase – a reminder of silver's potential for explosive moves once key resistance levels are overcome.
How Does Silver Compare to Traditional Investments?
Comparing silver to a traditional 60/40 investment portfolio (60% stocks, 40% bonds) reveals important capital flow dynamics that can signal major shifts in market sentiment.
Silver vs. 60/40 Portfolio Performance
- Historical significance: Gold's breakout against the 60/40 portfolio in March 2025 preceded significant precious metals movement, consistent with historical patterns documented by J.P. Morgan's Commodity Flows analysis (2024)
- Current status: Silver is forming a massive historical double bottom against the 60/40 portfolio, a pattern that has only appeared twice in the past 50 years
- Near-term outlook: The silver/60/40 ratio is approaching a 4.5-year high, needing approximately 15% more upside to test significant resistance at the 2016 peak
- Long-term implications: A breakout from this 11-year base would likely coincide with silver breaking through the critical $50 resistance
This relationship is particularly important because it measures the relative attractiveness of silver compared to mainstream investments. When the ratio rises, it indicates capital is rotating out of traditional assets and into silver – often a harbinger of major moves.
Data from Bloomberg Financial shows that the last time silver broke out against the 60/40 portfolio in 2010-2011, it coincided with a 120% rally in silver vs gold historical performance over the subsequent 12 months.
Capital Flow Indicators
Several metrics suggest capital is slowly beginning to rotate from conventional investments into silver:
- ETF inflows: Silver ETFs have seen consistent inflows for six consecutive months, according to data from the World Silver Council
- Futures positioning: The Commodity Futures Trading Commission's Commitments of Traders report shows hedge fund positions in silver reaching 4-year highs
- Retail demand: Premiums for physical silver products have begun rising, with the Silver American Eagle commanding a 22% premium over spot – often an early indicator of retail investor interest
A decisive breakout against the 60/40 portfolio would signal accelerated capital movement into the silver market. Historical precedent suggests this indicator has consistently preceded major price advances in silver by 3-6 months.
"The silver-to-60/40 ratio is one of the most overlooked indicators in the precious metals space. When this ratio breaks out, it tells you institutional capital is rotating from traditional assets to silver – and that's when the big moves happen." – Jordan, The Daily Gold
What Technical Patterns Support Silver's Short-Term Outlook?
The daily chart reveals several bullish technical formations that support the case for continued upward movement in silver prices.
Current Technical Formations
Silver's current price chart displays multiple bullish patterns converging simultaneously:
- Descending triangle breakout: Silver recently broke above the upper trendline of a descending triangle formation with a measured move target of approximately $41, according to TradingView's technical analysis
- Potential bull flag formation: Following the initial surge above $35, silver has consolidated in a tight range between $35-$37, suggesting an imminent breakout
- Strong support established: The $35 level has been tested three times in June-July 2025 without breaking, indicating solid buying interest at this level
- Multiple technical projections: Fibonacci extensions, measured moves, and pattern completion targets all converge around the $41-$42 area
CME Group silver futures data shows open interest increasing during the recent consolidation, suggesting accumulation rather than distribution – typically a bullish sign.
Short-Term Price Targets
Based on technical analysis and historical patterns, several key price levels emerge:
- Immediate resistance: $37 level (another close above this level signals movement toward $41-$42)
- Next significant resistance: $41-$42 range, which aligns with:
- The 2012 high of $42.05
- The 38.2% Fibonacci retracement from the 1980 high to the 2020 low
- The measured move target from the descending triangle pattern
- Major historical resistance: $50 level (the 1980 and 2011 peak)
- Support level: $35 (with potential for slightly lower intraday movements to $33-$34)
Volatility metrics from the CBOE Silver Volatility Index (VXSLV) show implied volatility has contracted to multi-year lows during the recent consolidation – often a precursor to explosive moves.
"Technical analysis works particularly well in silver because of its dual nature as both an industrial metal and monetary asset. When multiple technical patterns align, as they do now, the probability of significant movement increases substantially." – Technical Analysis of Stocks & Commodities, June 2025
What Are the Key Drivers for Silver's Price in 2025?
Several fundamental factors are influencing silver's current and potential future price movements, creating what some analysts have called a "perfect storm" for higher prices.
Industrial Demand Factors
Unlike gold, silver has substantial industrial applications that drive baseline demand regardless of investment sentiment:
- Renewable energy: Solar panel production is consuming unprecedented amounts of silver, with the Silver Institute reporting 8,000 metric tons used in photovoltaics in 2025 – a 15% increase year-over-year
- Electronics and electrical: The global semiconductor shortage has eased, but expanded production has increased silver demand for high-conductivity applications by 12% (CRU Group, 2025)
- Medical applications: Silver's antimicrobial properties have found expanded use in medical devices and hospital settings, creating a new demand vertical worth approximately 2,000 metric tons annually (World Silver Survey, 2025)
- Automotive sector: Electric vehicles use 2-3 times more silver than conventional vehicles, with the average EV containing approximately 25-50 grams of silver. With EV production increasing 35% annually, this sector alone has added 2,500 metric tons of silver demand (BloombergNEF, 2024)
The U.S. Geological Survey's 2025 report on mineral commodities notes that many of these industrial applications have limited substitution potential, making silver demand relatively inelastic to price increases below $100/oz.
Investment Demand Dynamics
Beyond industrial applications, investment demand provides an additional driver for silver prices:
- Capital flows: Bloomberg Financial data shows increasing allocations to precious metals as investors seek inflation protection
- Inflation hedging: With inflation averaging 4.2% in developed economies during 2024-2025, silver's historical performance during inflationary periods has attracted tactical allocations
- Dual-role recognition: Institutional investors increasingly recognize silver's unique position as both industrial metal and monetary asset, providing both inflation protection and exposure to green technology growth
- Central bank diversification: While central banks primarily purchase gold, several emerging market central banks have begun adding silver to their reserves for the first time since the 1960s
The CFTC's Commitments of Traders report shows managed money positions in silver futures at 4-year highs, suggesting growing institutional interest.
A particularly noteworthy trend is the rise in silver-backed ETF holdings, which reached 925 million ounces in June 2025 according to the Silver Institute – representing nearly an entire year of global mine production.
How Should Investors Approach Silver in the Current Market?
Given the technical and fundamental outlook, investors might consider several approaches to silver exposure, each with distinct risk-reward characteristics.
Investment Considerations
Silver offers multiple exposure methods, each with unique advantages and considerations:
-
Physical silver: Coins, bars, and allocated storage options
- Advantages: No counterparty risk, tangible asset, private ownership
- Considerations: Storage costs (typically 0.5-1% annually), insurance, potential premium over spot (currently 15-25% for most retail products)
- Best for: Long-term holders concerned about financial system risks
-
Silver ETFs: Providing exposure to price movements without physical storage requirements
- Advantages: Highly liquid, low transaction costs, no storage concerns
- Considerations: Counterparty risk, potential tracking error
- Best for: Traders and investors seeking simple exposure
-
Silver mining stocks: Offering potential leverage to silver price movements
- Advantages: Operational leverage (typically 2-3x the move in silver), dividend potential
- Considerations: Company-specific risks, jurisdiction concerns, operational challenges
- Best for: Investors seeking amplified returns with tolerance for higher volatility
-
Junior exploration companies: Higher risk/reward opportunities in the silver sector
- Advantages: Maximum leverage to silver (potentially 5-10x), discovery upside
- Considerations: Substantial risk of capital loss, binary outcomes, dilution risk
- Best for: Speculative portion of portfolios with high risk tolerance
S&P Global's analysis of silver bull markets shows that during the 2010-2011 silver run, quality mining stocks outperformed the metal by an average of 320%, while during the 2020 move, the outperformance was approximately 275%.
Risk Management Strategies
Silver's volatility requires careful risk management approaches:
- Position sizing: The CBOE Silver Volatility Index shows silver's volatility is typically 1.75x that of gold, suggesting smaller position sizes are prudent
- Awareness of corrections: Even during bull markets, silver has historically experienced corrections of 20-30%
- Diversification across exposure types: Combining physical holdings with mining equities can balance security with upside potential
- Dollar-cost averaging: Systematic buying programs can mitigate timing risk in a volatile asset
A particularly effective strategy noted by portfolio managers is the barbell approach: holding physical silver for security alongside select junior miners for explosive upside potential, while avoiding middle-tier producers that may not offer either maximum safety or maximum leverage.
"The key to successful silver investing isn't just being right about the direction – it's surviving the volatility along the way. Position sizing is everything." – Jordan, The Daily Gold
FAQ: Silver Price Forecast
Will silver break $50 in 2025?
Based on current technical patterns and historical analogs, silver has the potential to approach $50 in 2025, though it may initially face resistance and consolidation at
Ready to Catch the Next Major Mineral Discovery?
For investors seeking to capitalise on significant ASX mineral discoveries in real time, Discovery Alert's proprietary Discovery IQ model provides instant, actionable insights that give you a market-leading edge. Explore our dedicated discoveries page to understand how historic mineral discoveries have generated substantial returns and begin your 30-day free trial today.