
July 13, 2026
When Diplomacy Fails, Oil Markets React Violently
Oil surges on Iran and US CPI eyed represents one of the most consequential macro confluences of 2026, as energy markets absorbed simultaneous geopolitical shocks and looming inflation data. Unlike equity markets, which can absorb uncertainty through forward earnings adjustments, crude oil pricing responds almost instantaneously to any credible threat against the physical infrastructure of global supply chains. The Strait of Hormuz sits at the centre of this dynamic, and when the fragile US-Iran ceasefire arrangement unravelled in early July 2026, the repricing was swift, sharp, and structurally significant.
Understanding the week of 13 July 2026 requires more than tracking headline numbers. It demands a framework that connects geopolitical risk premiums, inflation data sequencing, central bank communication, and corporate earnings signals into a coherent picture of where global markets stand and where they may be heading.
When big ASX news breaks, our subscribers know first
Oil Surges on Iran: The Mechanics Behind the Price Spike
How Ceasefire Optimism Was Priced In, and Then Priced Out
One of the least discussed dynamics in crude oil markets is the asymmetric nature of geopolitical risk pricing. When diplomatic progress occurs, risk premiums compress gradually over weeks or months. When escalation resumes, however, that compression reverses in days.
This is precisely what played out in the Brent crude market between June and early July 2026. During the ceasefire period, prices retreated from above $100 toward lows near $70 per barrel, as traders assigned a high probability to a sustained diplomatic resolution. The re-escalation, triggered by US strikes resuming after tanker incidents in the Strait of Hormuz and President Trump declaring the ceasefire "over," forced a rapid and aggressive repricing. According to Reuters, US oil prices jumped sharply immediately after the military strikes were confirmed.
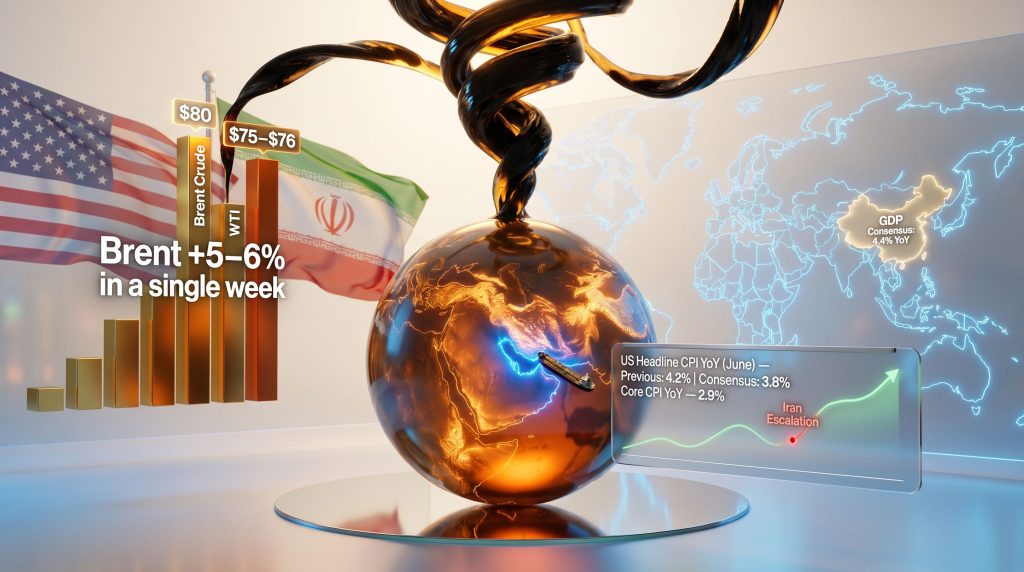
- Brent crude rose approximately 5.4% over the week, briefly breaching $80 per barrel
- WTI crude gained approximately 4.0%, trading near $76 per barrel
- The $70.21 July low now functions as a key technical support level on any subsequent pullback
The speed of the move reflects a market that had overly discounted the diplomatic scenario. When that assumption broke down, the re-establishment of a geopolitical risk premium was not gradual; it was sudden. Furthermore, OPEC's market influence added another layer of complexity to an already volatile pricing environment.
The Strait of Hormuz: A Chokepoint the World Cannot Afford to Lose
Few geographic features carry as much economic weight per square kilometre as the Strait of Hormuz. This narrow maritime passage between Iran and Oman functions as the primary export corridor for crude oil from the Persian Gulf region. Iran confirmed it had closed the strait after firing a warning shot at a vessel travelling on an unapproved route, with authorities cautioning that any retaliation would be met with a severe response.
Tanker traffic through the strait slowed to a near-standstill following the vessel incidents, creating a supply disruption that markets could not ignore. Analysts noted that a sustained closure at this level could push US gasoline prices back above $4 per gallon, a threshold with direct implications for consumer sentiment and headline inflation readings.
"The Strait of Hormuz handles an estimated 20% of global oil trade by volume. Even partial disruptions to traffic flows through this corridor can create outsized price responses in futures markets far exceeding the actual barrels affected, because traders price the risk of escalation, not just the disruption already observed."
Supply, Demand, and the Structural Limits of the Oil Bull Case
Why the Rally Has a Ceiling
While geopolitical risk can sustain a price floor, the structural picture for crude oil in 2026 creates significant resistance to any sustained return toward prior highs. The International Energy Agency's July report provided crucial context that tempers the bullish narrative. In addition, crude oil price trends heading into mid-2026 already pointed toward medium-term supply headwinds.
| Factor | Bullish Signal | Bearish Counterweight |
|---|---|---|
| Strait of Hormuz closure | Severe supply risk premium reintroduced | Tanker releases from the strait adding barrels to market |
| IEA supply rebound | Production recovering from war-era lows | Global supply rose +4.1 million barrels/day in June alone |
| Output gap vs. pre-conflict | Approximately 9.4 mb/d below pre-war levels | Provides floor, not necessarily a ceiling driver |
| OPEC+ quota expansion | — | Continued output additions pressuring medium-term prices |
| IEA surplus forecast | — | Market expected to swing into surplus later in 2026 |
| Demand recovery | Recovering from May lows | Slow pace of recovery limits upside momentum |
The IEA's data painted a nuanced picture. While the supply rebound in June (+4.1 million barrels per day) as stranded tankers rushed to exit the strait was dramatic, total output remains approximately 9.4 million barrels per day below pre-conflict levels. That gap provides a meaningful price floor. However, the combination of OPEC+ quota expansion, recovering tanker releases, and the IEA's projection of a market surplus later in 2026 collectively limit the ceiling.
From a technical standpoint, Brent crude's undated contract briefly broke above the descending trendline near $78 established since May 2026. A sustained hold above this level would bring the 200-day moving average resistance near $81 into view, potentially shifting the prevailing bearish technical structure. Failure to hold above $78 would suggest the move is corrective rather than trend-reversing.
US CPI Data: The Other Major Risk Event of the Week
What the June Inflation Numbers Are Actually Measuring
The June US CPI release, due Tuesday 14 July, arrives at a particularly delicate moment for Federal Reserve communication. The expected readings reflect energy price dynamics from June, before the latest Iran escalation, creating a potential gap between what the data shows and what the current market environment implies going forward.
| Indicator | Previous Reading | Market Consensus |
|---|---|---|
| US Headline CPI (MoM, June) | +0.5% | -0.1% |
| US Headline CPI (YoY, June) | 4.2% | 3.8% |
| US Core CPI (MoM, June) | +0.2% | +0.2% |
| US Core CPI (YoY, June) | 2.9% | 2.9% |
| US PPI (MoM, June) | +1.1% | +0.2% |
The anticipated month-on-month deceleration in headline CPI to -0.1% from a prior reading of +0.5% is primarily attributable to the energy price retreat that occurred in June before the ceasefire collapsed. This creates a peculiar situation: the data may confirm disinflation at the very moment when energy prices are once again rising due to renewed hostilities.
The Core CPI Problem and Fed Policy Implications
While headline CPI tends to attract the broadest media attention, market participants and Federal Reserve officials place substantially greater weight on the core CPI reading, which excludes food and energy components. Core CPI stood at 2.9% year-on-year in May and is expected to hold at that level in June. The Fed inflation outlook has consequently remained a focal point for bond and equity traders alike.
The persistence of core inflation above 2% is structurally driven by two primary components:
- Shelter costs, which account for a disproportionately large share of the CPI basket and typically lag real estate market conditions by 12 to 18 months
- Medical care services, which exhibit similar inertia and have contributed meaningfully to core services inflation throughout 2025 and 2026
These components do not respond quickly to changes in monetary policy, creating a floor under core inflation that is difficult to erode rapidly. A hotter-than-expected core reading would create a direct conflict with recent Federal Reserve communication from Sintra, where Fed Chair Warsh indicated that inflation risks had eased.
Bond futures markets are currently assigning approximately a 79% probability to a rate hike in October 2026, making Warsh's congressional testimony on Tuesday one of the week's most closely watched events.
Scenario Watch: If core CPI surprises to the upside while energy prices are simultaneously rising due to Iran tensions, markets face a dual inflation shock combining structural stickiness with geopolitical supply pressure. This combination could significantly alter the Fed's rate path calculus and pressure high-duration equity valuations.
Interpreting the Three CPI Scenarios
- Softer-than-expected core CPI: Validates the disinflation narrative, supports equity multiples, reduces October rate hike probability, likely positive for growth assets and bonds
- In-line core CPI: Maintains current market pricing, neutral to mildly positive, near-term volatility likely contained
- Hotter-than-expected core CPI: Challenges Fed communication, reignites rate hike acceleration fears, pressures high-duration technology stocks, and potentially widens credit spreads
PPI data on Wednesday will offer an additional forward-looking signal on pipeline inflation pressures, with consensus expecting a sharp deceleration from the prior month's elevated 1.1% reading to just 0.2% month-on-month.
China's Dual Reality: Industrial Strength, Consumer Fragility
The PPI-CPI Divergence and What It Signals
China's inflation data for June revealed a structural tension that has significant implications for global commodity markets and supply chains. Consumer prices rose just 1.0% year-on-year, missing consensus estimates and decelerating from May's 1.2% reading. The drag came from falling fuel prices, which suppressed transport costs, alongside declining consumer goods prices.
Simultaneously, China's producer price index surged 4.1% year-on-year, the strongest reading since July 2022, driven by raw material and mining cost escalation. The US-China trade war dynamics have further complicated this picture, adding tariff-driven cost pressures to an already strained supply chain environment.
This divergence between producer-level inflation and consumer-level price softness is a textbook indicator of margin compression risk. When input costs rise faster than consumer prices, producers are absorbing cost increases that cannot be fully passed through to end customers. Consequently, this dynamic tends to compress corporate margins over time and signals structural weakness in household consumption demand.
China Q2 GDP and the Growth Target Test
The Wednesday data slate from China will be among the most consequential of the week, with Q2 GDP growth expected to slow to 4.4% year-on-year, approaching the lower boundary of Beijing's 4.5-5.0% annual growth target range.
| Indicator | Previous Reading | Market Consensus |
|---|---|---|
| China GDP (YoY, Q2 2026) | 5.0% | 4.4% |
| China Industrial Production (YoY, June) | 4.5% | 4.7% |
| China Retail Sales (YoY, June) | -0.6% | -0.1% |
| China Fixed Asset Investment (YTD June) | -4.1% | -4.9% |
| China Exports (YoY, June) | +19.4% | +18.2% |
| China Imports (YoY, June) | +27.4% | +24.0% |
The continued contraction in fixed asset investment reflects the persistent drag from the property sector, while retail sales are expected to remain in negative territory. Moreover, China industrial demand signals from the steel and iron ore sectors suggest that downstream consumption remains under considerable structural pressure. Export strength, with consensus at +18.2% year-on-year, reflects ongoing stockpiling demand driven by Middle East supply uncertainty and sustained AI hardware procurement.
Equity Markets: Tech Divergence, Regional Rotation, and What the Charts Show
US Equities: A Market of Divergent Sectors
US equity performance over the prior week was sharply bifurcated. The S&P 500 advanced 1.2% and the Nasdaq 100 gained 1.7%, while the Dow Jones Industrial Average declined 0.5%, reflecting the drag from Iran-sensitive cyclical and industrial sectors.
The technology sector's outperformance was driven by two significant company-specific catalysts:
- Meta surged 14.8% after announcing plans for Meta Compute, a cloud unit designed to convert excess AI infrastructure capacity into a revenue-generating business
- Nvidia climbed 8.3% following signals from China that limited H200 chip orders may be permitted for select domestic technology companies, reinforced by buy-on-dip interest as its forward P/E ratio declined to approximately 18 times, its lowest valuation since 2019
- SK Hynix surged 17% on its Nasdaq debut, marking the largest US share sale on record by a foreign company
On the negative side, Intel fell 8.7% on reports that its 18A manufacturing process may not achieve commercially viable yields until late 2026 or 2027.
From a technical perspective, the Nasdaq 100 is consolidating within a converging wedge. A decisive break above resistance at 30,200-30,300 is needed to confirm the continuation of the bullish trend, while the rising trendline near 28,000-29,000 represents the key downside risk level to monitor.
Hang Seng Outperformance: The Chinese AI Rotation Dynamic
The Hang Seng Index rose approximately 3.5% over the prior week, outperforming the broader MSCI Asia-Pacific benchmark as investors rotated capital out of Korean, Taiwanese, and Japanese chipmakers into Chinese AI-exposed names.
Alibaba led gains with a 17.1% surge after a pre-earnings briefing pointed to narrowing losses in its instant-commerce business. Meituan, Tencent, and JD.com each advanced over 5%. Sentiment was further supported by reports that DeepSeek is developing its own AI chip to reduce reliance on external suppliers.
Not all developments were positive, however. CATL fell 13.1% as lithium carbonate prices extended their decline to a 10-week low. MiniMax dropped 22.5% after raising $1.9 billion in capital with shares priced at a 10% discount. The HSI faces a medium-term technical test, needing to reclaim its 200-day moving average near 25,850 to shift the prevailing bearish structural trend.
The next major ASX story will hit our subscribers first
Q2 Earnings Season: What the Bank and Semiconductor Results Will Determine
Financial Sector Earnings as a Macro Health Check
Q2 earnings season formally begins this week, led by a concentrated cluster of major US financial institutions. Financial sector earnings are expected to grow approximately 9.9% year-on-year according to LSEG estimates, making this reporting cohort a critical barometer for broader economic health.
The financial sector is the S&P 500's second-largest earnings contributor after technology, meaning the tone set by bank results this week will meaningfully influence broader Q2 earnings season sentiment.
| Date | Key Reporting Companies |
|---|---|
| Tuesday 14 July | JPMorgan, Bank of America, Goldman Sachs, Wells Fargo, Citigroup |
| Wednesday 15 July | ASML, Johnson and Johnson, Morgan Stanley, BlackRock, BNY Mellon |
| Thursday 16 July | TSMC, UnitedHealth, GE Aerospace, Netflix, Abbott Laboratories |
Semiconductors as an AI Demand Verification Event
Results from ASML and TSMC will function as a real-time check on whether AI-driven chip demand remains structurally intact. These two companies sit at the upstream end of the semiconductor supply chain, and their forward guidance carries outsized information value about the trajectory of AI capital expenditure cycles globally.
Any guidance disappointment from either name could challenge the AI infrastructure investment thesis that has underpinned a substantial portion of the 2026 equity rally. Conversely, strong forward guidance would reinforce the case for continued elevated AI spending and support valuation multiples across the broader technology sector.
Japan's Pension Fund: A Structural Shift With Global Reach
GPIF Reallocation and the Yen Recovery
Japan's Government Pension Investment Fund, managing approximately 293 trillion yen in assets, is being directed toward increased domestic allocation, reducing its historically high 50% foreign investment weighting. This reallocation signal lifted the yen from 40-year lows and triggered the sharpest single-month decline in Japanese government bond yields in recent memory.
The GPIF shift represents a structural capital flow dynamic with implications that extend well beyond Japan. A reduction in foreign asset purchases by the world's largest pension fund has the potential to affect global bond and equity markets over the medium term. Investors exposed to Japanese bond markets and the yen should treat this development as an ongoing structural variable, not a one-time event.
Complete Macro Event Calendar: Week of 13-17 July 2026
| Date | Event | Previous | Consensus |
|---|---|---|---|
| Tue 14 Jul | China Trade Balance (June) | $105.4B | $121.0B |
| Tue 14 Jul | US Headline CPI YoY (June) | 4.2% | 3.8% |
| Tue 14 Jul | US Core CPI YoY (June) | 2.9% | 2.9% |
| Tue 14 Jul | Fed Chair Warsh Congressional Testimony | — | — |
| Wed 15 Jul | China GDP YoY (Q2) | 5.0% | 4.4% |
| Wed 15 Jul | China Retail Sales YoY (June) | -0.6% | -0.1% |
| Wed 15 Jul | US PPI MoM (June) | 1.1% | 0.2% |
| Thu 16 Jul | UK GDP MoM (May) | -0.1% | +0.1% |
| Thu 16 Jul | US Retail Sales MoM (June) | 0.9% | 0.3% |
| Fri 17 Jul | US Michigan Consumer Sentiment (July, prelim) | 49.5 | 51.0 |
| Fri 17 Jul | US Housing Starts (June) | 1.177M | 1.33M |
Frequently Asked Questions
Why Did Oil Surges on Iran Tensions Drive Such a Large Market Response?
The price response was amplified because oil markets had extensively priced in a diplomatic resolution following the June ceasefire. When that assumption was invalidated by resumed hostilities and the Strait of Hormuz closure, the market was forced to simultaneously abandon a bullish diplomatic assumption and reprice a severe supply disruption scenario. As reported by ABC News, oil prices jumped more than 2% immediately following the confirmed US strikes, underscoring how swiftly sentiment shifted. The magnitude of the overall move reflects the distance between where the market was positioned and where geopolitical reality had shifted.
What Is the Most Important Data Release of the Week?
While the macro calendar is densely packed, core CPI on Tuesday 14 July carries the highest policy significance. It will determine whether the Federal Reserve's recent communication that inflation risks have eased can withstand scrutiny, or whether the disinflation narrative faces a credibility challenge at precisely the moment when energy prices are re-escalating due to Iran tensions. The situation represents a defining test for oil surges on Iran and US CPI eyed as dual market themes.
How Should Investors Interpret China's GDP Slowdown?
A deceleration to 4.4% growth in Q2 does not necessarily signal a crisis, but it does represent the lower boundary of Beijing's official target range. The more informative signals will come from the composition of that growth figure: whether the weakness is concentrated in property and consumption, as expected, or whether it is beginning to spread into export-oriented industrial sectors, which have thus far provided resilience.
What Does the GPIF Reallocation Mean for Global Markets?
The redirection of the world's largest pension fund toward domestic Japanese assets represents a structural reduction in foreign capital demand from one of the globe's most significant institutional investors. Over the medium term, this could reduce demand for non-Japanese government bonds and exert mild pressure on foreign equity markets. The yen recovery and JGB yield decline observed following the announcement represent the immediate transmission mechanism, but the full structural effects will unfold gradually.
This article is intended for informational purposes only and does not constitute financial advice or a recommendation to buy or sell any financial instrument. All forecasts, consensus estimates, and market projections cited are sourced from publicly available market data as of 12 July 2026 and are subject to change. Past performance is not a reliable indicator of future performance. Trading CFDs involves significant risk of loss. 69% of retail client accounts lose money when trading CFDs with IG as the investment provider. Readers should conduct their own research and consult a qualified financial adviser before making investment decisions.
Want to Stay Ahead of the Next Major Commodity Discovery Driving Market Moves?
While geopolitical shocks and inflation data dominate macro headlines, significant mineral discoveries on the ASX can deliver equally dramatic — and potentially more accessible — investment opportunities. Discovery Alert's proprietary Discovery IQ model instantly identifies high-impact ASX mineral discoveries across 30+ commodities, delivering real-time alerts so subscribers can act before the broader market catches on — explore historic discovery returns to see what's possible, and begin a 14-day free trial at Discovery Alert to position yourself ahead of the next major find.