
August 7, 2026
When Quota Math Meets Physical Reality: The Hidden Tension Reshaping Global Oil Markets
Global oil markets have always rewarded producers who can deliver barrels reliably, not just those who can produce them cheaply. For most of the post-Cold War era, that distinction barely mattered. Export infrastructure was stable, maritime chokepoints were predictable, and the most important variables in crude pricing were reservoir quality, sulfur content, and proximity to refining centres. That framework has now been fundamentally disrupted, and OPEC+ restores production cuts but export risks still drive oil repricing across every major trading desk.
The concept driving oil pricing in the second half of 2026 is not production capacity. It is deliverability. Understanding the gap between those two variables is the single most important analytical task for anyone assessing energy markets or resource project economics right now.
When big ASX news breaks, our subscribers know first
The Quota Unwind in Context: What OPEC+ Actually Decided
Seven OPEC+ member nations — specifically Saudi Arabia, Russia, Iraq, Kuwait, Kazakhstan, Algeria, and Oman — reached an agreement on August 2, 2026 to collectively raise their production target by approximately 188,000 to 190,000 barrels per day for September 2026. This increment completed the full reversal of the voluntary cuts first introduced in 2023, unwinding a total of roughly 3.5 million bpd in phased monthly steps.
That headline figure has attracted significant market attention. What it obscures, however, is equally significant:
- A separate groupwide production restraint of approximately 2 million bpd remains active through the end of 2026, meaning the full OPEC+ supply discipline architecture has not been dismantled
- Multiple member nations continue to operate below their allocated quotas because of technical limitations, aging infrastructure, and operational constraints that no policy decision can fix overnight
- Delegates at the August meeting openly acknowledged this gap between authorised output and physical production capacity
Furthermore, understanding OPEC's influence on oil markets requires looking well beyond quota announcements to the physical realities constraining actual delivery.
Critical distinction: A production quota is a political authorisation. It becomes a market reality only when the authorised barrels can be extracted, loaded onto vessels, and successfully delivered through functioning export corridors to refining centres. In the current environment, that final step is far from guaranteed.
Gulf Exports vs. Gulf Quotas: A 40% Gap That Changes Everything
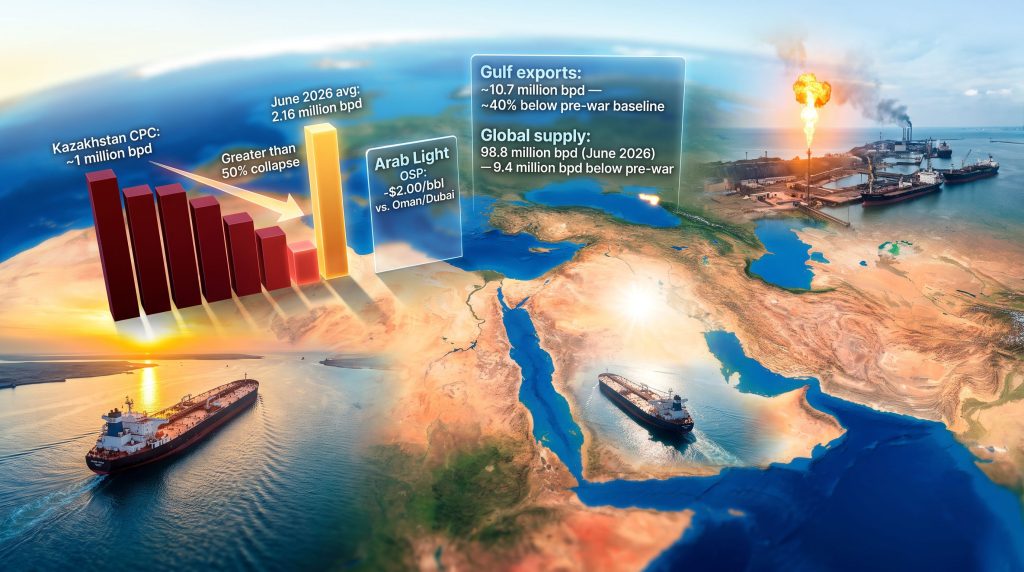
Vessel tracking data from Kpler provides the most direct measure of what the Gulf is actually delivering to global markets. For July 2026, Gulf crude and condensate exports averaged approximately 10.7 million bpd. Before the conflict that began on February 28, 2026, the same region was exporting approximately 24 million bpd, handling roughly one-fifth of all global oil flows.
The arithmetic is stark. Physical exports are running at roughly 40% below pre-conflict levels despite successive monthly quota increases. The International Energy Agency estimates Gulf production specifically remains 11.4 million bpd below pre-war levels, while global supply overall recovered by 4.1 million bpd to reach 98.8 million bpd in June 2026, still leaving the world 9.4 million bpd short of its pre-conflict baseline.
| Metric | Pre-War Level | Mid-2026 Level | Shortfall |
|---|---|---|---|
| Gulf crude and condensate exports | ~24 million bpd | ~10.7 million bpd (July) | ~40% |
| Gulf regional production | Pre-war baseline | 11.4 million bpd below baseline | Structural |
| Global oil supply | Pre-war baseline | 98.8 million bpd (June 2026) | 9.4 million bpd |
Sources: Kpler vessel tracking; IEA Oil Market Report, 2026
These numbers reveal a structural undersupply that quota announcements alone cannot resolve. Production quotas function on the supply side of the ledger. Export-route disruptions operate on the delivery side. When both are misaligned, the market prices the delivery constraint, not the production authorisation.
Three Simultaneous Chokepoint Crises Repricing Global Crude
The Strait of Hormuz: The World's Most Consequential Waterway Under Stress
Under normal operating conditions, approximately 20% of all global oil trade transits the Strait of Hormuz. Conflict in the Gulf region has attached an elevated risk premium to every barrel loaded through this corridor. Saudi Aramco's formal request for Asian buyers to submit contingency loading nominations from ports outside the strait represents something unusual: the world's largest oil exporter acknowledging in writing that its primary export route cannot be treated as unconditionally reliable.
Aramco asked customers to submit primary nominations for loading at Ras Tanura, its principal export terminal inside the strait, while simultaneously providing backup nominations from Yanbu on the Red Sea or Sidi Kerir on the Mediterranean. The practical constraint is that only limited Arab Light volumes are available from those alternate ports, meaning the contingency option offers partial coverage rather than full supply substitution. According to Al Jazeera, OPEC's output announcements during Hormuz disruptions have been characterised as largely symbolic, underscoring this gap between policy and physical reality.
The Bab el-Mandeb and Red Sea: The Alternative That Stopped Being Alternative
Yanbu had been positioned as a viable bypass around Hormuz for Saudi crude. That positioning has, however, been significantly undermined. Houthi attacks on tanker traffic in the Bab el-Mandeb reduced exports from Yanbu to approximately 3 million bpd after July 20, 2026, down from the April through June average of approximately 3.8 million bpd. A reduction of roughly 800,000 bpd from a single terminal illustrates the scale of simultaneous disruption across corridors that were previously treated as independent safety valves.
The Black Sea and the Caspian Pipeline Consortium: Central Asia Squeezed
The disruption pattern extends well beyond the Gulf. The Caspian Pipeline Consortium carries more than 80% of Kazakhstan's crude oil exports from production fields to global markets. Ukrainian drone strikes on the Novorossiysk terminal have repeatedly suspended Black Sea loadings since July 2026, compressing Kazakh output from approximately 2.16 million bpd in June to approximately 1 million bpd, a reduction of more than 50% from a single corridor.
Kazakhstan's situation illustrates a principle that applies across the OPEC+ framework: quota compliance becomes an irrelevant concept when the physical infrastructure required to move production to market is under sustained attack. The country cannot produce to its allocation not because of any policy choice but because its primary export route has been disabled.
Aramco's Pricing Signal: What the Arab Light OSP Cut Actually Means
Saudi Aramco set its September 2026 Arab Light Official Selling Price for Asian customers at $2.00 per barrel below the Oman/Dubai benchmark average. This represented the lowest Arab Light differential to Asia since June 2020 and a steeper discount than the -$1.50 per barrel applied in August. Dubai cash premiums had weakened materially, averaging $1.26 per barrel in July versus $2.39 per barrel in June, providing the market context for the adjustment.
Importantly, Aramco simultaneously raised its Arab Medium and Arab Heavy OSPs by $1.25 per barrel each. This divergence tells a specific story: the Arab Light discount was a targeted competitive response to Asian spot market softness in light crude grades, not a broad signal of supply abundance or price capitulation across the barrel quality spectrum.
The OSP adjustment is a tactical pricing instrument. The contingency nomination request is a structural signal. Investors and procurement teams evaluating Gulf crude supply chains in the next 12 to 24 months should weigh the latter more heavily. In addition, the broader oil market dynamics at play in 2025 and 2026 have consistently rewarded those who look beyond headline price moves to underlying supply architecture.
The Emerging Fourth Variable in Crude Pricing
Conventional crude pricing has historically incorporated three core variables:
- API gravity (a measure of crude lightness and refining yield)
- Sulfur content (sweet versus sour crude differentiation)
- Proximity to refining centres (freight cost adjustment to a benchmark)
A fourth variable is now functioning as an independent pricing input: export-route reliability. Barrels that can reach end markets without transiting contested maritime corridors are commanding a premium over Gulf crude of comparable grade and quality, regardless of production cost or reservoir characteristics.
This premium is not theoretical. It is the market's implicit insurance pricing for logistics risk — a cost that was functionally negligible for Gulf producers operating in a stable geopolitical environment and is now priced into procurement decisions by Asian refiners, European buyers, and trading desks assessing cargo risk across loading windows.
| Export Route | Primary Risk Factor | Current Status | Deliverable Supply Impact |
|---|---|---|---|
| Strait of Hormuz | Conflict and interdiction | Constrained | ~40% Gulf export reduction |
| Bab el-Mandeb / Red Sea | Houthi drone and missile attacks | Partially disrupted | ~800,000 bpd reduction from Yanbu |
| Black Sea / CPC | Drone strikes on Novorossiysk | Repeatedly suspended | Kazakhstan output halved to ~1 million bpd |
| Atlantic Basin / North Sea | Minimal current disruption | Largely open | Commanding relative premium |
| Land pipelines bypassing maritime chokepoints | Low where operational | Functioning | Premium over Gulf-origin equivalents |
The next major ASX story will hit our subscribers first
Why Demand Destruction Cannot Solve a Logistics Problem
The demand side of the ledger is shifting in the same direction as many analysts expected. The IEA projects global oil demand will contract by approximately 1 million bpd in 2026, marking the first annual demand decline since 2020. The US Energy Information Administration forecasts a slightly larger contraction of approximately 1.2 million bpd, with roughly 800,000 bpd of that reduction concentrated in non-OECD economies.
Under normal supply conditions, demand weakness of this magnitude would be expected to suppress prices materially and compress supplier margins. The current environment is not a normal supply condition. The trade war impact on oil has compounded these pressures, adding a further layer of uncertainty to already fragile demand forecasts across key Asian import markets.
The critical countervailing force is the scale of global inventory depletion since the conflict began. Aramco's chief executive communicated in a Reuters interview that the world has consumed more than 2.6 billion barrels above replenishment since hostilities commenced. Rebuilding global inventories to pre-war levels would require approximately 18 months of sustained net additions at 2.1 million bpd, assuming a complete and immediate normalisation of Hormuz flows. That assumption is not the base case.
The practical consequence is that softer demand reduces the rate of ongoing inventory drawdown rather than creating a supply surplus. The premium for secure, deliverable barrels does not disappear when demand weakens; it compresses modestly while remaining structurally elevated as long as the inventory deficit persists.
| Factor | Direction | Net Price Impact |
|---|---|---|
| OPEC+ quota hike (~190,000 bpd) | Supply increase on paper | Modest downward pressure |
| Gulf export route disruptions | Physical supply reduction | Upward pressure on deliverable barrels |
| Global demand contraction (~1 to 1.2 million bpd) | Demand reduction | Downward pressure on headline price |
| Inventory deficit (~2.6 billion barrels below pre-war) | Structural undersupply | Persistent premium for secure supply |
| Kazakhstan CPC disruption (~1.16 million bpd reduction) | Physical supply reduction | Upward pressure on non-Gulf alternatives |
How Oil Logistics Risk Flows Into Mining Project Economics
The connection between oil export disruptions and mining project costs is direct and measurable. Mining operations are among the most diesel-intensive industrial activities on earth. The same transport networks that move crude oil to refineries also carry diesel fuel to mine sites, chemical reagents to processing plants, and concentrate to export facilities. When those networks are disrupted or repriced, the cost impact flows through three primary channels:
- Diesel and fuel costs: Mine operating costs rise in direct proportion to fuel intensity when regional disruptions push diesel prices higher
- Freight and haulage rates: Tanker rerouting affects bulk carrier and container markets, raising the cost of moving equipment to site and product to port
- Equipment and reagent supply chains: Spare parts, explosives, and processing chemicals often transit the same ports and corridors as crude cargoes, creating lead-time extensions and inflationary pressure
The magnitude of these effects is already visible in operating data. IEA figures show Australian retail diesel prices were approximately 47% higher year-on-year in early May 2026. Some operators reported fuel costs running at more than double their original guidance assumptions. South African mining operations have faced compounding pressure from elevated diesel costs, higher haulage rates, and increased generator fuel expenses at remote and off-grid sites.
Consequently, the relationship between commodity prices and mining performance has grown increasingly complex, with logistics cost inflation now a primary variable alongside ore grade and strip ratio in project feasibility assessments.
Analytical point for project evaluation: These cost increases do not appear in ore grade or strip ratio calculations. They widen the gap between a project's modelled All-In Sustaining Cost and its actual realised operating cost. A development-stage project that screens attractively at a given commodity price and AISC assumption may deliver materially different economics once logistics cost inflation is applied across multi-year production schedules.
One less commonly appreciated dimension of this dynamic is the conventional light oil cost advantage in basins that bypass contested corridors entirely. Production costs in prolific conventional basins such as the Zagros have historically been estimated at approximately $10 per barrel, compared to roughly $50 per barrel for onshore conventional light oil in North America. That production cost differential becomes significantly more meaningful when the delivery premium for secure export routes is layered on top of it.
A Five-Step Framework for Evaluating Route-to-Market Risk
The standard project evaluation toolkit was calibrated for an era of logistical stability. The 2026 disruption environment requires supplementing it with a route-to-market resilience assessment. The oil price volatility trends of recent years have made this framework essential rather than optional for serious project evaluation.
Step 1: Map the full export corridor
Identify every maritime chokepoint, pipeline junction, and port facility through which production must pass. Determine whether credible alternative routes exist and at what cost premium they can be activated.
Step 2: Stress-test netbacks across price and logistics scenarios
Model project economics at multiple Brent price assumptions rather than a single forecast. Incorporate logistics cost escalation scenarios that reflect realistic rerouting costs and potential corridor disruption.
Step 3: Evaluate infrastructure redundancy
Projects with access to multiple export pathways carry lower logistics risk than those dependent on a single corridor. Pipeline infrastructure bypassing maritime chokepoints provides structural insulation from shipping-lane disruptions.
Step 4: Assess the inventory and demand context
In a low-inventory environment, supply with secure export routes commands a persistent premium. The current 18-month-plus inventory rebuilding timeline keeps that premium structurally elevated beyond near-term demand fluctuations.
Step 5: Apply jurisdictional and geopolitical overlay
Fiscal stability, contract enforceability, and conflict exposure affect both production continuity and export-route security simultaneously. Projects in stable jurisdictions with diversified export infrastructure carry lower combined risk profiles across multiple evaluation dimensions.
Frequently Asked Questions
Why haven't oil prices fallen despite OPEC+ restoring approximately 3.5 million bpd in production quotas?
Quota increases authorise production but do not guarantee delivery. Physical Gulf exports remain approximately 40% below pre-war levels because the maritime corridors through which barrels must travel are simultaneously disrupted. Markets price deliverable supply, not announced targets. Reuters reporting confirms that even as OPEC+ brings back output, the uncertain geopolitical backdrop continues to underpin prices well above what quota arithmetic alone would suggest.
What does the separate 2 million bpd groupwide OPEC+ cut that remains in place mean for supply outlooks?
The completed 3.5 million bpd unwind reversed only the voluntary cuts introduced in 2023. A separate broader groupwide production restraint of approximately 2 million bpd remains active through end-2026, meaning the group retains meaningful capacity to adjust output if conditions require. Furthermore, OPEC+ restores production cuts but export risks still drive oil repricing regardless of what the policy ledger shows on paper.
How does the Caspian Pipeline Consortium disruption affect global oil balances?
The CPC carries more than 80% of Kazakhstan's crude exports. Repeated drone strikes on the Novorossiysk terminal have compressed Kazakh output from approximately 2.16 million bpd in June to approximately 1 million bpd, partially offsetting any supply additions implied by OPEC+ quota increases elsewhere.
How long will it take to rebuild global oil inventories even if disruptions end today?
Aramco's CEO has indicated rebuilding the approximately 2.6 billion barrels drawn down since the conflict began would require roughly 18 months of sustained net additions at 2.1 million bpd under an immediate normalisation scenario. This multi-year timeline is the structural foundation for the persistent premium on secure supply.
Disclaimer: This article contains forward-looking statements, forecasts, and analysis based on publicly available data and estimates from third-party sources including the IEA and EIA. These projections involve significant uncertainty and should not be relied upon as investment advice. Readers should conduct their own due diligence before making any investment decisions. Past performance and historical data do not guarantee future outcomes.
Want to Spot the Next Major ASX Mineral Discovery Before the Market Does?
While oil logistics risk reshapes global commodity economics and tightens margins across resource projects worldwide, Discovery Alert's proprietary Discovery IQ model scans ASX announcements in real time, instantly identifying significant mineral discoveries and turning complex data into actionable investment insights — explore historic discoveries and their exceptional returns to see what early positioning can mean, then begin your 14-day free trial to secure your market-leading edge.