
July 13, 2026
Understanding Shadow Banking's Liquidity Transformation Crisis
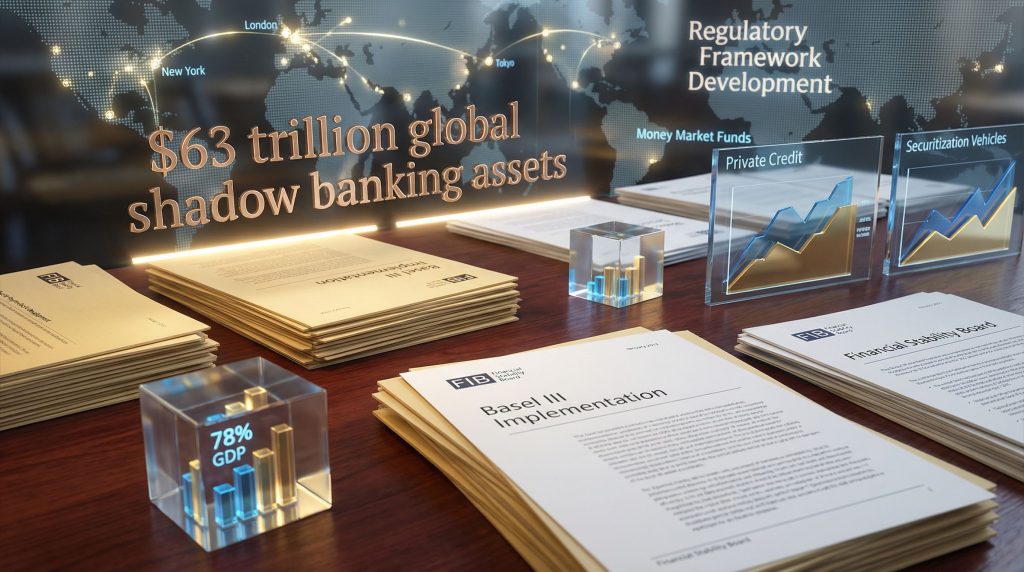
The global financial system faces mounting pressure from a $63 trillion shadow banking sector that operates outside traditional regulatory frameworks. A shadow banking liquidity crisis emerges when these non-bank financial intermediaries face fundamental mismatches between short-term funding commitments and long-term asset exposures, creating systemic vulnerabilities across financial markets.
Defining Non-Bank Financial Intermediaries and Their Risk Profile
Shadow banking entities encompass a diverse ecosystem including money market funds, securitisation vehicles, and private credit firms. According to Federal Reserve analysis, money market fund assets under management have surged from $4.4 trillion in 2021 to $8 trillion by December 2025, whilst yields increased from less than 1% to approximately 4%. This dramatic expansion represents an additional $3 trillion in high-net-worth capital earning an extra 3% annually, generating roughly $90 billion in incremental income.
The private credit market now encompasses $1.8 trillion in assets, with approximately $300 billion committed to quarterly liquidity promises to high-net-worth individuals through wealth management platforms. These quarterly redemption commitments create inherent structural risks when applied to fundamentally illiquid underlying assets.
Key Risk Metrics:
- Global shadow banking assets: $63 trillion (78% of global GDP)
- Regulatory coverage gap: Limited deposit insurance and central bank access
- Leverage concentration: High dependency on short-term funding markets
- Interconnectedness exposure: Extensive linkages to traditional banking sector
The Mechanics of Liquidity Mismatch in Shadow Banking
Shadow banking liquidity transformation operates through fundamental structural weaknesses that amplify systemic risk during market stress periods. Asset-backed commercial paper markets, overnight repo agreements, and quarterly redemption promises provide short-term funding for illiquid private credit portfolios, leveraged lending arrangements, and securitised assets with limited secondary market depth.
Traditional Banks vs. Shadow Banking Liquidity Comparison:
| Feature | Traditional Banks | Shadow Banking |
|---|---|---|
| Funding Sources | Deposits (FDIC insured) | Short-term markets |
| Liquidity Buffers | Required reserves, LCR | Market-dependent |
| Central Bank Access | Yes (discount window) | Limited/None |
| Regulatory Oversight | Comprehensive | Fragmented |
| Crisis Support | Lender of last resort | Market mechanisms only |
Market participants have observed significant stress indicators emerging in 2024-2025, including CoreWeave bond pricing deterioration from 104 in September 2024 to the low 90s by December 2025, representing yield expansion to approximately 12%. This single-B credit rating entity trades at double-C yield levels despite being a data centre development company, signalling broader market repricing of infrastructure credit risk.
When big ASX news breaks, our subscribers know first
What Are the Primary Triggers of Shadow Banking Liquidity Crises?
Market-Based Funding Stress Indicators
Credit market deterioration often precedes equity market recognition of fundamental stress by 3-12 months. Current market conditions reveal divergent signals where equity markets price in soft landing scenarios whilst credit markets reflect deteriorating risk perceptions. Furthermore, the gold market performance demonstrates investor flight to safety amid uncertainty.
Primary Stress Indicators:
- Repo market dysfunction: Collateral quality deterioration and funding rate volatility
- Money market fund redemption pressures: Institutional vs. retail fund stability differences
- ABCP market freezes: Asset-backed commercial paper liquidity evaporation
- Credit spread expansion: Widening across non-bank financial intermediary sectors
Regulatory and Policy Catalysts
The Federal Reserve has initiated $200 billion in "reserve management operations" over a five-month period whilst core CPI inflation remains at 2.8%. This intervention occurs at inflation levels 75% higher than the previous quantitative easing restart in 2019 when core CPI measured 1.6%, suggesting policy independence from traditional inflation dynamics.
Federal deficit expansion to $1.8 trillion (approximately 6% of GDP) compared to $600-800 billion (3% of GDP) during 2017-2018 represents unprecedented fiscal accommodation. Combined with $1.3 trillion in artificial intelligence infrastructure capital expenditure, this creates systematic pressure requiring continued monetary accommodation despite elevated inflation readings.
Interconnectedness Risk Factors
Shadow banking entities maintain extensive interconnections with traditional banks through prime brokerage relationships, warehouse lending facilities, derivative counterparty exposures, and liquidity facility dependencies. Atlanta Federal Reserve GDP nowcast readings of 3.12% indicate continued economic expansion, yet credit markets signal underlying stress through specific sector deterioration. In addition, record-high gold prices reflect growing investor concerns about financial system stability.
First Brands debtor-in-possession (DIP) financing traded at 30 cents on the dollar following September 2024 bankruptcy filing. DIP financing typically represents highest-quality collateral claims and historically trades near par value. This extreme pricing suggests severely overstated collateral valuations during original underwriting phases, potentially indicating systematic underwriting deterioration across private credit markets.
How Do Central Bank Interventions Address Shadow Banking Liquidity Stress?
Quantitative Easing as Shadow Banking Support Mechanism
Central bank liquidity operations provide critical support to shadow banking sectors during stress periods through multiple transmission mechanisms. The Federal Reserve's $200 billion reserve management operations represent extraordinary monetary accommodation occurring simultaneously with elevated inflation readings, creating conditions historically associated with asset price support across risk categories.
Major Central Bank Programs Comparison:
| Central Bank | Program Type | Target Sectors | Timeline |
|---|---|---|---|
| Federal Reserve | Reserve Management Ops | Banking liquidity | 5 months |
| European Central Bank | TLTRO III | Bank-NBFI relationships | Concluded 2024 |
| Bank of Japan | Corporate Financing | Shadow banking support | Ongoing |
| Bank of England | Gilt Market Operations | Pension fund stability | Periodic |
European Central Bank Targeted Longer-Term Refinancing Operations concluded in June 2024, removing approximately €2.6 trillion in low-cost funding that indirectly supported shadow banking through traditional bank intermediation. This withdrawal creates additional pressure on alternative funding markets.
Emergency Liquidity Facilities and Market Stabilisation
Historical precedents demonstrate central bank willingness to extend emergency support beyond traditional banking sectors during systemic stress. March 2020 COVID-19 market dysfunction required Federal Reserve intervention across corporate bond markets, Treasury securities, and money market fund sectors within 72 hours of initial stress manifestation.
Key Emergency Facility Types:
- Primary dealer credit facilities: Direct support to major market intermediaries
- Commercial paper funding facilities: Short-term corporate funding market support
- Term Asset-Backed Securities Loan Facilities (TALF): Securitisation market stabilisation
- Money market mutual fund liquidity facilities: Direct shadow banking sector support
Regulatory Forbearance and Supervisory Response
Regulatory authorities maintain discretionary powers to modify enforcement standards during stress periods. Accounting rule modifications, temporary capital requirement relaxations, and coordinated international responses provide systematic support mechanisms for shadow banking stability.
The Federal Reserve's current intervention occurs despite core inflation remaining 75% above previous QE restart thresholds, suggesting central bank recognition of underlying financial stability concerns independent of traditional monetary policy mandates.
Which Shadow Banking Sectors Face the Greatest Liquidity Vulnerabilities?
Private Credit Market Structural Weaknesses
The private credit industry has promised quarterly liquidity to wealth management platforms on approximately $300 billion of the total $1.8 trillion market. These quarterly redemption commitments create fundamental liquidity mismatches when applied to inherently illiquid underlying assets with limited secondary market depth.
Market participants report systematic underwriting degradation during 2021-2024 bull market conditions, creating hidden collateral value deterioration consistent with Charlie Munger's "mark-to-myth" valuation concerns. Private credit entities face refinancing pressures as leverage ratios exceed historical norms whilst underlying cash flow generation fails to support debt service requirements.
Private Credit Vulnerability Indicators:
- Market size: $1.8 trillion total assets under management
- Liquidity commitments: $300 billion quarterly redemption promises
- Valuation opacity: Limited mark-to-market pricing mechanisms
- Underwriting degradation: Systematic credit standard deterioration 2021-2024
Money Market Fund Industry Stress Points
Money market fund assets have expanded to $8 trillion from $4.4 trillion since 2021, driven by yield differential expansion and perceived safety advantages over traditional bank deposits. This concentration creates systematic risk through discrete threshold effects where redemption gates activate when fund liquidity drops below 30% of portfolio assets.
Money Market Fund Risk Matrix:
| Fund Type | AUM Concentration | Redemption Behaviour | Regulatory Treatment |
|---|---|---|---|
| Government Funds | High institutional | Stable during stress | Enhanced protection |
| Prime Funds | Mixed retail/institutional | Volatile during stress | Gate mechanisms |
| Tax-Exempt Funds | Municipal exposure | Credit-sensitive | Limited support |
Institutional money market fund investors demonstrate asymmetric redemption behaviours compared to retail participants, creating procyclical dynamics during stress periods. Gate mechanisms designed to prevent runs paradoxically trigger accelerated redemptions as remaining investors rush to exit before restrictions activate.
Securitisation Market Fragilities
Asset-backed securities markets face liquidity constraints through dealer inventory reductions and collateral quality concerns. Mortgage-backed securities, collateralised loan obligations, and credit card securitisations maintain complex interdependencies with traditional banking sector warehouse lending facilities.
CoreWeave bond deterioration from 104 to low 90s represents broader infrastructure credit stress as Not-In-My-Backyard (NIMBY) regulatory opposition delays data centre development timelines. This creates cascading credit stress through supply chain leverage and collateral value adjustments not reflected in traditional credit models.
What Historical Precedents Inform Current Shadow Banking Risk Assessment?
2008 Financial Crisis Shadow Banking Failures
Structured investment vehicle collapses during 2007-2008 provide critical insights into shadow banking liquidity transformation risks. Asset-backed commercial paper market freezes preceded broader financial system stress by approximately six months, demonstrating early warning system potential of shadow banking indicators.
Money market fund "breaking the buck" incidents created systematic investor flight to Treasury securities and government-backed alternatives. The Reserve Primary Fund's net asset value decline below $1.00 on September 16, 2008, triggered industry-wide redemption pressures requiring immediate Federal Reserve intervention.
2008 Crisis Timeline Key Events:
- June 2007: Bear Stearns hedge fund failures signal subprime stress
- August 2007: ABCP market freezes begin liquidity constraints
- March 2008: Bear Stearns acquisition prevents investment bank failure
- September 2008: Money market fund breaks buck, triggering systematic support
COVID-19 Pandemic Market Stress Testing
March 2020 market dysfunction demonstrated shadow banking vulnerabilities during external shock events. Treasury security liquidity evaporation, corporate bond market freezes, and money market fund outflow pressures required comprehensive Federal Reserve intervention across multiple markets simultaneously.
The Federal Reserve's response included $4.5 trillion balance sheet expansion and direct support to previously excluded market segments. This intervention prevented a shadow banking liquidity crisis but created moral hazard concerns regarding future private market discipline.
Regional Banking Crisis Lessons (March 2023)
Silicon Valley Bank's collapse revealed deposit flight dynamics to money market funds during traditional bank stress periods. Approximately $42 billion in deposits fled to money market funds within 24 hours, demonstrating accelerated transmission speeds in digital banking environments.
Credit Suisse Additional Tier 1 bond write-downs created systematic concerns regarding contingent convertible instrument treatment during stress periods. However, international regulatory coordination challenges emerged as Swiss authorities prioritised equity holders over bondholders, violating expected capital hierarchy assumptions.
How Should Regulators Strengthen Shadow Banking Oversight?
Macroprudential Policy Framework Development
Financial Stability Board monitoring indicates systematic data collection gaps regarding shadow banking risk accumulation. Enhanced stress testing requirements must incorporate non-bank financial intermediary failure scenarios and their spillover effects on traditional banking institutions.
Liquidity coverage ratio equivalents for shadow banking entities would require minimum liquid asset holdings proportional to short-term liabilities. Current private credit quarterly redemption promises lack corresponding liquidity buffer requirements, creating systematic risk during stress periods.
Recommended Regulatory Enhancements:
- Data collection expansion: Real-time shadow banking exposure monitoring
- Stress testing inclusion: NBFI failure scenario modelling
- Liquidity requirements: Minimum buffer standards for redemption promises
- Interconnectedness mapping: Traditional bank-shadow bank exposure limits
International Regulatory Coordination Mechanisms
Financial Stability Board annual "Global Monitoring Reports on Non-Bank Financial Intermediation" provide baseline data, but enforcement mechanisms remain fragmented across jurisdictions. Basel Committee guidance on bank-NBFI interactions requires standardisation to prevent regulatory arbitrage.
International Organisation of Securities Commissions (IOSCO) money market fund reforms address some structural vulnerabilities but lack comprehensive implementation across major financial centres. G20 policy coordination remains essential for systematic risk mitigation in globally interconnected shadow banking markets.
Market Infrastructure Resilience Building
Central counterparty clearing expansion requirements would reduce bilateral counterparty risk in derivative markets connecting traditional banks and shadow banking entities. Repo market transparency initiatives must include standardised reporting across all market participants.
Emergency liquidity access for systemically important non-bank financial intermediaries requires careful design to avoid moral hazard whilst preventing systematic collapse. Collateral framework standardisation across jurisdictions would improve crisis response coordination.
The next major ASX story will hit our subscribers first
What Investment Implications Emerge from Shadow Banking Liquidity Analysis?
Portfolio Risk Management Strategies
Current market conditions suggest rotation from financial assets concentrated in growth sectors toward hard asset exposure. NASDAQ 100 market capitalisation expansion from $12.3 trillion to $32 trillion over three years creates systematic concentration risk requiring diversification strategies. Furthermore, gold stock dynamics provide valuable insights into alternative asset allocation approaches.
Sector Rotation Dynamics:
| Timeframe | NASDAQ 100 Value | Energy Sector Value | Ratio Impact |
|---|---|---|---|
| December 2013 | $4.0 trillion | $3.4 trillion | Balanced |
| December 2025 | $32.0 trillion | $2.8 trillion | 11.4:1 |
| Historical Peak (1968-1981) | N/A | 50% of S&P 500 | Energy dominant |
Credit quality assessment beyond traditional ratings becomes essential as private credit underwriting standards deteriorated during 2021-2024 bull market conditions. Duration risk management during policy transitions requires careful monitoring of Federal Reserve intervention timing and magnitude.
Sector Rotation Opportunities During Stress Periods
Gold and silver mining equities demonstrated 140% appreciation from $290 billion combined market capitalisation, whilst copper mining companies advanced 81% on the year. These gains exceed Magnificent Seven performance by 400%, indicating systematic capital rotation toward hard asset exposure.
Traditional banking sector relative strength emerges during shadow banking stress as deposit flight concentrates assets in regulated institutions with Federal Reserve support access. In addition, the silver market squeeze demonstrates how precious metals markets respond to financial uncertainty.
Resource Sector Performance Metrics:
- Gold/Silver Miners: 140% appreciation from $290 billion baseline
- Copper Miners: 81% annual gains vs. Magnificent Seven 20%
- Natural Gas Equity ETF (FCG): Free cash flow yield opportunities
- Coal Sector: 15% free cash flow yields with share buyback programmes
Long-term Structural Investment Themes
Artificial intelligence infrastructure demands create systematic power grid expansion requirements, supporting copper price trends and aluminium equity opportunities. Energy Transfer Limited provides 8% dividend yields with dividend doubling over four years, reflecting infrastructure investment themes.
International value equity outperformance relative to S&P 500 returns historically indicates multi-year trend continuation rather than single-year events. United Kingdom equity ETFs (EWU) and global value strategies benefit from relative valuation discounts accumulated during 2010-2020 disinflationary period.
Brazil presents compelling opportunity with 15% real interest rates (after inflation) providing central bank cutting room whilst October 2026 elections could shift political landscape toward centre-right governance. Petrobras and EWZ provide commodity exposure with potential monetary easing and political stability catalysts.
Navigating Shadow Banking Liquidity Risk in 2025-2026
Key Monitoring Indicators for Investors and Policymakers
Federal Reserve reserve management operations represent critical early warning signals for systematic liquidity stress. The current $200 billion five-month intervention occurring at 2.8% core inflation levels suggests central bank recognition of financial stability concerns independent of traditional monetary policy mandates.
Essential Monitoring Framework:
- Credit-equity divergence signals: Oracle bond weakness vs. banking sector rallies
- Money market fund flow analysis: $8 trillion AUM concentration risk
- Private credit stress indicators: Quarterly redemption pressure on $300 billion
- Cross-border spillover assessment: USD liquidity transmission mechanisms
Corporate bond yield expansion in high-quality credits signals systematic repricing ahead of equity market recognition. CoreWeave 12% yields on single-B credits and First Brands DIP financing at 30 cents indicate broad-based credit deterioration beyond headline economic indicators.
Strategic Recommendations for Market Participants
Portfolio diversification requires careful attention to correlation dynamics during stress periods. Systematic events drive correlation toward unity, affecting traditional diversification strategies across asset classes. However, gradual rotation events maintain beneficial diversification across value-growth and domestic-international exposures.
Risk Management Best Practices:
- Correlation monitoring: Systematic vs. rotational stress differentiation
- Liquidity assessment: Quarter-end, month-end rotation probability enhancement
- Geographic diversification: International value equity exposure
- Hard asset allocation: Natural resources, infrastructure, commodity exposure
Value stock outperformance and international equity gains relative to domestic growth stocks historically indicate six to seven-year trend continuation rather than single-year anomalies. This suggests systematic portfolio reallocation toward previously underperforming sectors and geographic regions.
Energy sector free cash flow yields of 15% combined with share buyback programmes create compelling risk-adjusted return opportunities. Range Resources and Antero Resources provide natural gas exposure with debt reduction track records and robust cash generation supporting systematic share repurchases.
Disclaimer: This analysis contains forward-looking statements and speculative assessments regarding financial market conditions, regulatory changes, and economic trends. Market conditions can change rapidly, and past performance does not guarantee future results. Investors should conduct independent research and consider consulting qualified financial advisors before making investment decisions. Economic forecasts, political predictions, and market timing assessments involve substantial uncertainty and may prove inaccurate.
Ready to Capitalise on Market Dislocations Before They Become Mainstream?
Shadow banking stress often creates compelling opportunities in resource sectors and alternative investments that traditional markets overlook. Discovery Alert's proprietary Discovery IQ model delivers instant notifications on significant ASX mineral discoveries, helping investors identify actionable opportunities during market rotations when capital seeks hard asset exposure for portfolio protection.