
May 22, 2026
Understanding the Structural Forces Behind Silver's Price Movements
Market volatility patterns in precious metals reflect underlying structural characteristics rather than random price fluctuations. When analyzing why silver is more volatile than gold, the mechanics become clear through examination of trading systems, liquidity frameworks, and demand patterns that create systematic price amplification effects across different market environments.
Silver's price behaviour demonstrates mathematical relationships between market depth and volatility coefficients that operate independently of sentiment or speculation. These structural forces create predictable amplification patterns where equivalent capital flows generate disproportionate price responses across the two metals.
How Market Capitalisation Differences Create Price Impact Asymmetries
The Mathematics of Market Size Disparities
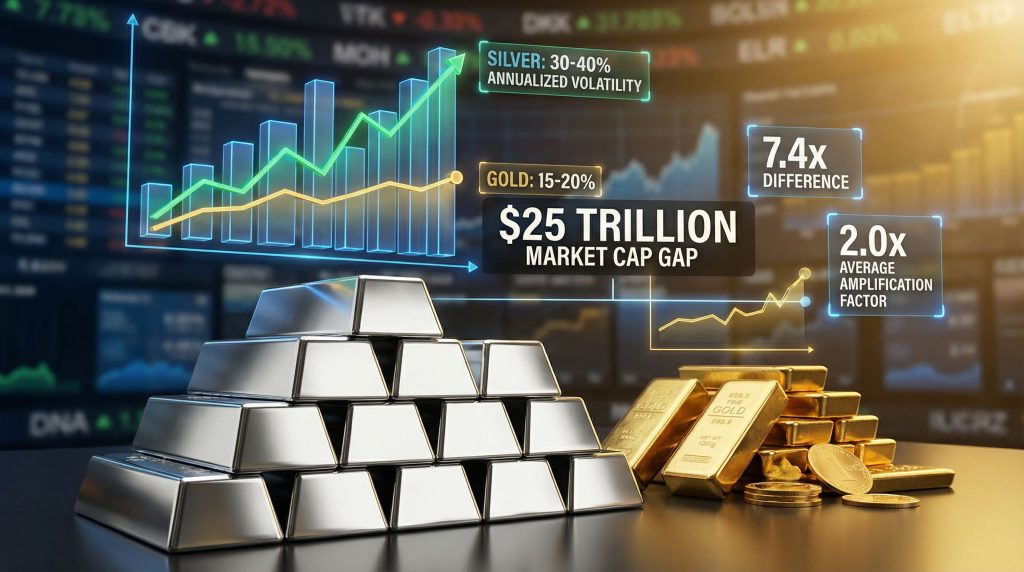
Gold's total above-ground stock of approximately 216,000 tonnes commands a market valuation near $29 trillion at current pricing levels around $4,166 per troy ounce. Silver's comparable market capitalisation sits at approximately $3.9 trillion, creating a 7.4 times differential in total market size.
This size gap creates mathematical relationships where identical capital flows produce vastly different price impacts. A $1 billion institutional position entering gold's $29 trillion market represents 0.0034% of total market value, while the same position in silver's market represents 0.026% – nearly 8 times the proportional impact.
| Market Structure Comparison | Gold | Silver | Impact Ratio |
|---|---|---|---|
| Total Market Capitalisation | $29 trillion | $3.9 trillion | 7.4x difference |
| Above-Ground Stock Base | 216,000 tonnes | Variable consumption | Supply uncertainty |
| Institutional Impact Threshold | Higher | Lower | 8x sensitivity |
Order Flow Mechanics in Constrained Environments
Deep markets absorb large orders across multiple price levels without significant displacement, while thin markets require price movement to locate sufficient liquidity. Gold's market structure contains substantial bid and ask orders at various price points, allowing institutional-scale transactions to execute with minimal price disruption.
Silver's thinner order books require larger price movements to clear equivalent transaction sizes. This creates systematic amplification where moderate buying or selling pressure generates disproportionate price responses as orders move through fewer available liquidity layers.
The relationship extends beyond simple market cap ratios. Much of silver's historical supply has been consumed in industrial applications, effectively removing it from the tradeable pool. This compounds the volatility effect by reducing the actual liquid market size below the theoretical $3.9 trillion figure.
When big ASX news breaks, our subscribers know first
Daily Liquidity Patterns and Their Volatility Implications
Trading Volume Disparities Across Market Segments
Gold's daily trading volumes reached $227 billion in 2024, representing a 39% increase from 2023 levels. This volume approaches that of major currency pairs in foreign exchange markets, indicating institutional-grade liquidity depth.
Silver's daily volume averages approximately $25 billion across comparable timeframes, creating roughly a 6:1 trading volume disadvantage. This disparity manifests across all major trading venues:
- OTC Markets: Gold $97 billion daily vs Silver $13 billion daily
- Futures Markets: Gold $55 billion daily vs Silver $11 billion daily
- ETF Trading: Gold $2.3 billion daily vs Silver $0.7 billion daily
Bid-Ask Spread Analysis and Transaction Efficiency
Liquidity constraints translate directly into transaction cost differentials. Gold's deeper market typically maintains bid-ask spreads of 0.01%-0.05% of spot price, while silver's spreads range 0.10%-0.30% – proportionally 3-6 times wider.
These spread differentials compound across large position sizes. Institutional investors face materially higher transaction costs in silver, which accumulates into significant drag on position entry and exit efficiency. Market makers demand wider spreads in silver to compensate for inventory holding risks in the more volatile environment.
Liquidity Impact: Silver's 6:1 trading volume disadvantage creates systematic constraints where moderate institutional flows generate significant price movements, while gold's deeper market absorbs similar capital with minimal disruption.
Market Maker Inventory Management Challenges
Professional liquidity providers adjust their risk parameters based on underlying asset volatility and inventory turnover capabilities. In silver's constrained market, dealers require wider profit margins to offset the higher probability of adverse price movements during inventory holding periods.
This creates self-reinforcing cycles where reduced liquidity provision leads to wider spreads, which in turn reduces retail participation, further constraining overall market liquidity. Gold's deeper market breaks this cycle through sufficient volume to support multiple competing market makers.
Industrial Demand's Dual-Market Volatility Creation
The Commodity-Monetary Metal Conflict
Silver operates simultaneously as a monetary store of value and an industrial input, creating dual sensitivity patterns absent in gold's primarily monetary role. Industrial applications including solar panel manufacturing, semiconductor production, and medical equipment represent significant demand streams tied to economic cycles rather than monetary policy.
Approximately 66% of silver supply originates as byproduct from base metal mining operations focused on copper, zinc, and lead extraction. This supply structure means silver production responds to base metal economics rather than silver-specific market conditions, creating periodic supply-demand disconnects.
Supply Chain Disruption Amplification
Silver's industrial consumption creates permanent demand destruction – unlike gold's accumulative above-ground stock, industrial silver is consumed and removed from the monetary pool. This consumption pattern reduces the effective tradeable supply over time whilst creating supply chain dependency risks.
Manufacturing disruptions in key sectors can create sudden demand shifts independent of precious metals sentiment. Solar industry policy changes, semiconductor cycle fluctuations, or automotive sector transitions each influence silver demand through channels that do not affect gold pricing. Furthermore, the mining industry evolution continues to reshape supply dynamics across precious metals markets.
Geographic Concentration and Political Risk
Primary silver mining concentrates in specific jurisdictions where political instability, labour disputes, or environmental regulations can disrupt supply flows. Unlike gold's more diversified geographic production base, silver faces higher concentration risks that translate into price volatility during supply disruptions.
Silver's High-Beta Characteristics in Risk Cycles
Mathematical Correlation with Gold Returns
Historical analysis reveals silver consistently exhibits 1.5-3x amplification of gold's price movements across different market regimes. This beta relationship operates through both fundamental and technical factors, creating predictable leverage effects during precious metals cycles. In addition, the silver performance vs gold demonstrates these amplification patterns across various market conditions.
| Volatility Analysis (20-Year Period) | Gold | Silver | Amplification |
|---|---|---|---|
| Annualised Volatility | 15-20% | 30-40% | 2.0x average |
| Maximum Daily Movement | 8-12% | 15-25% | 2.1x average |
| Drawdown Severity | Moderate | Severe | 2.5x average |
Risk-On/Risk-Off Cycle Sensitivity
During flight-to-quality periods, institutional capital flows prioritise gold's deeper liquidity and lower volatility profile. Silver experiences proportionally larger outflows as investors seek maximum stability during market stress periods.
Conversely, during risk-on environments, silver attracts disproportionate speculative positioning due to its higher potential returns. This asymmetric flow pattern amplifies both upside and downside price movements relative to gold's more stable institutional base.
Leverage Usage and Speculative Positioning
Silver's higher volatility attracts leveraged speculation through futures and options markets. The concentration of leveraged positions creates additional volatility layers during position unwinding or margin call events that affect silver more severely than gold's less leveraged institutional base. Moreover, why silver is more volatile than gold becomes evident when examining these leverage dynamics.
Historical Volatility Cycles and Performance Patterns
Bull Market Outperformance Analysis
Major precious metals rallies consistently demonstrate silver's amplified performance characteristics. During the 1979-1980 precious metals surge, silver outperformed gold by significant margins. Similar patterns emerged during 2008, 2011, and the 2020-2021 cycles.
In 2025, silver gained over 150% whilst gold climbed approximately 66%, demonstrating the typical 2.3x outperformance ratio during favourable market conditions. This amplification reflects the structural factors previously discussed rather than fundamental value differences.
Bear Market Underperformance Severity
Silver's volatility operates symmetrically – downside movements typically exceed gold's declines by similar amplification factors. During the post-2011 correction, silver experienced more severe percentage declines and required longer recovery periods than gold.
Industrial demand collapse during recessions compounds monetary selling pressure, creating dual headwinds absent in gold's pricing. This explains why silver often underperforms during economic contractions despite precious metals' general counter-cyclical reputation. The silver market squeeze impact demonstrates these dynamics during periods of heightened volatility.
Recovery Timeline Disparities
Historical recovery patterns show silver requires more time to regain previous highs following major corrections. Gold's institutional bid and lower volatility create more predictable recovery trajectories, whilst silver faces both monetary and industrial demand normalisation requirements.
Portfolio Positioning Strategies for High-Volatility Assets
Risk Budgeting Approaches
Professional portfolio management treats silver as a leveraged precious metals position rather than a direct gold substitute. Typical allocation strategies use gold as the core precious metals position whilst limiting silver to 2-5% of total portfolio value to capture amplification benefits without excessive volatility exposure.
Volatility-adjusted position sizing recognises that silver's 2x+ volatility requires proportionally smaller position sizes to achieve equivalent risk contributions. A 5% silver position carries similar portfolio impact to a 10-12% gold position in volatility terms.
Tactical Entry Point Optimisation
The gold-silver ratio analysis serves as a tactical allocation tool, with ratios above 80:1 historically favouring silver positioning and ratios below 50:1 suggesting gold preference. Current ratio levels near historical norms provide context for relative value assessments.
Dollar-cost averaging approaches help manage silver's volatility by spreading entry points across time periods, reducing the impact of unfavourable timing. This contrasts with tactical positioning strategies that attempt to time specific entry and exit points.
Risk Management Framework Implementation
Stop-loss strategies in silver markets require wider parameters to account for normal volatility ranges. Standard 5-10% stops appropriate for gold may trigger frequently in silver's more volatile environment, requiring 15-20% stop levels for equivalent protective purposes.
Correlation monitoring becomes essential during market stress periods when silver's typical relationship with gold may break down. Position sizing should account for potential correlation instability during crisis periods.
Investment Framework: Silver functions as a leveraged play on precious metals themes rather than a stability-focused allocation. Successful positioning requires understanding this amplification characteristic and sizing positions accordingly.
The next major ASX story will hit our subscribers first
Current Market Structure Evolution and Future Implications
Green Energy Transition Impact Assessment
Expanding solar panel manufacturing and electric vehicle production create new industrial demand streams for silver that may alter traditional volatility patterns. These applications represent growing consumption that permanently removes silver from the monetary pool.
However, technological substitution risks and efficiency improvements may reduce silver intensity per unit of production over time. The net impact on supply-demand balance requires monitoring both volume growth and technological changes in key applications.
Market Microstructure Developments
ETF growth has democratised precious metals access but potentially altered price discovery mechanisms. Retail investor participation through ETF platforms may have changed traditional institutional dominance in silver markets, though volume data suggests institutional flows remain primary drivers.
Algorithmic trading systems now participate in precious metals markets, potentially increasing short-term volatility whilst improving price efficiency across different trading venues. The net impact on silver's structural volatility characteristics remains unclear but bears monitoring. The silver squeeze transformation continues to influence these market dynamics.
Regulatory and Structural Changes
Position limit modifications in futures markets could affect the concentration of speculative positions that contribute to silver volatility. Lower position limits might reduce individual participant impact whilst potentially increasing the number of participants required to achieve equivalent position sizes.
Central bank digital currency developments and changing monetary policy frameworks may alter precious metals' monetary demand characteristics over longer time horizons. Silver's industrial demand base provides partial insulation from pure monetary demand shifts.
Why Silver is More Volatile than Gold: The Complete Picture
Economic Cycle Sensitivity Analysis
Silver's volatility exhibits cyclical patterns tied to both monetary policy cycles and industrial economic activity. Recession periods typically combine flight-to-quality outflows with industrial demand destruction, creating compounded downside pressure.
Expansion periods generate opposite forces – increasing industrial demand and risk-on capital flows toward higher-beta assets. This dual sensitivity creates more extreme price movements than gold's primarily monetary demand base experiences.
Interest rate environments affect silver differently than gold due to industrial demand sensitivity to economic activity levels. Rising rates that constrain economic growth impact silver through both monetary and industrial channels simultaneously.
Comparison with Other Precious Metals
Platinum and palladium exhibit similar industrial demand characteristics but lack silver's monetary heritage and market size. Their volatility patterns reflect pure industrial-commodity dynamics rather than the hybrid monetary-industrial profile that defines silver.
Silver's unique position as both a historical monetary metal and modern industrial input creates volatility characteristics distinct from other precious metals. This dual identity explains why silver correlates with but amplifies gold's movements whilst maintaining sensitivity to industrial cycles.
The investment demand versus industrial demand balance in silver creates complexity absent in gold's straightforward monetary role or platinum's predominantly industrial applications. This balance shifts across economic cycles, altering silver's volatility characteristics over time.
Understanding why silver is more volatile than gold requires recognising the structural, liquidity, and demand characteristics that create systematic price amplification. These factors operate through mathematical relationships between market depth and capital flow impact rather than sentiment-driven speculation.
Silver's smaller market size, reduced liquidity, dual-demand profile, and byproduct supply structure combine to create an environment where equivalent forces generate amplified price movements compared to gold's deeper, more stable market structure. This amplification operates symmetrically across both upside and downside price movements, creating both opportunity and risk for investors who understand these underlying dynamics.
This analysis is for informational purposes only and does not constitute financial or investment advice. Precious metals investments involve risk and may result in partial or total loss. Always consult qualified financial advisors before making investment decisions.
Looking for Precious Metals Investment Opportunities?
Discovery Alert's proprietary Discovery IQ model delivers real-time alerts on significant ASX mineral discoveries, including precious metals like silver and gold, instantly empowering subscribers to identify actionable opportunities ahead of the broader market. Understand why historic discoveries can generate substantial returns by visiting Discovery Alert's dedicated discoveries page and begin your 14-day free trial today to position yourself ahead of the market.