June 27, 2026
The global energy landscape stands at a critical juncture where geopolitical tensions threaten to reshape decades of established supply chains and market dynamics. A strait of hormuz oil crisis represents one of the most significant risks to international energy security, given this narrow waterway's role in facilitating approximately 21% of global petroleum flows. While modern economies have diversified their energy portfolios, certain geographic bottlenecks remain capable of triggering systemic shocks across interconnected markets. Understanding these vulnerabilities requires examining not just immediate supply disruptions, but the cascading economic effects that ripple through industrial sectors, financial markets, and investment opportunities when critical maritime routes face potential closure.
Understanding the Strait of Hormuz's Critical Role in Global Energy Security
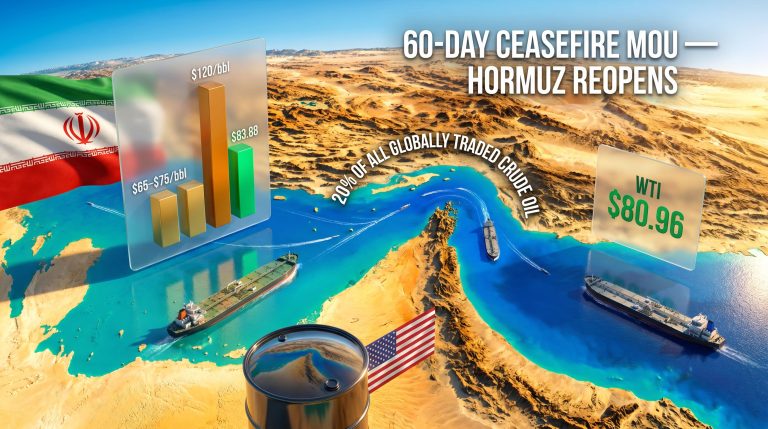
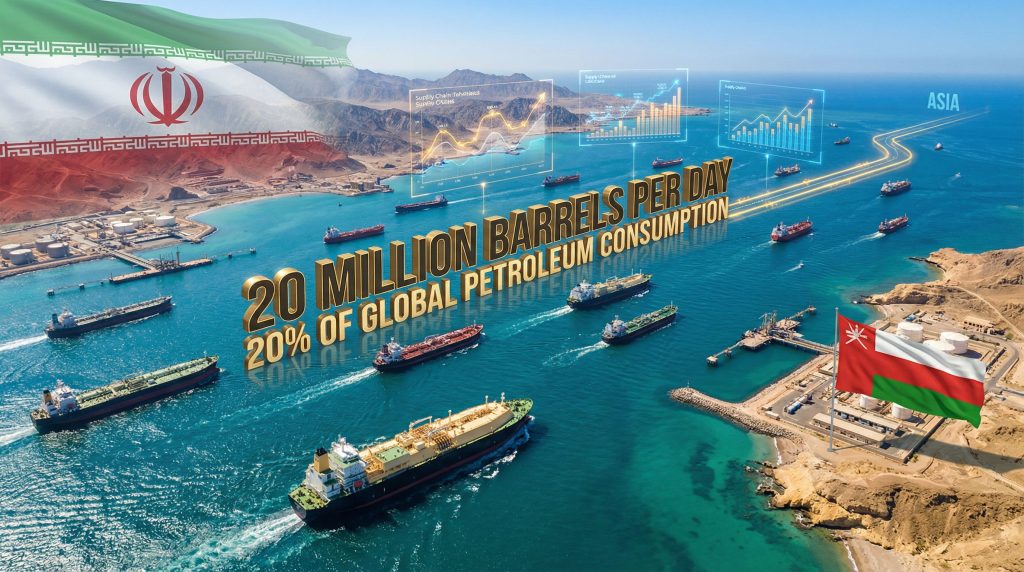
The narrow waterway between Iran and Oman represents far more than a shipping channel; it functions as the circulatory system for global petroleum markets. This geographic chokepoint measures approximately 21-33 kilometers at its narrowest section, with navigable channels reaching depths of just 9 meters. Despite these physical constraints, the strait facilitates the passage of roughly 21 million barrels per day of crude oil, representing approximately 21% of global petroleum consumption.
Geographic Significance and Strategic Positioning
Maritime navigation through the Strait of Hormuz presents unique challenges that extend beyond simple geography. The waterway's complex underwater topology requires specialized piloting for large tankers, while territorial jurisdictions between Iran's northern coastline and Oman's southern territory create additional regulatory complexities. These factors combine to make the strait irreplaceable in near-term scenarios, as no alternative route possesses comparable capacity or accessibility.
The strategic positioning becomes particularly critical when considering Iran's energy resources. The country maintains proven crude oil reserves of approximately 157.8 billion barrels, ranking fourth globally and representing roughly 8.5% of worldwide proven reserves. Iran's current production capacity stands between 3.2-3.8 million barrels per day, though actual output remains constrained by international sanctions.
Volume and Scale of Energy Transit
Beyond crude oil, the Strait of Hormuz handles approximately 20-25% of globally traded liquefied natural gas (LNG), making it essential for energy security across multiple fuel types. This concentration creates asymmetrical vulnerability patterns, with Asia-Pacific markets bearing disproportionate exposure.
Daily Energy Flows Through Hormuz:
| Energy Type | Daily Volume | Global Market Share | Primary Destinations |
|---|---|---|---|
| Crude Oil | 21 million barrels | 21% | China, India, Japan, South Korea |
| LNG | 4.2 billion cubic feet | 22% | Asia-Pacific, Europe |
| Refined Products | 3.2 million barrels | 15% | Regional distribution |
Economic Dependencies and Supply Chain Vulnerabilities
The concentration of energy flows through this single chokepoint creates critical dependencies for major economies. Research from the International Energy Agency indicates that over 69% of oil transiting Hormuz serves Asia-Pacific markets, with China, India, Japan, and South Korea functioning as primary importers. This geographic concentration means that disruption effects would not distribute evenly across global markets.
Alternative routing infrastructure operates at substantially lower capacity and cannot accommodate the full range of international customers served through Hormuz. The Saudi East-West Pipeline transports approximately 5 million barrels per day, while UAE pipeline systems handle roughly 1.5 million barrels per day. Combined, these alternatives represent less than one-third of typical Hormuz volumes.
When big ASX news breaks, our subscribers know first
What Economic Shockwaves Would Follow a Strait of Hormuz Disruption?
Historical analysis reveals that energy supply shocks trigger fundamentally different market dynamics compared to demand-driven price movements. During supply-side crises, crude oil demonstrates extreme price inelasticity, with short-term demand elasticity measuring approximately -0.05 to -0.10. This means a 20% supply reduction could require price increases of 100-200% to restore market equilibrium.
Immediate Oil Price Dynamics and Market Response
Previous energy crises provide instructive precedents for understanding potential price trajectories during a strait of hormuz oil crisis scenario. The 1973 Arab Oil Embargo triggered crude oil price increases of approximately 300%, rising from $3 to $12 per barrel over the embargo period. Furthermore, oil price rally insights from recent geopolitical developments suggest similar volatility patterns. During the 1980-1988 Tanker War, WTI crude averaged $35-$40 per barrel, representing a 400%+ increase from early 1970s baseline levels.
Recent prediction market data suggests current market expectations align with historical precedents, pricing in significant probability of rapid price escalation during supply disruption scenarios.
Contemporary market positioning reflects these historical patterns. Current WTI crude prices around $67 per barrel face potential upward pressure, with prediction markets indicating 77% probability of exceeding $80 per barrel within month-long disruption scenarios. Moreover, oil price trade war dynamics demonstrate how geopolitical tensions amplify market volatility. More extreme scenarios price 50% probability of exceeding $90 per barrel, representing potential gains of 34% or more.
Cascading Effects Across Global Industries
Energy price shocks transmit through economies via three primary channels, each operating on different timescales:
1. Direct Energy Costs (1-3 weeks)
- Transportation fuel price increases
- Electricity generation cost escalation
- Heating and industrial energy expenses
2. Input Cost Inflation (2-8 weeks)
- Petrochemical feedstock price rises
- Fertilizer production cost increases
- Manufacturing input price pressures
3. Demand Destruction Effects (8-16 weeks)
- Consumer spending reallocation
- Business investment postponement
- Economic growth deceleration
International Monetary Fund research indicates that sustained $30 per barrel price increases reduce global GDP growth by 0.5-1.0 percentage points within twelve months, illustrating the macroeconomic significance of energy price shocks.
Regional Economic Vulnerability Assessment
Geographic proximity to alternative energy supplies and existing infrastructure determines regional vulnerability patterns during strait of hormuz oil crisis events. Asia-Pacific economies face the highest exposure due to import dependence and limited alternative supply routes. However, the broader implications of trade war global impacts suggest additional complexity in supply chain adjustments. European markets experience secondary effects primarily through LNG shortages and industrial input cost increases.
Transportation Sector Impact Analysis:
| Sector | Cost Increase Timeline | Typical Price Response | Recovery Period |
|---|---|---|---|
| Container Shipping | 2-4 weeks | 15-25% rate increases | 6-12 months |
| Airlines | 30-45 days | 8-12% fuel cost rises | 12-18 months |
| Trucking | 1-2 weeks | 10-20% fuel surcharges | 3-6 months |
North American markets demonstrate relative insulation due to domestic production capabilities, though indirect effects through currency markets and global trade volumes remain significant.
Which Investment Sectors Would Benefit from Hormuz Crisis Scenarios?
Energy sector equities historically demonstrate strong correlation with crude oil price movements during supply disruption periods. Reuters analysis of recent Middle East tensions shows how quickly markets react to supply threat indicators. The 2008 crude oil spike to $147 per barrel generated 30-50% stock price increases for integrated oil majors during the January-June period, with companies like ExxonMobil and Chevron outperforming broader indices by 35-45%.
Energy Infrastructure and Alternative Supply Routes
Pipeline infrastructure represents immediate beneficiaries of strait of hormuz oil crisis scenarios. Saudi East-West Pipeline expansion projects target 8-10 million barrels per day capacity, requiring estimated $8-12 billion investment. UAE pipeline modernization similarly presents multi-billion dollar opportunities as regional economies seek Hormuz alternatives.
Canadian oil sands operations, exemplified by companies like Suncor Energy with 600,000 barrels per day production capacity, benefit from sustained higher price environments. These operations typically require $40-60 per barrel breakeven prices, making them particularly profitable during crisis-driven price spikes. In addition, energy transition security considerations drive investment towards domestic energy sources.
Strategic petroleum reserve utilisation creates additional market dynamics. The International Energy Agency coordinates release mechanisms during supply disruptions, though reserve capacity limitations mean sustained disruptions require market-based solutions rather than government intervention.
Shipping and Maritime Security Industries
Insurance markets experience dramatic repricing during maritime security crises. Lloyd's of London historical data shows Persian Gulf transit premiums increasing from 0.5% to 15-20% of cargo value during the 1980-1988 Tanker War, representing 30-40x premium increases. Current baseline premiums of 0.5-1.5% of cargo value typically escalate 5-15x within 24-48 hours of disruption recognition.
Maritime security technology markets, valued at approximately $8-12 billion annually, demonstrate compound annual growth rates of 15-20% in advanced surveillance and autonomous systems during heightened geopolitical tensions.
Alternative routing through the Cape of Good Hope adds approximately 15 days to Asia-bound shipments, creating capacity constraints and rate increases across global shipping markets. Container shipping rates typically increase 15-25% within 2-4 weeks following oil price spikes, as bunker fuel costs rise proportionally.
Geopolitical Risk Hedge Investments
Safe-haven assets demonstrate predictable performance patterns during energy security crises:
- U.S. Treasury bonds: Yield compression of 200-300 basis points during initial shock periods
- Gold: Appreciation of 8-15% during 30-day windows following geopolitical shocks
- Swiss Franc: Strengthening of 3-7% versus major currency baskets
- U.S. Dollar Index: Gains of 2-5% during supply shock periods
Defense and security technology sectors benefit from increased maritime security spending. The U.S. Department of Defense allocates approximately 15-18% of its $820 billion annual budget toward naval operations and maritime security systems, with Middle East operations consuming 5-7% of total defense spending.
How Do Historical Hormuz Crises Inform Current Risk Assessment?
The 1980-1988 Iran-Iraq conflict, known as the Tanker War, provides the most comprehensive historical precedent for understanding strait of hormuz oil crisis scenarios. During this period, approximately 540 merchant ships suffered attacks in or near the Persian Gulf, yet continued traffic flow demonstrated maritime industry resilience under extreme conditions.
Tanker War Precedents and Market Lessons
Despite widespread attacks on commercial vessels, global oil markets adapted through several mechanisms:
- Insurance market evolution: War risk coverage expanded rapidly, though at dramatically higher premiums
- Naval convoy protection: International naval forces provided merchant vessel escort services
- Route optimisation: Shipping companies modified schedules and routing to minimise exposure
- Inventory management: Commercial and strategic reserves buffered temporary supply disruptions
Recovery timelines following the conflict's conclusion in 1988 demonstrated market efficiency in repricing geopolitical risk. Insurance premiums normalised within 6-12 months of conflict termination, while shipping rates returned to pre-war levels within 18-24 months.
Modern Technological and Geopolitical Differences
Contemporary warfare capabilities present fundamentally different risk profiles compared to 1980s technologies. Advanced missile and drone systems enable precision targeting at extended ranges, while cyber warfare dimensions introduce additional attack vectors against maritime infrastructure and navigation systems.
International alliance structures have evolved significantly since the Tanker War period. NATO Article 5 collective defence provisions, regional security partnerships, and coordinated naval presence in the Persian Gulf create different deterrent effects and response mechanisms.
Modern shipping technology includes advanced tracking systems, autonomous navigation capabilities, and improved communication networks. These technologies potentially reduce response times during crisis scenarios while improving situational awareness for commercial operators.
Insurance and Risk Pricing Evolution
Lloyd's of London assessment methodologies have incorporated sophisticated modelling techniques for evaluating maritime risk during conflicts. Current risk pricing frameworks consider:
Historical vs. Current Risk Premium Structures:
| Period | Baseline Premium | Crisis Multiplier | Maximum Premium |
|---|---|---|---|
| 1980s Tanker War | 0.3% | 30-40x | 15-20% |
| 2019 Hormuz Tensions | 0.5% | 8-12x | 4-6% |
| Current Assessment | 0.5-1.5% | 5-15x | 7.5-22.5% |
Commercial shipping decision-making frameworks now incorporate real-time risk assessment tools, enabling dynamic route optimisation and insurance coverage adjustments based on evolving threat levels.
What Alternative Energy Routes Could Mitigate Hormuz Dependencies?
Existing pipeline infrastructure provides limited alternatives to Hormuz transit, with combined capacity representing less than half of typical strait volumes. The Saudi East-West Pipeline operates at 5 million barrels per day capacity with expansion projects targeting 8-10 million barrels per day. UAE pipeline alternatives handle approximately 1.5 million barrels per day, while Iraq-Turkey and Iraq-Jordan routes process additional regional production.
Existing Pipeline Infrastructure and Capacity
Pipeline alternatives face several operational constraints that limit their effectiveness as Hormuz substitutes:
- Capacity limitations: Combined alternative capacity serves roughly 40% of current Hormuz volumes
- Geographic restrictions: Pipelines serve specific regional markets rather than global distribution
- Infrastructure investment: Capacity expansion requires multi-year development timelines and substantial capital investment
- Political stability: Alternative routes traverse regions with varying degrees of political risk
The proposed expansion of Saudi East-West Pipeline capacity to 8-10 million barrels per day requires estimated $8-12 billion investment and 3-5 year construction timelines, illustrating the challenges of rapidly developing alternative infrastructure.
Strategic Reserve Utilisation Strategies
International Energy Agency coordinated release mechanisms provide temporary market stabilisation during supply disruptions, though reserve capacities limit sustained intervention capability. U.S. Strategic Petroleum Reserve holds approximately 714 million barrels, while IEA member countries maintain combined reserves exceeding 1.5 billion barrels.
Reserve release effectiveness depends on coordination timing and market conditions:
Strategic Reserve Impact Analysis:
| Release Volume | Market Impact Duration | Price Effect | Coordination Requirements |
|---|---|---|---|
| 30 million barrels | 15-30 days | 5-10% price reduction | Single-country action |
| 60 million barrels | 30-60 days | 10-20% price reduction | Bilateral coordination |
| 120+ million barrels | 60-120 days | 20%+ price reduction | Multilateral IEA action |
Commercial inventory drawdown scenarios provide additional market support, though private companies optimise inventory management for profitability rather than market stabilisation objectives.
Long-term Structural Adaptations
Energy transition acceleration represents the most significant long-term adaptation to strait of hormuz oil crisis vulnerabilities. Crisis-driven investment in renewable energy infrastructure, energy storage technology, and grid resilience projects could fundamentally reduce petroleum dependence over 10-20 year periods.
Regional refining capacity development enables crude oil substitution while reducing transportation vulnerability. Asian economies have invested heavily in refining infrastructure to process alternative crude sources from Africa, North America, and South America.
Supply chain diversification imperatives extend beyond energy markets to encompass petrochemical feedstocks, fertiliser production, and manufacturing inputs. Companies pursuing geographic diversification strategies reduce exposure to single-point-of-failure supply routes.
How Would Central Banks Respond to Hormuz-Induced Inflation?
Energy-driven inflation presents central banks with complex policy trade-offs between price stability and economic growth objectives. Unlike demand-driven inflation, supply shock inflation often proves temporary, making aggressive monetary policy responses potentially counterproductive. Consequently, the evolving multipolar global economy adds additional complexity to coordinated monetary policy responses.
Monetary Policy Dilemmas During Energy Shocks
Stagflation risks emerge when energy price increases simultaneously drive inflation higher and economic growth lower. Central banks face difficult decisions between:
- Aggressive rate increases: Combat inflation but risk recession
- Accommodative policy: Support growth but allow inflation acceleration
- Targeted intervention: Address specific sectors while maintaining overall policy stance
Historical precedents suggest mixed monetary policy responses. During the 1970s oil crises, aggressive Federal Reserve rate increases successfully reduced inflation but triggered severe recessions. The 2008 energy price spike preceded the global financial crisis, complicating policy analysis.
Interest rate response patterns typically lag oil price movements by 6-12 weeks, as central banks assess whether price increases represent temporary supply disruptions or sustained inflationary pressures.
Fiscal Policy Interventions and Economic Support
Government intervention during strait of hormuz oil crisis scenarios typically focuses on:
Energy Subsidy Programmes:
- Direct consumer fuel subsidies to offset price increases
- Targeted support for transportation and logistics industries
- Temporary tax reductions on fuel and energy products
Strategic Reserve Releases:
- Coordinated petroleum reserve releases to moderate price spikes
- International cooperation through IEA mechanisms
- Commercial inventory release incentives
Economic Support Measures:
- Industry-specific assistance for energy-intensive sectors
- Trade policy adjustments to facilitate alternative supply sources
- Currency intervention to mitigate imported inflation effects
Financial Market Stability Measures
Central banks maintain extensive toolkits for managing financial market stress during energy crises:
Central Bank Crisis Management Tools:
| Tool Category | Specific Instruments | Timeline | Effectiveness |
|---|---|---|---|
| Liquidity Provision | Repo operations, discount window | 24-48 hours | High |
| Market Operations | Government bond purchases, FX intervention | 1-2 weeks | Moderate |
| International Coordination | Currency swaps, coordinated action | 2-4 weeks | High |
| Regulatory Relief | Capital requirement flexibility, stress test adjustments | 1-3 months | Moderate |
Cross-border swap arrangements enable central banks to provide foreign currency liquidity during dollar funding stress periods. These mechanisms proved essential during the 2008 financial crisis and remain available for energy-driven market disruptions.
The next major ASX story will hit our subscribers first
What Long-term Geopolitical Realignments Could Emerge?
Energy security doctrine evolution reflects lessons learned from strait of hormuz oil crisis scenarios and other supply disruption events. National energy independence strategies have gained political support across developed economies, driving investment in domestic production capabilities and alternative energy sources.
Energy Security Doctrine Evolution
Alliance structures around energy security have expanded beyond traditional military partnerships to encompass:
- Technology transfer agreements: Renewable energy development cooperation
- Infrastructure investment partnerships: Pipeline and LNG terminal development
- Emergency response coordination: Reserve sharing and crisis management protocols
- Intelligence sharing mechanisms: Threat assessment and early warning systems
The European Union's experience with Russian energy dependence during the Ukraine conflict exemplifies how energy security concerns drive policy realignment. EU initiatives to reduce natural gas imports by 67% within 12 months demonstrate the pace of possible structural adjustment.
Middle East Regional Power Dynamics
Gulf Cooperation Council unity faces tensions between energy export optimisation and security cooperation objectives. Saudi Arabia and UAE pipeline expansion projects reflect efforts to reduce Hormuz dependence while maintaining export volumes to traditional Asian markets.
Iran's regional influence depends heavily on its ability to credibly threaten Hormuz closure without triggering overwhelming military response. This balance requires sophisticated diplomatic and military calibration to maintain leverage without provoking escalation.
International diplomatic engagement patterns increasingly emphasise multilateral frameworks rather than bilateral relationships, reflecting the global nature of energy security challenges.
Global Energy Transition Acceleration
Crisis-driven renewable energy investment receives political and financial support that might otherwise require decades to develop. Government and private sector renewable energy commitments often accelerate during energy security crises as diversification imperatives override cost considerations.
Energy storage technology development benefits from crisis-driven funding and research priorities, potentially advancing deployment timelines by 5-10 years compared to baseline scenarios.
Grid resilience and diversification priorities focus on reducing dependence on imported fossil fuels while maintaining electrical system reliability. These investments create long-term structural changes in energy markets regardless of immediate crisis resolution.
Preparing for Energy Security Investment Opportunities
Portfolio diversification across energy scenarios requires understanding both immediate crisis beneficiaries and long-term structural winners. Energy sector investments provide direct exposure to price appreciation during supply disruptions, while alternative energy technologies benefit from accelerated adoption timelines.
Geopolitical risk assessment frameworks should incorporate multiple scenario analysis covering:
- Short-term disruption scenarios (1-6 months): Focus on energy stocks, shipping companies, and safe-haven assets
- Medium-term adaptation scenarios (6-24 months): Infrastructure development, alternative energy sources, and supply chain reconfiguration
- Long-term transformation scenarios (2-10 years): Renewable energy technology, energy storage systems, and grid modernisation
Energy transition positioning requires balancing traditional energy exposure with emerging technology investments. Companies successfully managing this transition demonstrate superior long-term growth potential while maintaining near-term dividend yields and cash flow generation.
Policy and preparedness recommendations emphasise international cooperation mechanisms and technology development priorities. National energy security planning benefits from lessons learned during previous crises while incorporating modern technological capabilities and geopolitical realities.
Investment Strategy Framework:
| Time Horizon | Primary Opportunities | Risk Considerations | Portfolio Allocation |
|---|---|---|---|
| 0-6 months | Energy stocks, shipping, precious metals | High volatility, timing risk | 15-25% |
| 6-24 months | Infrastructure, alternative routes | Regulatory changes, competition | 20-30% |
| 2-10 years | Renewable energy, storage technology | Technology risk, policy shifts | 25-40% |
Understanding strait of hormuz oil crisis scenarios provides essential context for energy security investment decisions. While specific timing remains unpredictable, structural vulnerabilities in global energy supply chains create ongoing opportunities for prepared investors across multiple market cycles and geopolitical environments.
Ready to capitalise on the next energy security opportunity?
Discovery Alert's proprietary Discovery IQ model delivers real-time notifications when significant ASX mineral discoveries are announced, empowering investors to identify actionable opportunities in energy-related commodities before broader markets react. Begin your 14-day free trial today to position yourself ahead of market-moving developments in the rapidly evolving energy security landscape.