
August 20, 2026
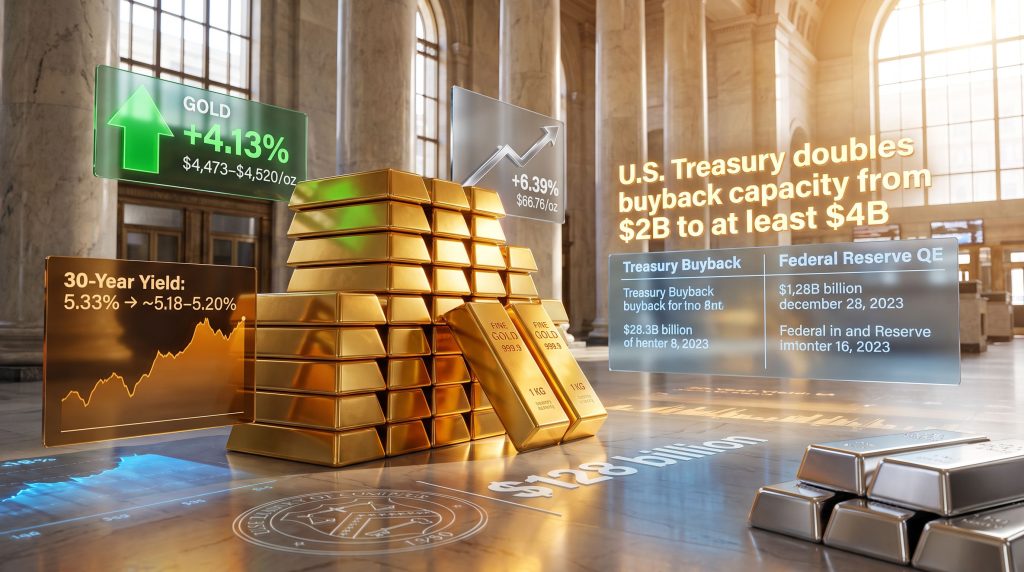
When Governments Become Buyers of Their Own Debt: What It Means for Gold
Sovereign debt markets operate on a foundational assumption: that private capital will willingly absorb new government bond issuance at prices determined by open market competition. For most of the post-2008 era, that assumption held reasonably well, even as deficit spending expanded dramatically. What happens when it breaks down? The answer, as August 2026 demonstrated, shows up first in gold prices, and only later in the headlines.
The Treasury buyback and gold prices relationship that crystallised this week is not a new mechanism. It is an old one reactivating under new fiscal conditions, and understanding it correctly separates investors who are responding to the actual signal from those chasing a narrative that is one step removed from reality.
When big ASX news breaks, our subscribers know first
The Anatomy of a Buyers' Strike in Long-Duration Treasuries
The sequence of events that preceded the August 2026 Treasury intervention had been building for nearly two months. Beginning in late June, bond market participants began systematically withdrawing from long-dated U.S. government debt auctions. The term used across fixed income desks to describe this pattern was a buyers' strike, a condition in which institutional investors decline to absorb available supply unless yields move substantially higher to compensate for perceived risk.
By August 19, 2026, the consequences of that sustained reluctance had become impossible to ignore. The 30-year Treasury yield reached 5.33%, a level not seen since June 2007, representing a peak not touched in nearly two decades. A concurrent $16 billion 20-year bond auction attracted unusually weak demand from private sector participants, falling well short of the bid coverage levels that would indicate healthy market function.
What makes this moment analytically significant is not just the yield level itself, but what that yield communicates. Unlike prior episodes of yield elevation driven by inflation expectations, market coverage of the period noted that inflation expectations remained largely stable. The rise in long-end yields was instead attributable to an expanding term premium, the additional compensation investors demand for the risk of holding long-duration government obligations when fiscal trajectories appear uncertain. Furthermore, the gold and bonds dynamics at play here reflect a broader pattern: gold, as a stateless, zero-liability asset, has historically absorbed capital when that premium begins to rise in ways that monetary models cannot fully account for.
How the Treasury Responded: Doubling Down on Buybacks
The U.S. Treasury Department's reaction to the failed auction was swift and structurally significant. Rather than waiting for the next scheduled quarterly review, officials announced an expansion of the existing buyback programme just two weeks after the regular issuance calendar had already been published. The out-of-cycle timing was itself a signal: this was a reactive intervention, not a planned adjustment.
The key parameters of the expanded programme:
- Previous per-operation buyback capacity: $2 billion
- New minimum per-operation capacity: $4 billion (at least a 100% increase)
- Securities covered: 10-to-20-year and 20-to-30-year Treasury obligations
- Programme commencement: September 9, 2026
- Programme review date: November 4, 2026
- Estimated annualised repurchase pace: approximately $128 billion
- Share of projected issuance in targeted maturities: approximately 30%
John Briggs, Head of U.S. Interest Rate Strategy at Natixis, characterised the intervention in terms that cut through the technical language: Treasury officials were simply not comfortable with where market conditions had moved, and acted accordingly. The practical interpretation is that at a single auction, private buyers collectively refused to accept prevailing prices, and the issuer of that debt stepped in to fill the gap through its own repurchase mechanism. You can review official buyback announcements directly from the U.S. Treasury to track programme parameters as they evolve.
Treasury Buybacks vs. Federal Reserve QE: Why the Distinction Matters
A persistent source of confusion in financial media coverage of this event was the conflation of Treasury buybacks with Federal Reserve quantitative easing. These are fundamentally different operations:
| Feature | Treasury Buyback | Federal Reserve QE |
|---|---|---|
| Executing Institution | U.S. Treasury Department | Federal Reserve |
| Funding Source | New short-term bill issuance | New bank reserve creation |
| Primary Goal | Debt maturity management | Monetary policy transmission |
| Balance Sheet Impact | Maturity shift within debt structure | Expands Fed's balance sheet |
| Policy Classification | Fiscal policy tool | Monetary policy tool |
| Gold Market Signal | Fiscal stress and demand failure | Monetary debasement signal |
The Treasury's buyback programme funds repurchases through shorter-term bill issuance rather than through money creation. This means it does not expand the overall money supply in the way Fed asset purchases do. What it does accomplish is a maturity transformation: long-duration supply is reduced, short-duration obligations expand, and the net effect compresses long-end yields without the Fed changing a single policy setting.
For gold investors, this distinction carries an important implication. The August 2026 catalyst was not a Fed pivot. It was fiscal debt management responding to the market's verdict on long-duration sovereign credit. Indeed, understanding gold in the monetary system more broadly helps clarify why these structural pressures translate so directly into precious metals demand.
The Yield Compression and Its Immediate Transmission to Precious Metals
Markets responded to the Treasury announcement with measurable immediacy across multiple maturities:
| Treasury Maturity | Pre-Announcement Yield | Post-Announcement Yield | Change |
|---|---|---|---|
| 30-year bond | ~5.33% (intraday high) | ~5.18-5.20% | -13 to -15 bps |
| 10-year note | ~4.68-4.70% | ~4.63-4.65% | -5 to -6 bps |
| 10-year real yield (TIPS) | ~2.44% | Marginally lower | Remained positive |
The compression was heaviest precisely where the buybacks were targeted, confirming a clean transmission between fiscal intervention and yield outcomes. Gold and silver responded with moves that exceeded what the standard opportunity-cost framework would predict:
| Asset | Single-Day Move | Price Level (August 20, 2026) |
|---|---|---|
| Gold | +4.1% to +4.13% | ~$4,473-$4,520/oz |
| Silver | +6.39% | ~$66.76/oz |
The scale of the rally is analytically important for a specific reason. Ten-year real yields, derived from Treasury Inflation-Protected Securities data, remained at approximately 2.44% on the day of the rally. Historically, positive real yields represent a direct headwind for gold because investors can earn a real return from inflation-protected government bonds without bearing gold's opportunity cost. The fact that gold surged sharply against that backdrop signals that market participants were pricing in something that the real yield framework does not capture on its own. As reported by the AFR, gold bulls were broadly vindicated as prices roared back above $4,500.
When gold rallies hard against a backdrop of still-positive real yields, it typically indicates that the market is assigning growing probability to fiscal deterioration scenarios that conventional monetary models do not price in advance. The August 2026 episode fits that pattern precisely.
What the Gold Market Was Actually Pricing
Three reinforcing forces amplified the standard yield-to-gold transmission during this episode, each deserving separate consideration:
1. The Debasement Premium
When a sovereign government repurchases its own debt because private buyers declined to participate at a single auction, the act itself communicates a level of fiscal stress that goes beyond what any individual yield number conveys. Gold markets have historically treated this pattern as a leading indicator of structural sovereign credit concerns, often before those concerns appear in official credit ratings or formal policy statements.
2. Dollar Softening as a Secondary Channel
Lower long-end yields contributed to U.S. dollar weakness during the period. Since gold is priced in dollars on global markets, dollar depreciation provides a secondary price tailwind that is arithmetically independent of the opportunity cost mechanism. Both forces operated simultaneously in August 2026. The gold-bond market relationship is consequently central to understanding how these dual channels reinforce one another.
3. The Policy Incoherence Premium
Perhaps the least widely discussed amplifier was the simultaneous release of Federal Reserve meeting minutes that revealed an unusually fractured policy committee. The Fed's July 28-29, 2026 meeting produced a 9-3 vote to hold rates steady at 3.50-3.75%, with three regional Federal Reserve bank presidents dissenting in favour of a 25 basis point rate increase: Beth Hammack of the Cleveland Fed, Neel Kashkari of the Minneapolis Fed, and Lorie Logan of the Dallas Fed. According to market coverage of the minutes release, this was the most divided FOMC vote recorded since 2016.
The juxtaposition of a proactive Treasury easing long-end financial conditions while three Fed officials actively pushed for tighter monetary settings creates a structurally ambiguous environment. Historically, gold performs well in precisely this kind of incoherent policy setting, because the hedging function of the metal scales with uncertainty about the direction of policy rather than with any single policy outcome.
Is This a Structural Shift or a Temporary Catalyst?
Distinguishing between a short-term technical catalyst and a genuine structural regime shift is the central question for precious metals positioning through the remainder of 2026. Several indicators suggest this episode carries structural rather than merely tactical significance:
- The intervention occurred outside the regular quarterly issuance schedule, confirming a reactive rather than planned response to deteriorating conditions
- The 30-year yield at 5.33% represented a 19-year high, not a transient intraday spike but a sustained level reflecting accumulated private sector reluctance
- At an estimated $128 billion annualised pace, the buyback programme would absorb approximately 30% of projected issuance in the targeted maturities, meaning the government is effectively backstopping nearly a third of its own long-duration debt market
- The buyers' strike had been developing since late June, indicating months of sustained private sector reluctance rather than an isolated event
Each of these factors points toward a condition where the standard model of Treasury market function — deep private sector demand absorbing supply at competitively determined yields — is no longer operating without fiscal intervention. That represents a qualitatively different market structure than existed in prior cycles.
The next major ASX story will hit our subscribers first
Key Watchpoints Through Q4 2026
The programme's November 4 review date creates a concrete analytical calendar for gold investors. The following signal hierarchy provides a framework for interpreting incoming data:
| Signal | Bullish for Gold | Bearish for Gold |
|---|---|---|
| Treasury auction bid coverage | Continued weakness or outright failures | Recovery in participation rates |
| 30-year yield trajectory | Sustained below 5.20% | Resumption above 5.30% |
| 10-year real yield | Declining toward 2.00% | Rising above 2.60% |
| FOMC decisions | Hold or pivot toward cuts | Additional hikes materialise |
| U.S. dollar index | Continued softening | Meaningful strengthening |
| Buyback programme status | Extended or expanded post-November | Terminated without demand recovery |
The critical variable through the programme period is whether private sector demand for long-duration Treasuries recovers organically. If subsequent 20-year and 30-year auctions return to healthy bid-to-cover ratios and primary dealer takedown percentages normalise, the Treasury's intervention will have achieved its stated liquidity management purpose. If demand remains weak, the November reassessment becomes a binary event: extend and expand (likely supportive for gold) or allow yields to resume their upward trajectory.
A Broader Lesson About Gold's Price Signal Function
The August 2026 episode offers a useful corrective to a common oversimplification in precious metals analysis. Gold price movements are frequently attributed in financial media to ETF inflows, central banks influencing gold demand, or geopolitical risk premiums. These forces are real and measurable, but they are often downstream of a more fundamental driver: the changing perceived quality of sovereign obligations that gold implicitly competes with as a store of value.
When a government that issues the world's primary reserve currency finds itself acting as buyer of last resort for its own long-duration debt, the signal embedded in that action reaches gold markets before it reaches most other analytical frameworks. The Treasury buyback and gold prices dynamic of August 2026 illustrated this clearly, with the rally occurring against positive real yields and amid genuine monetary policy disagreement within the Federal Reserve.
However, it is worth noting that gold safe-haven demand does not operate in isolation. It is amplified considerably when fiscal credibility is visibly under pressure, as was the case throughout this episode. For long-duration holders of physical gold and silver, the structural case rests not on any single yield level or policy announcement, but on the cumulative trajectory of fiscal conditions that make episodic interventions like this one increasingly necessary over time. The Treasury buyback and gold prices connection, consequently, is likely to remain a key analytical lens well into 2027 and beyond.
This article is for informational purposes only and does not constitute investment advice. Precious metals investments involve risk, including the potential loss of principal. Past price performance is not indicative of future results. Readers should consult a qualified financial adviser before making any investment decisions.
Want to Know When the Next Major Mineral Discovery Hits the ASX?
Discovery Alert's proprietary Discovery IQ model scans ASX announcements in real time, instantly identifying high-potential opportunities across more than 30 commodities — so subscribers can act before the broader market responds. Explore historic discoveries and their extraordinary returns, then begin a 14-day free trial to secure a genuine market-leading edge.