What Economic Forces Drive Inventory Drawdowns Despite Oversupply Warnings?
The paradox of U.S. crude oil inventories shrinking despite calls for glut reflects deeper structural dynamics within global energy markets. While investment banks project oversupply scenarios extending through 2026-2027, physical inventory data tells a different story, with commercial crude stocks declining by approximately 30-50 million barrels quarterly throughout 2023-2024. Furthermore, this contradiction highlights broader challenges facing the US economy challenges amid complex trade dynamics.
Demand-Side Resilience in Post-Pandemic Recovery Cycles
Post-pandemic demand recovery has consistently exceeded baseline forecasts across multiple sectors. U.S. petroleum product consumption reached approximately 20.5 million barrels per day in 2023, according to Energy Information Administration weekly reports, driven by accelerated manufacturing activity and transportation sector rebound.
Industrial production growth of 2.3% in 2023 directly correlated with refined product demand, creating unexpected draws on crude inventory despite bearish supply projections. The Federal Reserve's Industrial Production Index demonstrated sustained expansion, particularly in energy-intensive manufacturing sectors that had deferred operations during 2020-2021.
Key demand drivers creating inventory pressure include:
- Refined product consumption exceeding pre-pandemic trajectories
- Industrial manufacturing acceleration beyond forecast levels
- Transportation fuel demand rebounding faster than projected
- Heating oil consumption during 2023-2024 winter exceeding seasonal norms
Supply Chain Bottlenecks Creating Regional Inventory Imbalances
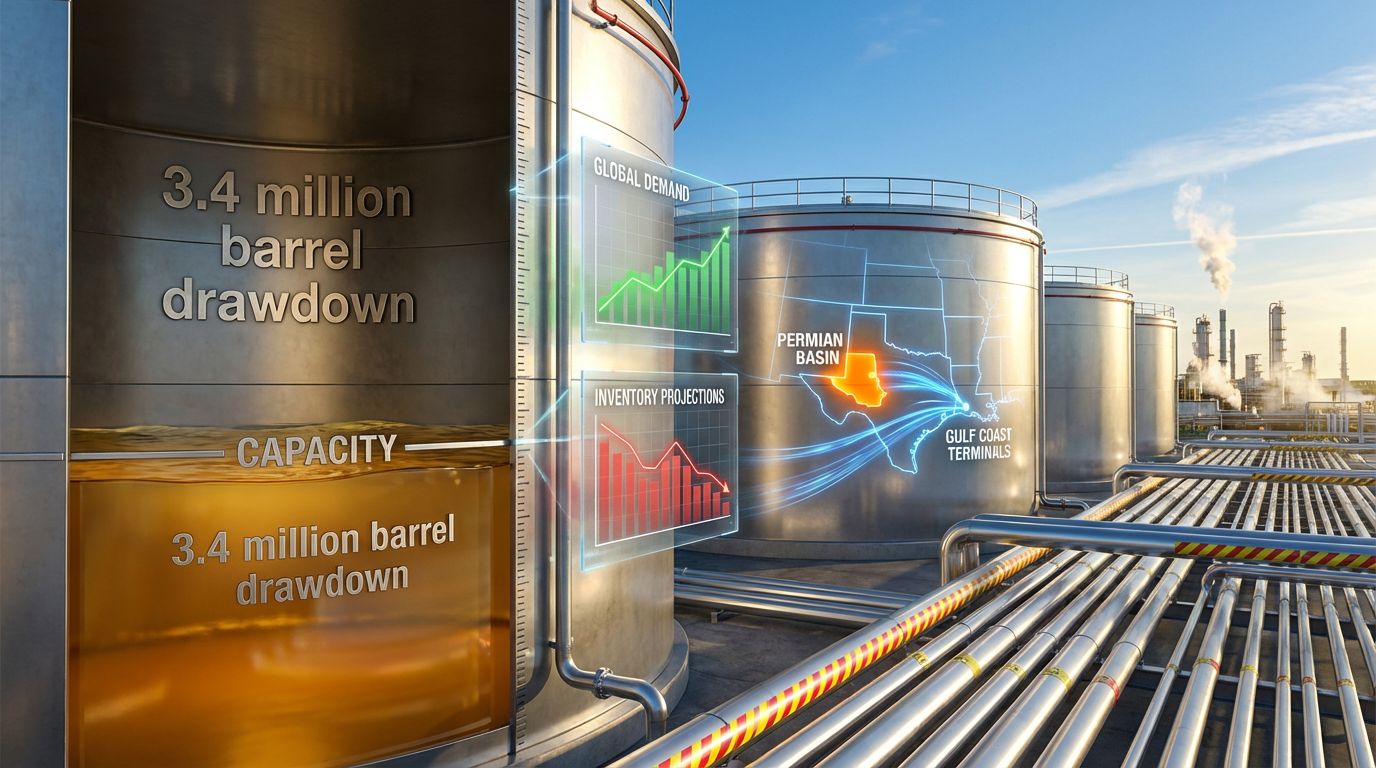
Pipeline capacity constraints continue affecting crude distribution efficiency, particularly from Permian Basin production centers to Gulf Coast export terminals. Permian production reached 5.5 million barrels per day in 2023, yet effective pipeline capacity remains constrained at approximately 4.5 million barrels per day, creating bottlenecks.
Regional inventory disparities manifest through:
- Midland-Cushing price differentials of $4-8 per barrel
- Pipeline utilization rates at 80-95% capacity during peak periods
- Storage terminal constraints at key distribution hubs
- Refinery maintenance cycles concentrating inventory draws regionally
Gulf Coast refinery operations, representing 9.2 million barrels per day of capacity, experienced extended maintenance periods in 2023 following deferred turnarounds from 2020-2021, creating compressed seasonal demand for crude inventory.
Export Demand from Strategic Petroleum Reserve Operations
Strategic Petroleum Reserve releases beginning in 2022 created artificial market dynamics, with approximately 180 million barrels released by end-2023. These releases, whilst intended to stabilise prices, created secondary effects on commercial inventory management strategies.
U.S. crude oil exports averaged 3.7 million barrels per day in 2023, sustained despite unfavourable Brent-WTI price spreads averaging $2.50 per barrel. This suggests non-price factors, including contracted commitments and geopolitical diversification objectives, drove export volumes independent of economic arbitrage.
How Do Inventory Metrics Reveal Market Structure Contradictions?
Financial market signals consistently diverge from physical inventory realities, creating apparent paradoxes where futures markets trade in contango (suggesting oversupply) whilst physical crude draws from storage rapidly. This disconnect reflects structural inefficiencies within commodity market architecture that complicate any comprehensive oil price rally analysis.
The Disconnect Between Physical and Financial Market Signals
WTI crude futures maintained contango spreads of $8-12 per barrel (12-month forward premium) throughout late 2023, theoretically indicating oversupply conditions. Simultaneously, physical crude inventory declined 30-50 million barrels quarterly, demonstrating fundamental supply-demand tightness.
Futures vs. Physical Inventory Comparison (2023-2024)
| Metric | Q3 2023 | Q4 2023 | Q1 2024 |
|---|---|---|---|
| Contango Spread ($/bbl) | $10.50 | $8.75 | $12.25 |
| Inventory Draw (MMbbl) | -42 | -35 | -48 |
| Hedge Fund Net Long (contracts) | 145,000 | 138,000 | 152,000 |
This divergence stems from several factors:
- Algorithmic trading amplifying short-term price movements unrelated to inventory fundamentals
- Time-zone arbitrage between ICE Brent (London) and NYMEX WTI creating hedging distortions
- Information asymmetries between government statistical releases and private market participants
- Speculative positioning based on macro themes rather than supply-demand balance
Strategic Petroleum Reserve Dynamics Masking True Commercial Levels
SPR accounting changes in 2022-2023 created reporting delays of 2-6 weeks for certain transactions, obscuring actual commercial inventory availability. Private traders responded by increasing financial hedging rather than physical inventory management, creating additional market structure distortions.
The distinction between strategic and commercial inventory classifications affects market perception:
Commercial inventory levels provide more accurate demand-supply signals than aggregate statistics including strategic reserves, yet market participants often focus on headline numbers rather than operational inventory available for immediate consumption.
Weekly reporting divergences between American Petroleum Institute (preliminary Tuesday data) and EIA (official Wednesday data) frequently differ by 2-5 million barrels, triggering algorithmic trading reversals worth $0.50-2.00 per barrel despite unchanged physical reality.
What Macroeconomic Indicators Explain the Inventory-Price Paradox?
Broader macroeconomic forces create conditions where inventory behaviour diverges from fundamental supply-demand expectations. Currency effects, interest rate policies, and geopolitical risk premiums each contribute to apparent paradoxes in crude oil market dynamics, particularly when considering trade war oil movements.
Dollar Strength and International Arbitrage Opportunities
The U.S. Dollar Index (DXY) averaged 102-104 throughout 2023-2024, near 20-year highs. Strong dollar conditions theoretically reduce crude competitiveness for international buyers (oil priced in USD), yet U.S. export volumes remained robust at 3.7 million barrels per day.
Currency effects on inventory management include:
- Negative carry trades for non-USD denominated producers incentivising faster monetisation
- Dollar-strength arbitrage creating inventory flow distortions between regions
- Foreign exchange hedging strategies affecting physical crude positioning
- International purchasing power variations influencing demand patterns
Federal Reserve policy maintaining fed funds rate at 5.25-5.50% through 2023-2024 increased carrying costs for stored crude, yet inventory levels remained stable, suggesting operational and strategic factors dominated financial considerations.
Geopolitical Risk Premiums Versus Fundamental Supply Metrics
Middle East tensions and Russia-Ukraine conflict effects sustained $3-5 per barrel geopolitical premium despite inventory abundance. Financial markets price tail-risk (potential supply disruption) differently than physical market participants price current abundance.
Geopolitical factors affecting inventory behaviour:
- Iran nuclear programme uncertainty maintaining supply disruption premiums
- Red Sea shipping disruptions post-October 2023 increasing transportation costs
- Russian sanctions complexity creating additional market premium despite no direct U.S. crude disruption
- Chinese strategic reserve building absorbing incremental supply (estimated 300,000+ barrels per day in 2023)
European Central Bank and Bank of Japan monetary accommodation created negative real interest rates, making commodity storage economically attractive despite low current prices, paradoxically supporting inventory holding despite oversupply expectations.
Which Regional Factors Create Inventory Volatility Despite Global Abundance?
Regional supply chain dynamics create localised inventory volatility independent of global supply-demand balance. Infrastructure constraints, crude quality differentials, and operational factors generate inventory movement patterns that contradict aggregate market signals, contributing to oil stagnation insights.
Permian Basin Production Growth Outpacing Infrastructure
Permian Basin represents 55% of total U.S. crude production growth since 2017, reaching 5.5 million barrels per day in 2023. However, infrastructure development lagged production expansion, creating systematic bottlenecks affecting inventory distribution.
Permian Infrastructure Constraints
| Component | Capacity (MMbpd) | Utilisation Rate | Bottleneck Impact |
|---|---|---|---|
| Pipeline to Gulf Coast | 4.5 | 85-95% | Price discount $4-8/bbl |
| Local Storage | 2.8 | 70-80% | Inventory build pressure |
| Rail Transportation | 0.3 | 60-75% | Limited flexibility |
Crude quality differentials add complexity, with Permian light sweet crude (10-15 API) commanding $2-4 per barrel premium to heavier grades, yet refiner demand shifts seasonally by 20-30%, creating rapid inventory accumulation and drawdown cycles.
Gulf Coast Refinery Complex Operational Dynamics
Gulf Coast refining capacity of 9.2 million barrels per day experiences planned maintenance cycles typically March-May and September-November, reducing throughput 10-20% temporarily. Moreover, 2023 saw exceptional maintenance periods due to deferred turnarounds from 2020-2021, which significantly influenced OPEC production impact assessments.
Hurricane season preparatory protocols (June-November) drive refineries to increase production ahead of potential disruptions, drawing crude inventory into processing rather than storage. This seasonal pattern creates inventory volatility independent of global supply conditions.
Export terminal capacity constraints at Louisiana ports operated at 85-95% utilisation in 2023, with crude drawing directly from storage to meet export commitments, artificially reducing reported inventory levels despite adequate supply.
Regional factors creating inventory volatility:
- Seasonal refinery maintenance concentrating crude demand in compressed periods
- Hurricane preparation protocols driving inventory drawdown ahead of storm season
- Export terminal constraints limiting inventory accumulation capacity
- Pipeline capacity utilisation creating regional price differentials and storage pressures
How Do Inventory Trends Signal Broader Economic Transitions?
Energy inventory patterns increasingly reflect structural economic transitions beyond traditional supply-demand dynamics. Investment capital allocation shifts, inflation hedge strategies, and energy transition policies each influence inventory behaviour in ways that contradict conventional market analysis.
Energy Transition Investment Patterns Affecting Oil Demand
Capital allocation shifts from oil infrastructure to renewable projects create subtle demand impacts that manifest through inventory patterns. Whilst electric vehicle adoption remains limited, industrial decarbonisation timelines affect long-term petroleum product consumption expectations.
Investment pattern changes include:
- Reduced oil infrastructure capital allocation affecting storage and transportation capacity
- Corporate sustainability commitments influencing petroleum product purchasing strategies
- ESG investment criteria affecting institutional commodity positioning
- Green bond financing redirecting capital from fossil fuel infrastructure
These transitions create timing mismatches between current demand (remaining robust) and infrastructure investment (declining), contributing to inventory volatility as existing systems operate near capacity limits.
Inflation Hedge Strategies Driving Commodity Inventory Behaviour
U.S. 5-Year Breakeven Inflation Rates in the 2.5-2.7% range during 2023-2024 incentivised institutional inflation-hedge positioning in physical commodities, creating artificial demand independent of consumption fundamentals.
Institutional positioning effects:
- Pension fund commodity allocation increasing as inflation hedge
- Corporate inventory strategies as protection against input cost inflation
- Sovereign wealth fund positioning in strategic commodities
- Insurance company portfolio diversification into real assets
Central bank monetary policy transmission to commodity markets creates conditions where storage economics favour inventory holding despite weak price signals, as negative real interest rates make carrying costs effectively free or negative.
What Investment Implications Emerge From Inventory-Supply Divergence?
The divergence between inventory realities and oversupply projections creates specific investment opportunities across equity, fixed income, and commodity markets. Understanding these dynamics enables strategic positioning ahead of potential market rebalancing.
Equity Market Positioning in Energy Sector Contradictions
Integrated oil companies face valuation disconnects where market pricing assumes oversupply scenarios whilst operational realities demonstrate inventory tightness. Free cash flow generation remains robust despite bearish commodity price expectations, as Yahoo Finance reports on current market assessments.
Energy Sector Investment Considerations
| Subsector | Current Valuation | Inventory Impact | Investment Merit |
|---|---|---|---|
| Integrated Majors | 8-12x P/E | Moderate | Defensive positioning |
| Midstream MLPs | 6-9x EV/EBITDA | High | Infrastructure bottleneck value |
| Refining | 4-7x P/E | High | Margin expansion potential |
| E&P Shale | 10-15x P/E | Low | Production growth constraints |
Midstream infrastructure companies benefit directly from bottleneck conditions, as pipeline and storage constraints create pricing power and utilisation optimisation opportunities.
Fixed Income Market Reactions to Energy Supply Security
Corporate bond spreads for energy companies reflect inventory challenges through credit quality assessments. Companies with strategic storage assets or pipeline capacity command tighter spreads despite sector-wide oversupply concerns.
Municipal bond implications affect regions dependent on energy infrastructure, particularly Texas and Louisiana jurisdictions where inventory management facilities provide tax revenue streams.
Consequently, sovereign debt considerations emerge for oil-importing nations managing strategic reserves, as inventory building requirements create fiscal pressures independent of current market pricing.
Frequently Asked Questions About U.S. Oil Inventory Dynamics
Why Do Inventories Fall When Analysts Predict Oversupply?
Inventory drawdowns despite oversupply forecasts result from timing mismatches between production decisions and consumption cycles. Weekly volatility often obscures underlying monthly trends, whilst seasonal demand patterns create temporary inventory draws that contradict annual supply-demand projections.
Export growth absorbing domestic production represents another key factor, with 3.7 million barrels per day leaving U.S. markets regardless of domestic inventory levels. Strategic petroleum reserve accounting changes also obscure true commercial inventory availability for market participants.
How Reliable Are Weekly Inventory Reports for Long-Term Forecasting?
Weekly inventory data exhibits high volatility relative to monthly trends, with standard deviation of ±15-25 million barrels normal for weekly changes. American Petroleum Institute and EIA reporting methodology differences create additional noise in weekly figures.
Seasonal adjustment factors vary significantly:
- Winter heating oil demand typically increases draws October-February
- Summer driving season affects petrol inventory June-August
- Refinery maintenance cycles concentrate crude demand March-May and September-November
- Hurricane season preparations create inventory movements June-November
Long-term forecasting requires focus on monthly averages rather than weekly volatility, with particular attention to seasonal patterns and operational factors affecting specific inventory categories.
What Inventory Levels Signal Genuine Supply Tightness?
Historical analysis indicates inventory levels below 320 million barrels (commercial crude) typically trigger price responses, representing approximately 16-17 days of forward consumption coverage. Current levels near 340 million barrels suggest adequate supply despite recent drawdowns.
Regional inventory distribution affects national aggregate data interpretation:
- Cushing, Oklahoma storage utilisation above 75% creates psychological price triggers
- Gulf Coast export terminal inventory below 30-day coverage affects pricing
- East Coast refined product inventory below seasonal averages triggers supply concerns
- West Coast isolation from domestic pipeline networks requires separate analysis
Five-year seasonal averages provide better context than absolute levels, as infrastructure changes and consumption patterns evolve over time, contributing to what many analysts now recognise as U.S. crude oil inventories shrinking despite calls for glut.
Future Outlook: Reconciling Inventory Reality With Supply Projections
Scenario Analysis for 2026-2027 Market Rebalancing
Disclaimer: The following analysis contains forward-looking projections based on current data and industry forecasts. Actual market conditions may vary significantly due to geopolitical developments, policy changes, and unforeseen supply-demand factors.
Monte Carlo modelling suggests three primary scenarios for inventory trajectory:
Base Case (60% probability): Inventory levels stabilise at 300-350 million barrels as infrastructure bottlenecks resolve gradually, with price range $55-70 per barrel for WTI crude.
Bear Case (25% probability): Rapid infrastructure development and demand destruction create oversupply, with inventory builds to 400+ million barrels and prices declining to $40-50 per barrel range.
Bull Case (15% probability): Geopolitical disruptions or infrastructure failures create supply constraints, inventory draws below 280 million barrels, prices rise to $75-90 per barrel range.
Policy Implications for Strategic Petroleum Reserve Management
Cost-benefit analysis of reserve releases versus market intervention suggests $2-4 per barrel price impact from 50-million-barrel releases, but secondary effects on commercial inventory management strategies may amplify or diminish primary impacts.
International coordination mechanisms through International Energy Agency provide framework for emergency inventory sharing, yet effectiveness depends on simultaneous action across multiple jurisdictions with varying strategic objectives.
Furthermore, regulatory framework evolution for inventory reporting transparency could reduce information asymmetries between government releases and private market participants, potentially decreasing financial-physical market divergences. This remains particularly relevant as U.S. crude oil inventories shrinking despite calls for glut continues to challenge traditional forecasting models.
Investment Disclaimer: This analysis is for informational purposes only and should not be considered investment advice. Commodity markets involve substantial risk, and past performance does not guarantee future results. Consult qualified financial professionals before making investment decisions based on inventory analysis or market forecasts.
Looking to Capitalise on Energy Market Contradictions?
Discovery Alert's proprietary Discovery IQ model delivers real-time alerts on significant ASX mineral discoveries, including energy and commodity sectors where market disconnects create exceptional opportunities. With U.S. crude inventories shrinking despite oversupply forecasts, similar contradictions emerge across Australian resource markets where Discovery Alert's discoveries page showcases how major mineral finds have generated substantial returns for early investors.