July 18, 2026
The Geography of Oil Risk: Why One Narrow Waterway Holds the Global Economy Hostage
Every barrel of crude oil that leaves the Persian Gulf carries with it an invisible geopolitical tax. That tax is the Strait of Hormuz — a waterway barely 33 kilometres wide at its narrowest navigable point, yet responsible for transiting roughly 20% of all globally traded crude oil. When military exchanges erupt between the United States and Iran in and around this corridor, US and Iran Strait of Hormuz oil prices shift across the entire architecture of global energy pricing. Understanding how and why those shifts occur — and how investors can position themselves rationally rather than reactively — requires moving beyond headlines and into the structural mechanics of oil market risk.
The 2026 US-Iran conflict over the Strait of Hormuz, culminating in a ceasefire memorandum of understanding, produced one of the most instructive geopolitical commodity market cycles in recent memory. What it revealed about market psychology, energy supply chains, and the limits of diplomatic agreements deserves careful analysis.
When big ASX news breaks, our subscribers know first
Why the Strait of Hormuz Is the Single Most Consequential Chokepoint in Global Energy
The Strait of Hormuz connects the Persian Gulf's five major oil-producing nations — Saudi Arabia, Iraq, Kuwait, the UAE, and Iran itself — to the broader global market. Approximately 17 to 21 million barrels of crude oil and petroleum products transit this corridor every single day. No alternative pipeline infrastructure exists at a scale capable of compensating for a full or sustained closure.
The East-West Pipeline across Saudi Arabia, for instance, can carry roughly 5 million barrels per day at maximum capacity — meaningful, but woefully insufficient to offset even a partial Hormuz disruption. The UAE's Habshan-Fujairah pipeline offers another partial bypass route, but combined alternatives still leave the majority of Persian Gulf export capacity dependent on the Strait.
This geographic irreplaceability is what gives the Hormuz corridor its extraordinary strategic leverage. Furthermore, it is precisely what makes the broader oil market volatility generated by US-Iran tensions so consequential for anyone exposed to energy markets, inflation dynamics, or interest rate trajectories.
A Historical Lens: How Previous Hormuz Crises Have Repriced Oil
History shows that Hormuz-related escalations have produced wildly varying oil price responses depending on whether supply was actually disrupted versus merely threatened. The table below maps key historical episodes against crude price movements:
| Event | Year | Brent Price Before | Peak Brent Price | % Spike |
|---|---|---|---|---|
| Iran-Iraq Tanker War | 1984-1988 | ~$28/bbl | ~$35/bbl | ~25% |
| Gulf War I | 1990-1991 | ~$18/bbl | ~$40/bbl | ~122% |
| 2019 Tanker Attacks | 2019 | ~$60/bbl | ~$65/bbl | ~8% |
| 2026 US-Iran Conflict | 2026 | ~$65-$75/bbl | ~$120/bbl | ~60-85% |
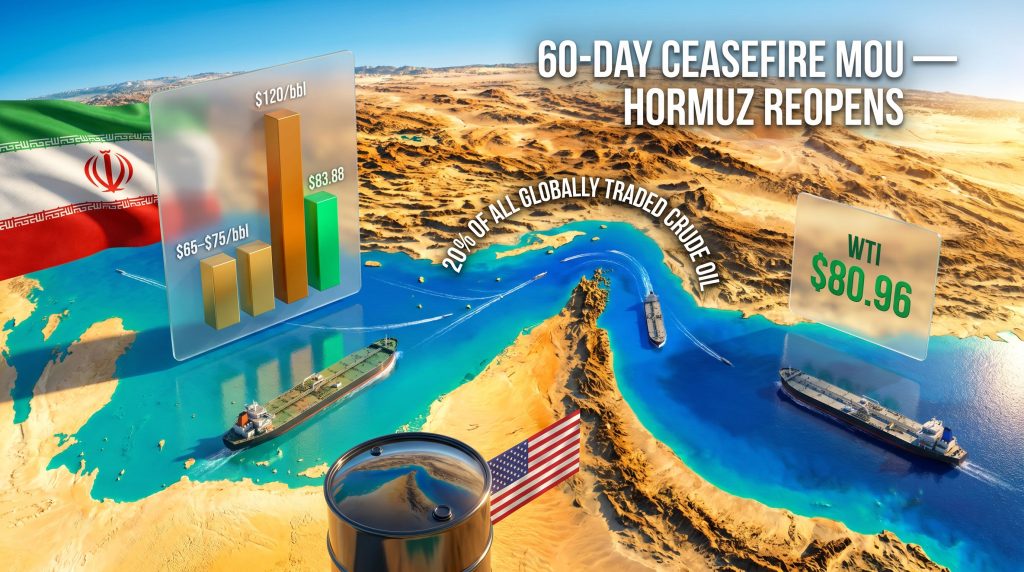
The 2026 conflict stands out not just for the magnitude of the peak price spike, but for what happened afterward. Brent crude reached approximately $120 per barrel at its wartime high in late April before retreating sharply as ceasefire signals emerged, ultimately landing near $83.88 per barrel following the formal agreement announcement — a fall of approximately 3.95% in a single trading session.
Key Insight: The speed of both the ascent and the descent in 2026 crude pricing reflects a structurally important shift in how commodity markets process geopolitical risk: institutional capital now repositions ahead of formal diplomatic resolution rather than waiting for confirmed outcomes.
The Full Arc of the 2026 US-Iran Hormuz Conflict
Phase 1 — Escalation, Closure, and the $120 Barrel
The conflict's escalation arc was neither sudden nor surprising in retrospect. A sequence of military exchanges culminated in Iranian forces effectively closing the Strait to commercial traffic, representing one of the longest sustained maritime disruptions to global oil transit in modern history at over 100 days.
US naval forces responded by imposing a blockade on maritime traffic entering and exiting Iranian ports and coastal zones. The combination of the Strait's closure and the naval blockade created a genuine supply shock — precisely the kind of physical disruption that sends crude prices into sustained upward movement rather than the temporary spikes associated with threat-based escalations.
Brent crude's climb from a pre-conflict range of $65-$75 per barrel to approximately $120 per barrel by late April represented the largest sustained wartime oil price rally in more than three decades. For context, even the Gulf War of 1990-1991, which disrupted Iraqi and Kuwaiti supply simultaneously, produced a peak price of around $40 per barrel — less than one-third of the 2026 wartime high.
Phase 2 — The Ceasefire MOU and Its Key Terms
A 60-day ceasefire framework was eventually announced, structured around a Memorandum of Understanding containing the following core provisions:
| Deal Component | Detail | Market Implication |
|---|---|---|
| Ceasefire Duration | 60 days | Short-term supply certainty only |
| Iranian Sanctions | Suspended during ceasefire window | Iranian crude re-enters global market |
| Frozen Funds Released | Approximately $24 billion | Fiscal relief for Iranian government |
| Nuclear Commitment | Iran affirms no weapons development | Reduces long-term geopolitical risk premium |
| Strait Reopening | Full commercial reopening within ~2 days | Immediate shipping relief signalled |
| Naval Blockade | US forces withdrew from Hormuz | Commercial tanker traffic technically resumes |
The White House publicly rejected reports that Iran and Oman would assume joint management authority over Strait traffic, labelling such claims inaccurate. However, regional energy analysts broadly assess that Iran retains effective deterrence capability over Hormuz regardless of what any formal agreement stipulates — a perception gap between Washington's stated position and strategic reality on the ground that markets have not fully resolved.
Phase 3 — Market Repricing After the Deal
Following the ceasefire announcement, WTI crude declined 4.62% to $80.96 per barrel in parallel with Brent's move to $83.88. European natural gas prices fell approximately 5% concurrently. US retail gasoline prices retreated approximately $0.65 per gallon from their conflict-period peak, pushing the national average back below the psychologically significant $4.00 per gallon threshold.
CENTCOM publicly confirmed the withdrawal of the US naval blockade from Iranian ports, providing the operational confirmation that markets required to validate the diplomatic announcements.
The Price Paradox: Why Oil Fell Before the Deal Was Signed
One of the most analytically instructive aspects of the 2026 Hormuz conflict was the behaviour of crude prices during active military exchanges. Rather than sustaining elevated levels, Brent had already retreated to approximately $74 per barrel — near its pre-conflict baseline of roughly $71 — well before the formal ceasefire announcement.
This apparent paradox reflects a structural shift in how sophisticated commodity traders price geopolitical risk. Citigroup analysts noted that oil markets were finding more stable footing as scenarios involving severe supply disruption were progressively discounted amid diplomatic signals, suggesting that institutional capital had already repositioned before the formal MOU was signed.
Several dynamics contributed to this pre-deal pricing:
- Escalation fatigue: Each successive military exchange during the extended conflict produced diminishing price reactions, as traders incrementally raised their confidence that disruptions would remain temporary
- Futures market positioning: Professional commodity traders use options and futures to position for resolution scenarios; this creates selling pressure on crude futures as diplomatic probability rises
- Shipping data signals: Early indicators of tanker traffic resumption — including at least one LNG carrier observed testing the Strait shortly after ceasefire signals emerged — provided real-world evidence of normalisation
- Historical pattern recognition: Markets with memories of the 2019 tanker attacks (which produced only an ~8% price spike despite significant provocation) had already calibrated their risk models toward contained outcomes
Market Psychology Note: The "optimism discount" in commodity pricing is a well-documented phenomenon, but it creates a dangerous asymmetry. When markets price in resolution ahead of confirmation, they also inadvertently price out insurance against breakdown — leaving portfolios structurally underhedged if negotiations collapse.
The Asymmetric Risk Structure Facing Investors
The post-ceasefire positioning creates a fundamentally one-sided risk profile that investors need to understand:
- Downside scenario (deal holds): Brent drifts toward pre-conflict lows of $65-$75 per barrel as Iranian crude re-enters global supply
- Upside shock scenario (deal collapses): Rapid repricing back toward the $100-$120 per barrel range as the risk premium rebuilds almost instantaneously
- Asymmetric tail: The market is currently positioned for the former, meaning the magnitude of a potential upside shock significantly exceeds the incremental downside from current levels
This asymmetry matters differently for holders of oil futures versus holders of energy equities. Futures traders face direct mark-to-market exposure. Equity holders have company-specific buffers — hedging programmes, balance sheet strength, dividend policies — that moderate but do not eliminate the price exposure.
Three Scenarios for Oil Prices Over the Next 60 Days
The 60-day ceasefire window is not a resolution — it is a structured negotiating period. How that window concludes will determine the medium-term trajectory for crude pricing and energy sector equities.
Scenario A — Deal Holds and Hormuz Normalises (Base Case)
- Brent crude consolidates in the $75-$85 per barrel range
- Iranian crude re-enters global supply, adding incremental downward pressure
- OPEC market influence creates internal tension as Iranian volumes compete with member country quotas — a structural friction that has historically produced cartel compliance challenges
- Net impact: Gradual price softening; energy sector equities face modest headwinds as the conflict premium fully deflates
Scenario B — Partial Implementation with Residual Tension (Elevated Risk Case)
- Deal signed but implementation contested; periodic incidents continue in or near the Strait
- Commercial shipping resumes at reduced volumes; marine insurance underwriters maintain elevated war-risk premiums
- Brent crude trades in a volatile $85-$100 per barrel band
- Net impact: Energy sector volatility persists; safe-haven assets including gold safe-haven demand and defence-sector equities maintain elevated demand
Scenario C — Deal Collapse and Strait Re-Closure (Tail Risk)
- The ceasefire framework breaks down within the 60-day window
- Hormuz effectively re-closes; US naval forces return to the region
- Brent crude rapidly reprices toward $110-$120+ per barrel
- Global inflation re-accelerates, confronting central banks with the least desirable monetary policy scenario: rising prices coinciding with demand-side weakness
- Net impact: Severe commodity market dislocation; energy equities surge, broader equity markets sell off sharply
Critical Observation: The market is currently pricing Scenario A as the dominant outcome. Any credible signal pointing toward Scenario B or C would produce disproportionately large price movements, precisely because so much risk premium has already been unwound. The asymmetry runs upward.
Why Full Shipping Normalisation Will Take Months, Not Days
The formal reopening of the Strait of Hormuz does not equal the immediate restoration of normal commercial shipping volumes. Analysts broadly project that a return to pre-conflict (February 2026) baseline traffic levels could take months to years due to a series of operational and commercial obstacles:
- Mine-clearing operations must be completed before commercial passage can be declared genuinely safe — a process that requires specialist naval assets and cannot be rushed without catastrophic risk
- Marine insurance underwriters require independent security verification before reinstating standard war-risk coverage at pre-conflict premium levels
- Tanker operators will rebuild confidence in the route incrementally, typically favouring observed safety data over diplomatic assurances
- Cargo owners may continue routing shipments via longer alternative paths until multiple safe transits have been logged and verified
The early appearance of an LNG tanker testing the Strait shortly after ceasefire signals emerged was encouraging. However, it represents a single data point in a process that historically takes considerable time to reach full commercial confidence. The broader LNG supply outlook remains contingent on how swiftly operators and underwriters restore confidence in the corridor.
The next major ASX story will hit our subscribers first
How the Hormuz Crisis Transmits Into Broader Financial Markets
The Oil-Inflation-Interest Rate Transmission Chain
Sustained crude price spikes above $100 per barrel historically correlate with consumer price index acceleration of 1.5 to 3 percentage points across a 6 to 12 month lag window. The 2026 conflict's peak pricing near $120 per barrel represented a meaningful inflationary impulse across import-dependent economies — including Australia.
Central banks including the US Federal Reserve and the Reserve Bank of Australia faced a classic stagflationary dilemma at the conflict's peak: energy-driven inflation was rising while forward economic indicators were deteriorating under the weight of supply uncertainty and elevated input costs. Tightening monetary policy into that environment risks choking legitimate demand-side activity. Holding rates risks entrenching inflationary expectations that prove difficult to dislodge.
The ceasefire deal's positive impact on inflation expectations is therefore not merely an energy story — it has direct implications for the interest rate outlook that affects every rate-sensitive asset class from REITs to growth equities.
Gold's Anomalous Behaviour During the Crisis
Gold's performance during the 2026 Hormuz conflict diverged notably from its historical safe-haven role. Prices dipped below $4,000 per ounce during active military exchanges — a counterintuitive move that carries important interpretive weight.
This behaviour signals that markets assessed the conflict as geographically contained and time-limited rather than as the leading edge of a systemic global rupture. When investors are confident that a geopolitical event will resolve without triggering broader financial system stress, they often reduce gold allocations as opportunity costs rise and crisis hedges are unwound.
The subsequent bounce in gold on the day ceasefire signals emerged suggests traders were actually buying the resolution rather than fleeing to safety — a psychologically sophisticated market response. For ASX-listed gold miners including Northern Star (ASX: NST) and Evolution Mining (ASX: EVN), this dynamic suggests that the conflict itself provided limited fundamental support, and the medium-term gold price outlook depends more on US dollar dynamics and real interest rate trajectories than on this specific geopolitical episode.
What the Hormuz Resolution Means for ASX Energy and Resource Investors
The following analysis addresses broad ASX sector dynamics and is general market analysis only. It does not constitute financial advice. Investors should conduct their own research and seek professional guidance before making investment decisions.
ASX Sector Sensitivity Matrix
| Sector | Conflict Escalation Impact | Deal Resolution Impact | Key Driver |
|---|---|---|---|
| Oil and LNG Producers | Strongly positive | Moderately negative | Crude and LNG spot prices |
| Coal Exporters | Moderately positive | Neutral to slightly negative | Energy substitution demand |
| Gold Miners | Mildly positive | Neutral | Safe-haven demand flows |
| Defence Technology | Strongly positive | Neutral (structural tailwind remains) | Global defence spending |
| Industrials and Manufacturing | Strongly negative | Positive | Input cost normalisation |
| REITs and Rate-Sensitive Sectors | Negative | Positive | Inflation and rate expectations |
Key ASX Names and Their Conflict Positioning
Energy producers carry the most direct leverage to crude and LNG pricing in both directions. Woodside (ASX: WDS) and Santos (ASX: STO) benefit substantially from elevated oil and LNG spot prices during conflict escalation, but face corresponding headwinds as the conflict premium deflates. Notably, both names edged higher during the final days of active military exchanges even as crude prices softened — a signal that equity investors were maintaining a hedged posture rather than outright selling the peace dividend.
Thermal coal producers such as Whitehaven Coal (ASX: WHC) benefit indirectly from energy supply anxiety as utilities and industrial consumers seek alternative fuel sources when oil and gas supply is threatened. As Hormuz normalises, that substitution premium fades.
Defence technology companies including DroneShield (ASX: DRO) and Electro Optic Systems (ASX: EOS) represent a structurally different investment thesis. Their outlook is driven by sustained global defence spending trends that persist regardless of any single conflict's resolution. DroneShield declined approximately 27% over the month preceding the ceasefire, partly due to an ASIC investigation, meaning any renewed conflict risk sentiment could provide sentiment support — though the company's fundamental outlook is better evaluated on its technology pipeline and contract awards than on geopolitical tailwinds alone.
Investment Framework Note: The key distinction between an escalation-driven trade and a structural position matters enormously here. Energy producers and thermal coal companies offer tactical exposure to conflict risk. Defence technology companies potentially offer longer-duration structural exposure to elevated global security spending regardless of whether this specific ceasefire holds.
The Escalation Fatigue Phenomenon and Its Hidden Danger
A pattern emerged clearly during the 2026 conflict that deserves careful attention: each successive military exchange produced smaller crude price reactions than the previous one. This reflects a rational cognitive adaptation by traders who repeatedly observed escalation without sustained supply destruction.
However, escalation fatigue introduces a structural vulnerability. When traders persistently assign low probability to genuine supply disruption, the war risk premium embedded in oil prices compresses below its actuarially appropriate level. The paradox is that this makes the system more fragile, not less: when a genuine disruption does materialise, the market has insufficient risk premium buffer, meaning the repricing impulse is amplified rather than absorbed.
The 2026 conflict illustrates this dynamic perfectly. Brent was trading near its pre-war level of approximately $71 per barrel even during active military exchanges — a compressed risk premium that reflected accumulated escalation fatigue. Consequently, when the Strait actually closed, the market had almost no cushion, and the repricing to $120 per barrel was correspondingly rapid and severe.
Comparing Conflict Episodes Across Three Key Dimensions
| Metric | 1990 Gulf War | 2019 Tanker Attacks | 2026 US-Iran Conflict |
|---|---|---|---|
| Duration of Disruption | ~7 months | Days to weeks | 100+ days |
| Peak Brent Price | ~$40/bbl | ~$65/bbl | ~$120/bbl |
| Supply Actually Lost | Significant | Minimal | Significant (Strait closure) |
| Market Recovery Speed | Months | Days | Weeks (with deal) |
| Diplomatic Resolution | Coalition military action | No formal deal | 60-day MOU framework |
Structural Lessons for Energy Security and Long-Term Investors
The 2026 Hormuz conflict exposed the continued fragility of global energy supply chains despite decades of diversification rhetoric. No meaningful alternative routing exists for Persian Gulf crude at the scale required to offset a genuine Strait closure, and this geographic reality is a permanent feature of the energy system — not a variable that diplomatic agreements alter.
The episode has accelerated policy discussions across OECD nations around:
- Strategic petroleum reserve adequacy and drawdown protocols
- Accelerated investment in non-Persian Gulf supply basins
- The viability of alternative maritime energy routing infrastructure
- The role of LNG as a flexible supply buffer during regional crude disruptions
For long-term investors, the broader lesson is that geopolitical risk in energy markets is not episodic — it is structural and recurring. The Hormuz corridor will remain a source of periodic market disruption for as long as Iran's geographic position at the waterway's northern shore remains unchanged, which is to say indefinitely.
Portfolios that treat each Hormuz escalation as a unique event rather than as one manifestation of a permanent structural risk are likely to be perpetually surprised. Building a considered, pre-planned response framework — distinguishing between tactical energy exposure, structural defence positioning, and safe-haven allocations — is a more durable approach than reactive trading on each new headline.
Frequently Asked Questions: US and Iran Strait of Hormuz Oil Prices
What percentage of global oil passes through the Strait of Hormuz?
Approximately 20% of all globally traded crude oil — equivalent to roughly 17 to 21 million barrels per day — transits through the Strait of Hormuz. No alternative routing infrastructure exists at comparable scale, making it the most strategically critical maritime chokepoint in the global energy system.
How high did oil prices go during the 2026 US-Iran conflict?
Brent crude reached a wartime peak of approximately $120 per barrel in late April 2026, rising from a pre-conflict range of $65 to $75 per barrel. Following the ceasefire announcement, Brent fell to approximately $83.88 per barrel, with WTI declining to $80.96 per barrel simultaneously.
What are the key terms of the US-Iran ceasefire deal?
The MOU includes a 60-day ceasefire period, suspension of US sanctions on Iranian crude exports, release of approximately $24 billion in frozen Iranian sovereign funds, Iran's commitment to not pursue nuclear weapons development, reopening of the Strait of Hormuz to commercial traffic, and withdrawal of the US naval blockade from Iranian ports.
Why did oil prices fall before the deal was officially signed?
Financial markets began discounting diplomatic resolution significantly ahead of the formal announcement. Institutional capital repositioned based on the increasing probability of a ceasefire, creating selling pressure on crude futures before the MOU was confirmed. This behaviour reflects the growing sophistication of geopolitical risk pricing in commodity markets.
How long will it take for Strait of Hormuz shipping to return to normal?
Despite the formal reopening, analysts broadly project that full normalisation of commercial shipping volumes could take months to years. Mine-clearing operations, marine insurance reinstatement, and the gradual rebuilding of operator confidence in route safety all contribute to a slower normalisation than diplomatic headlines suggest.
What does the Hormuz deal mean for ASX investors?
ASX energy producers with LNG and oil exposure face a transitional environment as the conflict premium deflates. The key variables are the pace of Iranian crude re-entering global supply, OPEC+ production responses, and the durability of the 60-day ceasefire framework. Defence technology companies maintain structural support from global spending trends independent of this specific resolution. General investment disclaimer: this is market analysis only, not financial advice.
Want to Stay Ahead of the Next Major Resource Discovery on the ASX?
While geopolitical events like the Strait of Hormuz crisis dominate energy market headlines, the most significant wealth-creation opportunities for Australian investors have historically come from major mineral discoveries — explore Discovery Alert's dedicated discoveries page to see the historic returns that early-positioned investors have captured. Powered by the proprietary Discovery IQ model, Discovery Alert delivers real-time ASX mineral discovery alerts directly to subscribers, cutting through market noise to surface actionable opportunities the moment they are announced — begin your 14-day free trial today.