
August 6, 2026
Tariff Cycles, Import Surges, and the GDP Arithmetic Behind America's Widening Trade Gap
Global trade deficits are rarely simple stories. Behind every headline number sits a web of corporate behaviour, legal architecture, national accounting conventions, and sectoral competitiveness dynamics that the top-line figure obscures entirely. When a single month's trade data lands with enough force to materially shift quarterly GDP projections, it signals something more significant than a routine statistical fluctuation. It points to structural forces reshaping how goods move across US borders, and why.
That is precisely the situation confronting analysts and policymakers following the release of May 2026 US trade figures. The US trade gap in May widest in 14 months reading has reignited debate about tariff-driven distortions, export competitiveness, and the durability of broader economic momentum heading into the second half of 2026. Understanding how tariffs work is essential context for interpreting why these figures have landed with such force.
When big ASX news breaks, our subscribers know first
Two Deficits, Two Methodologies: Why the Measurement Framework Matters
Before interpreting the scale of May's deterioration, it is worth understanding that the US government publishes two distinct trade deficit measures, each serving different analytical purposes.
The Census Bureau goods-only deficit tracks physical commodity flows and registered $106.5 billion in May 2026, up from $83 billion in April. This is the measure most sensitive to tariff-related distortions because physical goods are directly subject to import duties.
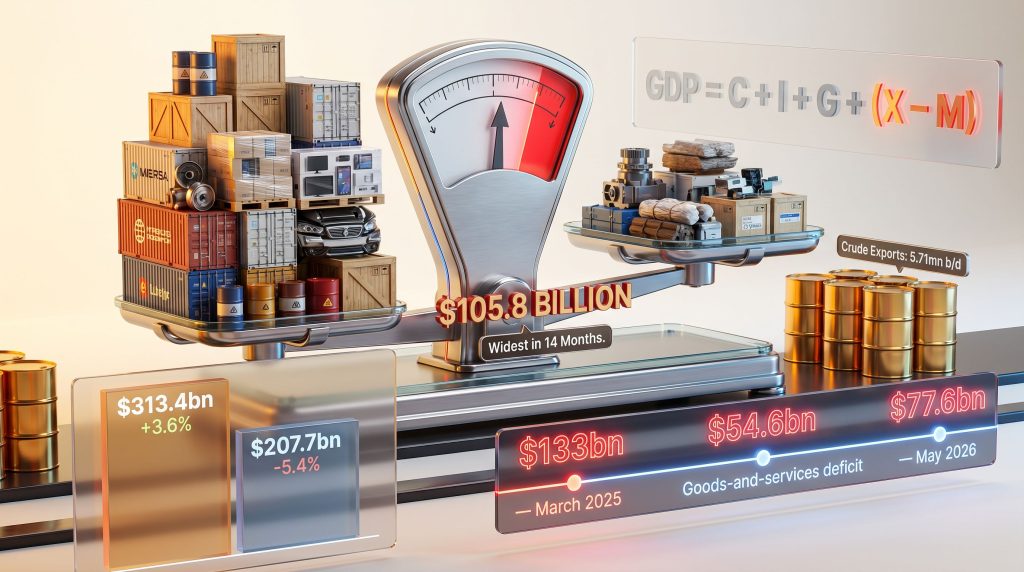
The Bureau of Economic Analysis (BEA) goods-and-services deficit is broader, incorporating financial services, tourism, intellectual property licencing, and other invisible trade. This measure widened to $77.6 billion in May from $54.6 billion in April, representing the largest shortfall since the $133 billion recorded in March 2025. The services component generated a surplus of $28.9 billion, which partially cushions the goods weakness.
The divergence between the two measures matters for investors and GDP modellers because they are used in different contexts:
- The Census Bureau measure is most relevant for tariff policy analysis and supply chain cost modelling
- The BEA measure feeds directly into national accounts and is the figure used in GDP expenditure calculations
- Seasonal adjustments can cause the two series to diverge on a month-to-month basis, complicating clean comparisons
- The services surplus is structurally important: it reflects US competitive strengths in finance, technology licensing, and professional services that do not show up in goods trade data
How Net Exports Flow Into GDP
Under the standard expenditure approach to national accounting, GDP is calculated as the sum of consumer spending, business investment, government expenditure, and net exports. Net exports are defined as total exports minus total imports. When imports rise faster than exports, the net export component becomes more negative and directly subtracts from the GDP total, even when import growth is itself a symptom of strong domestic demand.
Oxford Economics estimated that the deterioration in net trade observed in May would subtract approximately two percentage points from second-quarter 2026 GDP growth. Critically, the same analysts projected that robust capital expenditure and inventory accumulation would offset much of this drag, keeping annual growth above the 2% threshold for the quarter. This distinction matters: a trade-driven GDP headwind is not the same as a recession signal, particularly when it is accompanied by genuine investment activity.
What Drove the May 2026 Import Surge and Export Contraction
The widening of the deficit reflected simultaneous pressure from both sides of the trade ledger. Furthermore, the interplay between tariffs and trade balances has become increasingly difficult to disentangle from broader macroeconomic signals.
Import Volumes: Sector-by-Sector Breakdown
Total goods imports climbed to $317 billion in May from $305 billion in April, a gain of approximately 3.9%. The increase was broadly distributed across categories:
| Import Category | May 2026 Value | Direction |
|---|---|---|
| Total Goods Imports (BEA basis) | $317bn | Increased |
| Consumer Goods | ~$60bn | Increased |
| Auto and Parts | ~$37bn | Broadly stable |
| Industrial Supplies | Increased | Increased |
| Capital Goods (ex-autos) | Increased | Increased |
| Food Imports | Increased | Increased |
| Services Imports | $78bn | Edged higher |
The breadth of the import increase points to a behavioural rather than structural explanation. Businesses across manufacturing, retail, and industrial sectors appear to have accelerated procurement ahead of anticipated tariff changes, a strategy known as front-loading. When companies believe import costs are about to rise, the rational response is to build inventory while duties remain at current levels. This behaviour inflates import volumes in the short term and creates a statistical spike that can mislead headline readers unfamiliar with the underlying incentive structure.
Export Performance: Where US Outbound Trade Fell Short
Total goods exports declined sharply to $210 billion in May from $222 billion in April, a contraction of approximately 5.4%. The breakdown reveals specific areas of vulnerability:
| Export Category | May 2026 Value | Change |
|---|---|---|
| Total Goods Exports (BEA basis) | $210bn | -$12bn |
| Industrial Supplies (energy, metals, fertilizers) | $83bn | Declined |
| Nonmonetary Gold | $5.7bn | Fell more than 50% |
| Capital Goods | $66.9bn | -$3.5bn |
| Consumer Goods | $20.7bn | -$2bn |
| Auto and Parts | ~$13bn | Little changed |
| Services Exports | $107bn | Increased |
The collapse in nonmonetary gold exports by more than half to $5.7 billion is a particularly notable development. In prior months, gold arbitrage flows had elevated this category as traders exploited price differentials between US and international markets. The reversal signals that those arbitrage opportunities have closed or that positioning has unwound, and it represents a meaningful one-off drag on export totals that may not persist into subsequent months.
The 9.2% contraction in consumer goods exports is more structurally concerning. It suggests either softening global demand for US-manufactured consumer products, displacement by competing suppliers, or the early effects of retaliatory trade measures imposed by partner economies in response to US tariffs.
Analytical Note: Not all export weakness carries the same long-term implications. A reversal in gold arbitrage flows is mechanical and temporary. Persistent softness in consumer goods and capital equipment exports, by contrast, would indicate genuine erosion of US export competitiveness that cannot be reversed simply by adjusting tariff policy.
The Legal Architecture of the 2026 Tariff Environment
Understanding the May trade figures requires appreciating the specific legal framework underpinning current US tariff conditions. In February 2026, the Trump administration imposed 10% blanket tariffs on goods from most trading partners using Section 122 emergency authority under the Trade Act of 1974. This provision grants the president the power to impose temporary import surcharges for balance-of-payments purposes, with an expiry mechanism built into the statute.
The Supreme Court subsequently struck down the broader tariff architecture that the administration had declared from April 2025 onward, limiting which legal tools remained available. Section 122 duties are scheduled to expire on 24 July 2026, creating a significant near-term policy cliff. The Tax Foundation has estimated that the cumulative tariff burden under current measures will cost American households approximately $700 per household in 2026, functioning as an effective tax increase on consumer purchasing power.
The Front-Loading Cycle and Statistical Distortion
This tariff architecture has generated a highly unusual oscillating pattern in trade data that can mislead analysts who treat monthly figures as clean readings of underlying economic conditions. In addition, the supply chain disruption generated by these policy cycles has compounded the difficulty of interpreting headline numbers accurately:
- March 2025 surge: The initial announcement of broad tariffs triggered a historic front-loading episode, driving the goods deficit to a record $159 billion for the cycle
- Post-front-loading correction (April 2026): Once inventories were rebuilt and tariff policy uncertainty temporarily resolved, import demand fell sharply, compressing the goods deficit to $83 billion
- Second-wave surge (May 2026): As the July 2026 Section 122 expiry approached, a new round of precautionary importing inflated the deficit back to $106.5 billion
- Q3 2026 uncertainty: Whether tariffs are renewed, replaced, or allowed to lapse will determine whether a third front-loading wave emerges
Risk Scenario: If Section 122 duties are replaced with alternative measures carrying higher or broader coverage, businesses would face renewed incentives to front-load imports into the pre-announcement window, potentially producing another statistical spike that overstates structural import demand.
Energy Trade: The Structural Surplus Providing Partial Offset
One underappreciated feature of the May 2026 trade data is the positive energy trade balance the US continues to maintain. On an unadjusted basis, US exports of petroleum products and crude oil reached $34.7 billion against energy-related imports of $19.6 billion, generating a meaningful surplus that partially offsets goods trade weakness in other categories.
Monitoring crude oil price trends remains critical for understanding how this energy surplus may evolve. Crude oil export volumes rose to 5.71 million barrels per day in May, up from 5.57 million b/d in April and recovering strongly from 4.31 million b/d in February. Simultaneously, crude imports fell to 5.58 million b/d in May from 5.92 million b/d in April, continuing a downward trend from 6.36 million b/d as recently as February.
This reflects the structural transformation of the US from a net energy importer to a significant net energy exporter, a shift underpinned by shale production capacity that did not exist at scale a decade ago. The energy surplus is one of the few trade categories where the US holds a durable structural advantage.
Contextualising May 2026 Within the 14-Month Trade Cycle
Placing May's figures within their historical context reveals the extent to which the current deficit pattern is policy-driven rather than organic:
| Period | Goods and Services Deficit (BEA) | Goods-Only Deficit (Census) | Primary Driver |
|---|---|---|---|
| March 2025 | $133bn | $159bn | Initial tariff front-loading peak |
| April 2026 | $54.6bn | $83bn | Post-correction inventory drawdown |
| May 2026 | $77.6bn | $106.5bn | Second-wave precautionary importing |
The $133 billion March 2025 peak remains the cycle's extreme, and the US trade gap in May widest in 14 months has not approached that level. However, the pattern itself confirms that the deficit is oscillating with tariff policy cycles rather than converging toward a structural equilibrium. The services surplus of $28.9 billion in May continues to moderate the headline reading and reflects the enduring competitiveness of US professional services, software, and financial exports. According to Reuters reporting on the May figures, capital goods imports hit a record high during the month, underscoring the scale of business front-loading activity.
The next major ASX story will hit our subscribers first
Broader Macroeconomic Consequences: Inflation, Purchasing Power, and Currency Dynamics
The trade deficit does not exist in isolation from other economic variables. Several second-order effects deserve close attention.
Inflationary transmission: Tariff-driven cost increases on imported goods are being partially absorbed by businesses and passed through to consumers. The Tax Foundation's $700 per household estimate represents a real reduction in disposable income, functioning similarly to a consumption tax. Consumer goods import volumes rising even under tariff pressure suggests a degree of price-inelastic demand, meaning households are tolerating higher costs rather than switching to domestically produced alternatives.
Currency implications: Persistent and widening current account deficits typically generate downward pressure on the domestic currency over medium-term horizons, as more dollars flow abroad to pay for imports than return through export earnings. The dollar's reserve currency status and the capital account surplus generated by foreign investment inflows into US assets have historically offset this pressure, but sustained deterioration in the trade position can eventually test that resilience.
Labour market interaction: The broader macroeconomic context includes weakening jobs data. US employment growth slowed sharply in June 2026, with only 57,000 jobs added against analyst expectations of approximately 110,000, according to Bureau of Labor Statistics data. Prior months were also revised significantly downward. A combination of a widening trade deficit, rising household tariff burdens, and softening job creation creates a more complex economic backdrop than any single indicator would suggest.
Key Variables to Monitor Through Q3 2026
For investors and businesses navigating this environment, several indicators will be decisive in determining whether the May deficit represents a temporary tariff-cycle distortion or the beginning of a more sustained deterioration:
- July 2026 tariff policy decision: The expiry or renewal of Section 122 duties on 24 July is the single most important near-term policy variable affecting trade volumes and business inventory strategies
- Q2 2026 GDP advance estimate: Will confirm whether the projected two-percentage-point trade drag from Oxford Economics materialised as anticipated
- Consumer goods export trend: Sustained weakness beyond the May reading would suggest structural competitiveness erosion rather than a one-off reversal of gold arbitrage flows
- Crude oil export volumes: Any sustained decline from the 5.71 million b/d May reading would narrow the energy surplus that provides meaningful offset to the goods deficit
- Consumer price data: Tracking whether tariff-driven import cost pass-through continues to accelerate, compressing household real purchasing power
- US dollar performance: Watching for signs that the sustained current account deficit is beginning to exert meaningful downward pressure on the dollar exchange rate
Investor Consideration: Companies with concentrated import exposure in consumer goods or industrial supplies face the greatest near-term cost uncertainty. The period between now and the 24 July tariff decision represents a window of maximum ambiguity, where procurement and hedging strategies may need to be reassessed depending on the policy outcome. This article does not constitute financial advice. Investors should conduct independent research and consult qualified advisers before making investment decisions.
Frequently Asked Questions: US Trade Deficit in May 2026
What is the US trade deficit for May 2026?
The US goods trade deficit reached $106.5 billion in May 2026 on a Census Bureau basis, the widest reading in 14 months. The broader goods-and-services deficit on a BEA basis registered $77.6 billion, the largest since the $133 billion recorded in March 2025.
Why did the US trade deficit widen so sharply in May 2026?
The widening reflected a simultaneous import acceleration and export contraction. Goods imports rose to $317 billion as businesses advanced purchasing ahead of tariff changes, while goods exports declined to $210 billion, led by sharp falls in industrial supplies, nonmonetary gold, and consumer goods shipments. The global trade war impact has consequently made these monthly swings increasingly difficult to interpret without policy context.
How does the May trade deficit affect US GDP growth?
Net exports are a direct component of GDP under the expenditure method. Oxford Economics projected that the May deterioration would subtract approximately two percentage points from second-quarter 2026 GDP growth, though strong business investment and inventory accumulation are expected to keep annual growth above 2%. Historical trade balance data tracked by Trading Economics provides useful context for situating May's reading within longer-term trends.
What happens when Section 122 tariffs expire in July 2026?
The expiry of 10% blanket tariffs on 24 July 2026 creates significant policy uncertainty. If allowed to lapse without replacement, import cost pressures may ease and front-loading incentives will diminish. If replaced with alternative or elevated duties, another precautionary import surge is possible, and the US trade gap in May widest in 14 months may prove to be only a mid-cycle reading rather than a peak.
Is the US energy trade balance in surplus?
Yes. US petroleum-related exports reached $34.7 billion in May against imports of $19.6 billion on an unadjusted basis. Crude oil export volumes rose to 5.71 million b/d, maintaining the positive energy trade balance that partially offsets broader goods trade weakness.
For commodity-specific trade flow data across energy, metals, and agricultural markets, Argus Media publishes detailed market intelligence at argusmedia.com.
Want to Stay Ahead of the Commodity and Resource Trends Shaping Global Markets?
While trade deficits and tariff cycles reshape global commodity flows, Discovery Alert's proprietary Discovery IQ model delivers real-time alerts on significant ASX mineral discoveries, instantly translating complex market shifts into actionable investment opportunities — begin your 14-day free trial today, or explore how historic mineral discoveries have generated exceptional returns to understand why timing your entry matters.