
August 20, 2026
When Grade Matters More Than Volume: Rethinking What Reserve Growth Really Means
Across the global gold mining industry, a persistent misconception shapes how investors evaluate exploration success. Many market participants fixate on the sheer volume of ounces reported in a Mineral Resource Estimate, treating headline tonnage as the primary scorecard for a company's geological progress. However, seasoned mining analysts understand that volume without economic viability is little more than a geological curiosity. The more meaningful signal lies in reserve grade, reserve confidence, and the cost at which those reserves are being built.
That distinction sits at the heart of understanding why the Westgold Resources ore reserves increase reported in its FY26 update carries genuine strategic weight, rather than representing a simple bookkeeping exercise in ounce accumulation.
When big ASX news breaks, our subscribers know first
The Geology Behind the Numbers: Resource vs. Reserve and Why It Matters
Unpacking the Classification Hierarchy
The minerals reporting framework used by ASX-listed companies operates under the JORC Code, which establishes a structured hierarchy for classifying geological inventory. Understanding where a company sits within this framework reveals a great deal about the quality of its asset base.
Mineral Resource Estimates capture all mineralised material that has a reasonable prospect of eventual economic extraction. They are subdivided into three confidence tiers:
- Inferred Resources: The lowest confidence tier, typically based on limited drilling and wider-spaced geological modelling. These ounces carry significant geological uncertainty and cannot be converted to reserves.
- Indicated Resources: Moderate confidence, supported by closer-spaced drilling and more robust geological interpretation. These can serve as the basis for reserve conversion once economic and technical studies are completed.
- Measured Resources: The highest geological confidence tier, derived from tight-spaced drilling that allows detailed grade and continuity characterisation. These form the foundation of economically robust mine planning.
An Ore Reserve, by contrast, is a subset of the MRE that has passed a rigorous set of modifying factors, including mining method, metallurgical recovery rates, infrastructure requirements, regulatory conditions, and financial assumptions based on current costs and commodity price inputs. Only Measured and Indicated Resources can be converted to Proved and Probable Reserves respectively.
The practical implication: an ounce sitting in the Ore Reserve category is categorically different from an ounce sitting in the Inferred Resource category. One is a confirmed, economically mineable asset. The other is a geological possibility.
Why the Measured and Indicated Ratio Is a Leading Indicator of Future Reserves
One of the most underappreciated metrics in mining investment analysis is the proportion of a company's total resource inventory that sits in higher-confidence categories. This ratio functions as a leading indicator of future reserve conversion potential.
Westgold's Measured and Indicated Resources now represent 62.6% of total inventory, up from 56.6% in FY25. That six-percentage-point improvement reflects the cumulative effect of systematic infill drilling across multiple assets, tightening geological models and elevating confidence in grade continuity. Furthermore, in practical terms, a greater proportion of Westgold's resource base is now eligible for conversion to reserves, setting the stage for further reserve growth even before a single additional discovery is made.
FY26 Reserve Update: The Numbers in Context
A Multi-Year Trajectory of Post-Depletion Growth
| Reporting Period | Total Ore Reserves | Reserve Grade | Year-on-Year Change |
|---|---|---|---|
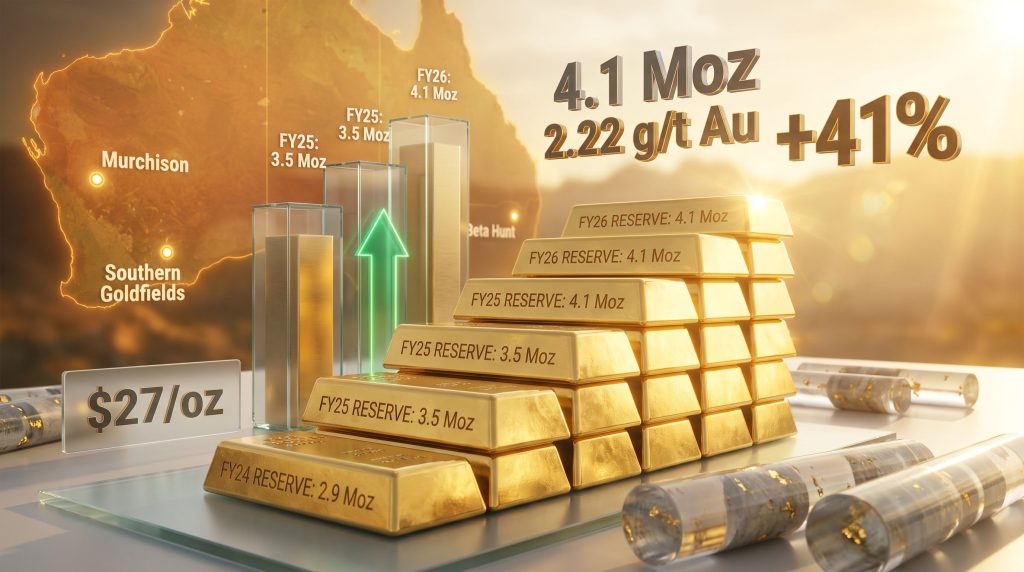
| 30 June 2025 | 56 Mt at 1.93 g/t Au for 3.5 Moz | 1.93 g/t Au | +5% post-depletion |
| 30 June 2026 | 57 Mt at 2.22 g/t Au for 4.1 Moz | 2.22 g/t Au | +41% post-depletion and divestments |
The FY26 figures represent the third consecutive year of post-depletion reserve growth, a streak that distinguishes Westgold from many mid-tier ASX gold producers. Replacing mined ounces organically is challenging enough. Achieving net reserve growth after depletion and after removing ounces from divested assets requires exploration execution of a higher order.
The critical context that many headline readers miss: the 41% reserve increase was achieved after accounting for the removal of approximately 3 million ounces from the prior Mineral Resource following the divestment of non-core assets. The organic additions therefore had to overcome a substantial headwind before delivering net growth. That the reserve base expanded meaningfully in spite of this illustrates the scale of the underlying geological opportunity being converted.
The Grade Improvement: Arguably the Most Important Number
While the volumetric increase attracts the most attention, the 15% improvement in reserve grade, from 1.93 g/t Au to 2.22 g/t Au, may have more lasting implications for mine economics.
In gold processing, grade is not merely a geological metric. It is a direct input into unit cost calculations. A higher-grade ore feed requires less material to be moved and processed per recovered ounce, which translates to lower energy consumption, reduced reagent use, and improved all-in sustaining cost (AISC) performance. For investors modelling future cash flows, the grade of the reserve base is as important as its size.
A useful rule of thumb in gold mining: a 10–15% improvement in reserve grade, holding all other variables constant, can meaningfully compress AISC per ounce even without any operational efficiency gains. The grade upgrade in Westgold's FY26 update is therefore not cosmetic. It reflects a structurally improved cost position embedded in the reserve base itself.
What Drove the Reserve Growth: Asset-by-Asset Analysis
Beta Hunt and the Fletcher Maiden Reserve
The single largest contributor to the Westgold Resources ore reserves increase was the declaration of a maiden Ore Reserve at Fletcher, located within the Beta Hunt mine in Western Australia's Southern Goldfields. This addition contributed 1.1 million ounces, lifting Beta Hunt's total project Ore Reserve to 1.6 million ounces, representing a 201% increase in total project reserves since Westgold acquired the asset in August 2024.
The Beta Hunt trajectory illustrates a dynamic that experienced mining investors recognise but that rarely receives adequate attention in mainstream analysis: acquisition-driven reserve optionality. When a mining asset is acquired with known mineralisation but limited systematic drilling, the gap between the geological potential and the declared reserve base can be enormous. An incoming operator with capital, technical capability, and drilling focus can close that gap rapidly, generating reserve growth that far exceeds what organic greenfields exploration could deliver in the same timeframe.
The Fletcher system at Beta Hunt appears to exemplify this dynamic. The conversion from acquisition to maiden reserve declaration in approximately two years suggests the mineralisation had been underexplored relative to its actual extent, a not uncommon situation when assets change hands from operators with different strategic priorities. For further context on how interpreting drill results influences these outcomes, the spacing and orientation of drill holes play a decisive role in how quickly confidence categories can be upgraded.
Bluebird-South Junction and Starlight: Organic Murchison Conversion
Within the Murchison portfolio, two assets have been consistent contributors to reserve conversion:
- Bluebird-South Junction recorded a 90% reserve increase to 528 koz in the prior FY25 update, with continued contributions in FY26 through ongoing infill drilling.
- Starlight grew its reserve by 94% to 250 koz in FY25, with further drilling supporting continued conversion into the FY26 period.
Both assets benefit from proximity to existing processing infrastructure, which reduces the marginal cost of converting resources to economically viable reserves. When a tonne of ore can reach a processing facility without requiring new road construction, new power infrastructure, or new tailings facilities, the economic threshold for reserve declaration is lower. Murchison's established operational footprint creates precisely this advantage.
Portfolio Rationalisation as a Quality Filter
The divestment of non-core assets is sometimes misread as a sign of financial distress or strategic retreat. In Westgold's case, however, the evidence points to the opposite interpretation. By removing assets that carried lower-grade, lower-confidence ounces from the resource inventory, the portfolio rationalisation effectively applied a quality filter to the remaining reserve base.
The result: a reserve base carrying a 2.22 g/t Au average grade rather than the 1.93 g/t Au of the previous year. Fewer total resource ounces, but demonstrably higher-quality, higher-confidence inventory. This trade-off — volume for margin — reflects disciplined capital allocation rather than retrenchment. According to Westgold's mineral resources and ore reserves page, this approach is consistent with their broader strategy of prioritising asset quality over raw ounce accumulation.
Reserve Addition Economics: The $27 Per Ounce Benchmark
Why Reserve Replacement Cost Is a Critical Efficiency Metric
One of the most useful but least-discussed metrics in gold mining analysis is the cost at which a company replaces each ounce of reserve consumed through production. As global gold majors face rising discovery costs, land access constraints, and increasingly complex permitting environments, reserve replacement has become structurally more expensive across the industry. Many global producers are now reporting reserve addition costs well above $50 per ounce, with some exceeding $100 per ounce in mature mining jurisdictions.
Against this backdrop, Westgold's reported FY26 reserve addition cost of approximately $27 per ounce, achieved against total exploration and resource development expenditure of $42 million, places it in a highly competitive position. At this cost structure, each dollar invested in exploration generates substantially more reserve value than the sector average, creating a positive feedback loop between exploration investment and reserve-backed asset value.
For investors constructing net asset value (NAV) models for gold producers, reserve replacement cost is a critical input. Low-cost reserve replacement allows a company to maintain or extend mine life without proportional increases in sustaining capital, directly supporting higher NAV per share.
The 10-Year Reserve Life and Its Implications for Capital Planning
Westgold maintains a 10-year Reserve life at current processing capacity across the group. This benchmark matters for several reasons beyond the obvious comfort of long-dated inventory:
- Capital planning certainty: A decade of declared reserves provides the geological foundation for long-term infrastructure investment decisions, including potential mill expansions.
- Workforce and contractor stability: Longer reserve lives support stable employment and contractor relationships, reducing the operational friction of workforce churn.
- NAV multiple support: In equity valuation, longer reserve lives typically underpin higher price-to-NAV multiples, as the market assigns lower risk to near-term production continuity.
- Financing optionality: Lenders and bond markets treat reserve life as a core credit metric. A 10-year reserve base materially improves Westgold's access to and cost of debt financing.
FY27 Exploration Strategy: Scaling the Program
A Step-Up in Drilling Investment
Westgold has indicated an exploration and resource development drilling budget of between $50 million and $75 million for FY27, subject to board approval and prevailing market conditions. This represents a meaningful increase from the $42 million deployed in FY26 and signals management confidence in the geological prospectivity of the remaining resource inventory.
With 26 drill rigs active across the portfolio, the operational infrastructure to execute this expanded program is already in place. The scale of the active rig fleet is itself notable: maintaining 26 rigs across a multi-asset portfolio requires substantial logistical coordination, skilled workforce availability, and ongoing core analysis capacity. This level of operational readiness reduces the lead time required to accelerate drilling when geological targets are identified.
Priority Assets and Strategic Focus Areas
| Asset | Strategic Focus | Expected Contribution |
|---|---|---|
| Beta Hunt (Fletcher) | Reserve extension and resource conversion | Near-term reserve growth |
| Big Bell South | Hub optimisation and mill feed quality | Murchison throughput improvement |
| Paddy's Flat | Resource definition and reserve conversion | Southern Goldfields reserve base |
| Cuddingwarra | Broader hub resource development | Long-term mine life extension |
The Mill Expansion Compounding Effect
Management has explicitly linked continued Ore Reserve growth to the potential for mill expansion across its processing hubs. This connection is strategically important and worth unpacking for investors unfamiliar with mine development economics.
Processing capacity is the critical bottleneck in most gold mining operations. A mill can only process a fixed tonnage per year, regardless of the size of the ore reserve sitting upstream of it. When a company declares reserve volumes that significantly exceed the practical life of existing mill capacity, it creates a credible geological justification for capital investment in mill expansion.
Expanded mill capacity then enables higher throughput, greater annual gold production, stronger operating cash flow, and ultimately greater reinvestment capacity in further exploration. The compounding dynamic runs as follows: reserve growth supports the business case for mill expansion, expanded mills generate higher production and cash flows, stronger cash flows fund accelerated exploration, and accelerated exploration drives further reserve growth. Each element reinforces the next.
The next major ASX story will hit our subscribers first
Investor Considerations: Reading the Reserve Update Within the Broader Gold Market
Gold Price Assumptions and Reserve Economics
A technical detail that sophisticated investors always scrutinise in reserve announcements is the gold price assumption used to determine cut-off grade economics. Reserves must be economically mineable under current conditions, which requires the company to specify the gold price at which economic viability has been assessed.
In an elevated gold price environment, where spot gold has traded at historically high levels through 2025 and into 2026, the economic threshold for ore classification shifts. Material that might have fallen below the cut-off grade at $1,800 per ounce gold may comfortably qualify as economically mineable at $2,800 per ounce. This means investors should always consider whether a reserve grade improvement reflects genuine geological quality in newly drilled material, or partly reflects a relaxed economic cut-off applied against a higher assumed gold price.
Westgold's reserve grade improvement from 1.93 g/t Au to 2.22 g/t Au actually suggests the opposite dynamic: the company appears to be adding higher-quality material, not simply capturing lower-grade material made viable by higher gold prices. A reserve base that grows in grade while also growing in volume is a materially stronger outcome than volume growth driven purely by cut-off grade relaxation. Furthermore, the relationship between gold price and mining equities means that genuine grade improvements carry far more durable value than price-assumption-driven reclassifications.
ASX Peer Comparison and Market Positioning
Across the ASX gold sector, reserve replacement has been a persistent challenge. Many producers report flat or declining reserves after accounting for annual depletion, particularly as older orebodies mature and high-grade shoots are progressively extracted.
Westgold's three consecutive years of post-depletion reserve growth positions it as a notable outlier. The 81% share price appreciation over the 12 months to August 2026, significantly outperforming the S&P/ASX 200 Index, may partly reflect the market's recognition of this sustained reserve growth trend, alongside the broader tailwind of elevated gold prices.
Investors comparing Westgold against larger ASX gold producers such as Northern Star Resources (ASX: NST) should, consequently, incorporate several metrics beyond headline production volumes and AISC:
- Reserve replacement rate: Net reserve change after depletion, expressed as a percentage.
- Reserve grade trend: Whether the grade of the reserve base is improving, stable, or declining over time.
- Exploration expenditure efficiency: Reserve additions per dollar of exploration spend.
- Reserve life: Years of declared reserves at current processing rates.
On several of these metrics, Westgold's FY26 update presents a competitive picture relative to its peer group, though investors should conduct their own analysis and consider the full range of risks before making investment decisions.
Frequently Asked Questions: Westgold Resources Ore Reserves Increase
What is the total Ore Reserve reported by Westgold Resources in its FY26 update?
Westgold reported total Ore Reserves of 57 million tonnes at 2.22 g/t Au for 4.1 million ounces as at 30 June 2026, representing a 41% increase after accounting for mining depletion and non-core asset divestments.
What is the difference between a Mineral Resource and an Ore Reserve?
A Mineral Resource quantifies the total geological inventory of mineralised material, categorised by geological confidence. An Ore Reserve is a subset that has passed economic, technical, and regulatory modifying factor assessments, confirming it can be profitably mined under current conditions. Ore Reserves carry greater investment significance because they represent confirmed, economically viable inventory rather than a broader geological estimate.
What was the primary driver of Westgold's 41% reserve increase in FY26?
The declaration of a maiden Ore Reserve at Fletcher (Beta Hunt) totalling 1.1 million ounces was the single largest contributor. Continued reserve conversion at Bluebird-South Junction and Starlight also contributed meaningfully. The reserve grade improvement of 15% to 2.22 g/t Au further reflected the higher quality of material being added to the reserve base.
How efficient was Westgold's reserve addition program in FY26?
Westgold deployed $42 million in exploration and resource development during FY26, achieving reserve additions at approximately $27 per ounce, a highly competitive figure relative to industry benchmarks where many producers report costs well above $50 per ounce.
What is Westgold's planned exploration budget for FY27?
Subject to board approval and market conditions, Westgold has indicated an exploration and resource development drilling budget of $50 million to $75 million for FY27, supported by 26 active drill rigs across the portfolio. Those considering the role of definitive feasibility studies in translating this exploration pipeline into production decisions will find the FY27 program particularly relevant to watch.
Key Takeaways: What the FY26 Reserve Update Reveals About Westgold's Strategic Position
The FY26 update delivers several concurrent signals that collectively speak to the operational maturity and geological quality of Westgold's asset portfolio. According to Westgold's latest ASX announcement, these results reflect a deliberate and sustained strategy of high-confidence resource conversion rather than opportunistic ounce accumulation.
- Reserve growth was achieved both organically and through disciplined acquisition integration, not through gold price assumption changes or resource reclassification alone.
- The grade improvement from 1.93 g/t Au to 2.22 g/t Au is structurally significant, embedding a lower unit cost profile into the reserve base before a single additional efficiency improvement is made.
- A $27 per ounce reserve addition cost demonstrates capital-efficient exploration execution against an industry backdrop of rising discovery costs.
- The Beta Hunt trajectory, from acquisition to a 1.6 Moz reserve in under two years, validates the company's ability to unlock underexplored assets through systematic drilling.
- The improvement in Measured and Indicated Resources to 62.6% of total inventory signals a maturing geological database that increases the conversion pipeline for future reserve growth.
- The escalating FY27 drilling budget and established 26-rig fleet indicate management confidence in continued geological upside across the portfolio.
- Sustained reserve growth underpins the long-term case for mill expansion, which represents the next potential inflection point in Westgold's production growth trajectory.
This article is intended for informational purposes only and does not constitute financial advice. Investors should conduct their own due diligence and consider seeking independent financial advice before making investment decisions. Past performance is not indicative of future results. All financial data referenced is sourced from Westgold Resources' ASX announcements as at 30 June 2026.
Want to Stay Ahead of Significant ASX Gold Discoveries as They Happen?
Discovery Alert's proprietary Discovery IQ model scans ASX announcements in real time, instantly identifying high-potential mineral discoveries and converting complex geological data into actionable investment insights — visit the Discovery Alert discoveries page to see how historic finds have generated substantial returns, and begin your 14-day free trial to position yourself ahead of the broader market.