August 21, 2026
When Two Metals Read the Same Data and Reach Opposite Conclusions
Every serious investor in commodities eventually confronts a moment that seems to contradict everything they thought they knew about precious metals: gold and silver, two assets routinely grouped together in the same breath, move in sharply opposite directions on the same day, triggered by the same economic report. To the casual observer, this looks like a market malfunction. To those who understand the underlying demand architecture of each metal, it is one of the most logical outcomes imaginable.
Understanding why is gold down and silver up requires more than tracking price charts. It demands a structural understanding of what each metal actually is, economically speaking, and which forces are capable of moving it.
When big ASX news breaks, our subscribers know first
The Demand Architecture That Separates These Two Metals
The most persistent misconception in retail precious metals investing is treating gold and silver as interchangeable assets that simply differ in price. In reality, they are driven by fundamentally different demand compositions, and that difference becomes critically important when economic data creates conflicting signals across the monetary and industrial domains.
Gold functions almost exclusively as a monetary asset. Its price is governed by real interest rates, U.S. dollar strength, central bank gold demand, and investor expectations around future monetary policy. Industrial consumption of gold is marginal relative to its total demand, primarily limited to dentistry and select electronics applications.
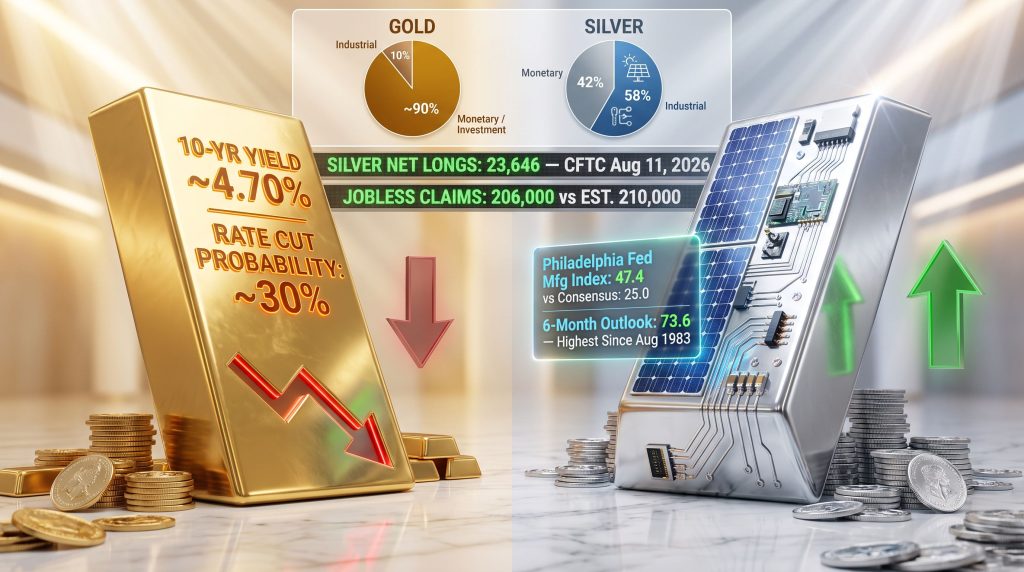
Silver's dual nature occupies an entirely different position. According to the World Silver Survey 2026 published by the Silver Institute, total annual silver demand reached 1,130.6 million ounces, of which approximately 657.4 million ounces, or roughly 58%, came from industrial applications. That is not a secondary characteristic of silver. It is the dominant demand driver.
| Demand Category | Gold | Silver |
|---|---|---|
| Monetary / Investment | ~90%+ | ~42% |
| Industrial / Technology | ~10% | ~58% |
| Primary Industrial Uses | Electronics, dentistry | Solar cells, electronics, electrical contacts |
Key Structural Insight: Silver's industrial footprint means the metal is simultaneously sensitive to monetary conditions and to the health of the global manufacturing economy. Gold has no equivalent second engine. This is the foundational reason the two metals can, and regularly do, diverge within a single trading session.
What Happened on August 20, 2026: The Data That Split the Market
On the morning of August 20, 2026, a single batch of economic data released at 8:30 a.m. ET was sufficient to send gold lower and silver higher within the same session. Both metals opened down roughly 1.2%. By mid-session, their paths had separated entirely.
The Philadelphia Fed Manufacturing Survey
The Federal Reserve Bank of Philadelphia released its August manufacturing index at 47.4, up from 41.4 in July and well above the Dow Jones economist consensus estimate of 25 (Federal Reserve Bank of Philadelphia, Manufacturing Business Outlook Survey, August 2026). That reading represented the index's highest level since April 2021, a span of more than five years.
The details behind the headline figure were, in some respects, more informative than the headline itself:
- The employment component surged 18 points to 27.9, its strongest reading since April 2022.
- The six-month business outlook index climbed 39 points to 73.6, a level not seen since August 1983, more than four decades ago.
- The forward-orders component also strengthened, suggesting the expansion reflected durable momentum rather than a temporary statistical bounce.
Weekly Jobless Claims
The U.S. Department of Labor simultaneously reported that initial jobless claims for the week ending August 15, 2026 came in at 206,000, below the economist consensus of 210,000 (U.S. Department of Labor, August 20, 2026). Persistently low layoffs reinforced the broader picture: the labour market remained tight, and factory activity was accelerating.
| Economic Indicator | Result | Consensus | Impact on Gold | Impact on Silver |
|---|---|---|---|---|
| Philadelphia Fed Manufacturing Index (Aug 2026) | 47.4 | 25.0 | Negative (rate pressure) | Positive (industrial signal) |
| 6-Month Business Outlook Index | 73.6 (highest since Aug 1983) | N/A | Neutral to Negative | Strongly Positive |
| Employment Component | 27.9 (highest since Apr 2022) | N/A | Negative | Positive |
| Weekly Jobless Claims (w/e Aug 15) | 206,000 | 210,000 | Negative | Mildly Positive |
Why Strong Economic Data Pushes Gold Lower
The Real Interest Rate Mechanism
Gold generates no income. There is no coupon, no dividend, and no yield. This characteristic, which gold proponents often frame as a feature rather than a flaw, becomes a direct liability when interest rates rise. The opportunity cost of holding gold increases in precise proportion to the returns available from competing assets, particularly U.S. Treasury bonds.
When the August 2026 data exceeded expectations by such a wide margin, bond markets repriced rate expectations almost immediately. The 10-year U.S. Treasury yield rose more than 5 basis points to approximately 4.70%, reversing the prior session's decline, while the 30-year Treasury yield moved back toward 5.25% (CNBC, August 20, 2026).
CME FedWatch data showed futures markets pricing approximately a 30% probability of a rate hike at the September 15-16 FOMC meeting, with virtually no probability of a rate cut. In practical terms, gold had no easing cycle to look forward to, and that absence placed a ceiling on its price.
The suppression chain that day followed a clear mechanical sequence:
- Strong manufacturing and labour data released at 8:30 a.m. ET.
- Bond markets immediately repriced rate expectations higher.
- The 10-year Treasury yield rose approximately 5 basis points to ~4.70%; the 30-year moved toward 5.25%.
- Rate-cut probability collapsed to near zero; rate-hike probability rose to ~30%.
- Gold's yield disadvantage relative to interest-bearing assets widened.
- Gold traded as low as $4,450.69 before settling near $4,517.18 on the session (GoldSilver.com, August 20, 2026).
Profit-Taking as a Compounding Factor
Beyond the rate mechanism, gold had experienced a substantial prior rally, creating elevated long positioning and technically overbought conditions. When macro headwinds arrive at technically stretched price levels, profit-taking tends to accelerate the downside. Furthermore, this compounding dynamic — rate pressure layered on top of pre-existing overextension — explains why gold's intraday decline appeared more forceful than the data alone might have justified.
Analytical Note: Experienced metals traders often watch for precisely this setup: a metal that has rallied sharply into a data release becomes vulnerable not just to the data itself, but to the cascade of position unwinding that follows when the data disappoints the prevailing trade.
For a broader view of how these dynamics are unfolding, the precious metals market analysis for 2025 provides additional context on the forces shaping both metals simultaneously.
Why the Same Data Lifted Silver: Unpacking the Second Engine
Silver absorbed the identical rate headwind that weighed on gold and still rose approximately 1.8% on the session. That detail is analytically significant because it isolates the variable responsible for the divergence: industrial demand.
The Industrial Demand Channels Gold Cannot Access
A manufacturing index registering its highest reading in more than five years, combined with a six-month business outlook at levels not seen since 1983, constitutes a direct forward demand signal for silver across multiple industrial sectors:
- Solar photovoltaic manufacturing: Silver paste is an irreplaceable component in solar panel production. Silver is screen-printed onto silicon wafers to form the electrical contacts that collect and transport electrons. As solar installation rates grow globally, silver consumption in this segment has become one of the largest and fastest-expanding industrial demand categories.
- Electronics and semiconductors: Silver's electrical conductivity is the highest of any element. It is used extensively in circuit boards, semiconductor packaging, multilayer ceramic capacitors, and high-frequency connectors. Factory expansion directly correlates with increased consumption of silver in these applications.
- Electrical contacts and conductors: Industrial infrastructure investment requires large volumes of silver-based electrical contacts, which are used in switches, relays, and circuit breakers across manufacturing, energy, and transportation sectors.
- Automotive electrification: Each battery-electric vehicle contains significantly more silver than a conventional internal combustion vehicle, particularly in power management and charging systems.
When the Philadelphia Fed's forward-orders component strengthened alongside the headline reading, the implication for silver was not just a one-month demand spike but potentially sustained industrial consumption growth across multiple quarters.
Speculative Positioning: The Pre-Existing Tailwind
CFTC Commitments of Traders data published on August 11, 2026 showed silver net long contracts at 23,646, up from 22,280 the prior week (Commodity Futures Trading Commission, Commitments of Traders, August 11, 2026). This positioning snapshot predates the August 20 data release, which means speculative interest in silver was already building before the industrial demand catalyst arrived. When bullish positioning is already accumulating and a strong fundamental catalyst then materialises, the resulting price move tends to be amplified beyond what either factor alone would produce.
The Bifurcated Economy: When Factories Expand and Households Tighten
The August 20 session offered a more nuanced economic picture than simple across-the-board strength. Walmart reported earnings on the same morning that beat revenue expectations and prompted the retailer to nudge its full-year sales outlook slightly higher. However, U.S. comparable sales growth came in at just 2.6%, well below the analyst consensus of 3.8% and described as the first such miss in at least five years.
Store traffic growth slowed to 1.5% from 3% in the prior quarter, and Walmart's CFO specifically noted that fuel prices above $4 per gallon represented the threshold where shoppers begin making material spending trade-offs (Reuters, August 20, 2026).
This combination — strong factory surveys alongside consumer spending strain — describes a bifurcated economy where industrial strength coexists with household budget pressure. For silver, this environment is actually constructive: industrial demand holds firm regardless of whether consumer sentiment is deteriorating, because the demand is driven by production activity rather than retail spending.
For gold, the same bifurcation creates ambiguity: the manufacturing strength constrains rate-cut expectations, while the consumer weakness introduces the possibility of eventual economic softening that could, in a later cycle, benefit gold's safe-haven appeal. Consequently, understanding central bank gold demand becomes equally important when assessing gold's longer-term price trajectory during such complex economic conditions.
The next major ASX story will hit our subscribers first
The Gold-Silver Ratio as a Relative Value Diagnostic
Understanding the Ratio
The gold-silver ratio analysis expresses how many ounces of silver are required to purchase a single ounce of gold. As of August 20, 2026, the ratio sat near 66, above its 50-year historical average of approximately 60. A ratio above the long-run average means silver is historically inexpensive relative to gold on a comparative basis.
When the ratio compresses — meaning silver outperforms gold — it frequently signals a shift toward risk appetite, economic optimism, and industrial demand acceleration. The August 20 divergence trade represented precisely this dynamic playing out in real time. For additional context, gold-silver ratio analysis offers further insight into what these ratio movements mean for investors navigating both metals.
When Do These Divergences Typically Occur?
Precious metals divergences most commonly emerge during mid-cycle economic expansions — the phase when manufacturing activity is accelerating but monetary policy has not yet pivoted decisively toward easing. In this environment:
- Gold faces rate headwinds that suppress its monetary appeal.
- Silver benefits from the same economic expansion that creates those headwinds.
- The gold-silver ratio compresses as silver temporarily outperforms.
- Speculative positioning in silver tends to build ahead of and during these periods.
Investors who track the ratio as a relative value indicator can use divergence sessions as a real-time diagnostic tool for broader macroeconomic conditions and prevailing market sentiment. Furthermore, examining silver versus gold performance across historical patterns reveals just how consistently these divergence cycles have repeated over time.
| Macro Variable | Gold Sensitivity | Silver Sensitivity |
|---|---|---|
| Rising real interest rates | High negative | Moderate negative |
| Stronger U.S. dollar | High negative | Moderate negative |
| Manufacturing expansion | Minimal positive | Strong positive |
| Rate cut expectations | High positive | Moderate positive |
| Speculative positioning | Moderate | High (thinner market) |
| Industrial supply constraints | Minimal | Significant |
Portfolio Logic: Why Owning Both Metals Is Structurally Different From Owning Two of Either
The events of August 20, 2026 illustrate a portfolio construction principle that is frequently overlooked in mainstream investment commentary. Gold and silver are not merely two versions of the same asset. They carry different demand drivers that only partially overlap, which means their price movements are not perfectly correlated and do not always weaken simultaneously for the same reason.
Portfolio Principle: In sessions where economic strength suppresses gold but lifts silver, a dual-metal position partially self-hedges. The metals' different demand architectures mean their price drivers only partially overlap. This is structurally distinct from holding two assets with identical sensitivities, where both positions decline together under the same macro conditions.
Gold provides a hedge against monetary debasement, rate-cut cycles, currency weakness, and systemic financial stress. Silver provides exposure to both those monetary conditions and the global industrial economy simultaneously. Together, they occupy different segments of the risk spectrum rather than the same one. For additional perspective on why gold and silver prices can experience sharp moves in either direction, BlackRock's analysis of gold and silver price volatility provides a well-researched institutional viewpoint.
FAQ: Why Is Gold Down and Silver Up?
Why do gold and silver sometimes move in opposite directions?
Gold's price is driven almost entirely by monetary factors, particularly real interest rates, U.S. dollar strength, and rate expectations. Silver shares those monetary sensitivities but carries an additional industrial demand channel. When economic data generates a strong industrial demand signal, silver can rise even as gold falls under rate pressure.
Does rising silver always mean the economy is healthy?
Not necessarily. Silver can also rise during monetary easing cycles, safe-haven demand episodes, or periods of physical supply constraint. However, when silver specifically outperforms gold during a session of strong manufacturing data, the industrial demand channel is typically the primary driver of that outperformance.
What is the gold-silver ratio and why does it matter?
The gold-silver ratio expresses how many ounces of silver are required to purchase one ounce of gold. A ratio near 66, above the 50-year historical average of approximately 60, suggests silver remains relatively undervalued compared to gold on a long-run historical basis. Investors use the ratio to assess the relative positioning between the two metals and to gauge broader market sentiment.
What economic indicators most directly affect silver prices?
- Regional and national manufacturing surveys (such as the Philadelphia Fed Manufacturing Index and the ISM PMI).
- Industrial production data published by the Federal Reserve.
- Solar energy installation rates and semiconductor industry output.
- CFTC Commitments of Traders positioning data for managed money and speculative participants.
- Real interest rates and the U.S. dollar index (DXY).
- Automotive production volumes, particularly battery-electric vehicle output.
Should I own gold, silver, or both?
Gold functions primarily as a monetary hedge. Silver functions as both a monetary hedge and an industrial commodity. Holding both creates exposure to different demand drivers, reducing the risk that a single macro variable simultaneously suppresses the entire precious metals allocation. For investors weighing up these options, Pearler's guide to surging precious metals prices offers a useful accessible overview of what drives price movements in both metals. This is not financial advice. Consult a qualified financial professional before making any investment decisions.
Key Takeaways: The Dual-Engine Framework
- Gold is a single-engine asset, governed almost entirely by real interest rates, dollar strength, and monetary policy expectations, making it directly vulnerable when strong economic data pushes yields higher.
- Silver is a dual-engine asset, carrying both monetary sensitivities and an industrial demand channel that can override monetary headwinds when factory activity accelerates sufficiently.
- The August 2026 divergence was mechanical, not random: the Philadelphia Fed Manufacturing Index reached 47.4 against a consensus of 25, its highest level since April 2021, while the six-month business outlook hit 73.6, its strongest reading since August 1983.
- Treasury yields responded immediately: the 10-year rose approximately 5 basis points to ~4.70% and the 30-year moved toward 5.25%, widening gold's opportunity cost disadvantage (CNBC, August 20, 2026).
- Silver net long contracts totalled 23,646 as of August 11, 2026 (CFTC), meaning speculative positioning was already constructive before the industrial demand catalyst arrived.
- The gold-silver ratio near 66, above its 50-year average of approximately 60, indicates silver remains historically undervalued relative to gold.
- Owning both metals provides internal portfolio diversification because their price drivers only partially overlap — a structural distinction that played out visibly on the same day, helping investors understand precisely why is gold down and silver up in these specific economic conditions.
Disclaimer: This article is for informational and educational purposes only and does not constitute financial or investment advice. All data referenced is sourced from publicly available reports. Past performance is not indicative of future results. Always consult a qualified financial adviser before making investment decisions.
Want to Stay Ahead of the Next Major Mineral Discovery on the ASX?
Discovery Alert's proprietary Discovery IQ model delivers real-time alerts on significant ASX mineral discoveries, instantly translating complex data across more than 30 commodities into clear, actionable insights for both short-term traders and long-term investors — explore historic discoveries that generated extraordinary returns, then begin your 14-day free trial to position yourself ahead of the broader market.