June 12, 2026
Understanding Advanced Supply Chain Dynamics in Modern Petroleum Markets
The intricate mechanics of petroleum supply chains represent far more than simple inventory accounting. At its core, the system functions as a complex network where storage capacity limitations, transportation bottlenecks, and quality specifications create operational realities that amplify market movements beyond traditional supply-demand calculations. Furthermore, the recent U.S. crude oil inventory decrease has highlighted these complex dynamics in action.
Modern petroleum infrastructure operates under technical constraints that most market participants overlook. Tank farms across the United States maintain specific capacity thresholds, with major distribution hubs like Cushing, Oklahoma functioning at utilisation rates that create artificial scarcity during peak demand periods. When commercial crude oil stockpiles reach 423.8 million barrels, as documented in recent Energy Information Administration reports, the absolute number tells only part of the operational story.
The petroleum industry's response to inventory fluctuations involves sophisticated coordination mechanisms that extend beyond simple production adjustments. Refinery operators must balance crude input specifications against product yield requirements whilst considering transportation logistics and storage constraints simultaneously.
When big ASX news breaks, our subscribers know first
How Strategic Petroleum Reserve Operations Shape Market Dynamics
The Strategic Petroleum Reserve system represents a 714 million barrel capacity distributed across four salt dome cavern facilities in Louisiana and Texas. These installations at Bryan Mound, Big Hill, West Hackberry, and Bayou Choctaw operate under technical specifications that require careful quality matching between stored crude and refinery intake requirements.
Historical context reveals the unprecedented nature of recent SPR operations. During 2022, the United States conducted the largest Strategic Petroleum Reserve drawdown in the system's five-decade history, releasing approximately 180 million barrels to address global supply disruptions. This massive release operation required complex logistical coordination involving multiple pipeline systems and refinery scheduling adjustments.
Strategic Reserve Release Operational Framework:
| Release Stage | Technical Requirements | Timeline |
|---|---|---|
| Authorisation Phase | Presidential approval and congressional notification | 1-3 days |
| Quality Assessment | Crude grade compatibility with refinery specifications | 3-5 days |
| Transportation Coordination | Pipeline scheduling and tanker allocation | 5-10 days |
| Distribution Implementation | Refinery intake scheduling and inventory integration | 10-30 days |
The operational complexity of SPR releases extends beyond simple valve opening. Stored crude oil must undergo quality verification to ensure compatibility with modern refinery configurations. Complex refineries can process heavier crude grades more efficiently than simple refineries, creating differentiated demand patterns that influence release strategies.
Technical Infrastructure and Quality Management
Strategic Petroleum Reserve facilities utilise advanced monitoring systems for pressure maintenance, leak detection, and crude oil quality preservation. Salt dome storage provides natural insulation against temperature fluctuations whilst maintaining crude oil specifications over extended periods.
The technical challenge involves matching SPR crude quality with refinery intake requirements. Reserve inventory consists primarily of medium and heavy grades suitable for Gulf Coast refinery configurations, but distribution to refineries with different crude slate requirements necessitates careful planning and potential quality adjustments.
Operational Factors Driving Weekly Petroleum Inventory Fluctuations
Weekly petroleum inventory movements reflect the cumulative outcome of thousands of operational decisions across the entire supply chain. Recent data showing a U.S. crude oil inventory decrease of 2.3 million barrels during the week ending January 24, 2026, illustrates the complexity of these interactions.
The discrepancy between American Petroleum Institute data showing a 247,000 barrel decline and Energy Information Administration data reporting 2.3 million barrels demonstrates the methodological challenges in petroleum measurement. API data captures secondary market reporting whilst EIA comprehensive surveys include direct refinery reporting, creating regular variations in weekly announcements.
Key Weekly Movement Drivers:
- Refinery Utilisation Changes: 1-5 million barrel weekly impact potential
- Import Flow Variations: 2-8 million barrel weekly swing range
- Domestic Production Adjustments: 0.5-3 million barrel typical variation
- Strategic Release Operations: 5-30 million barrel impact during active periods
Refinery Operational Response Mechanisms
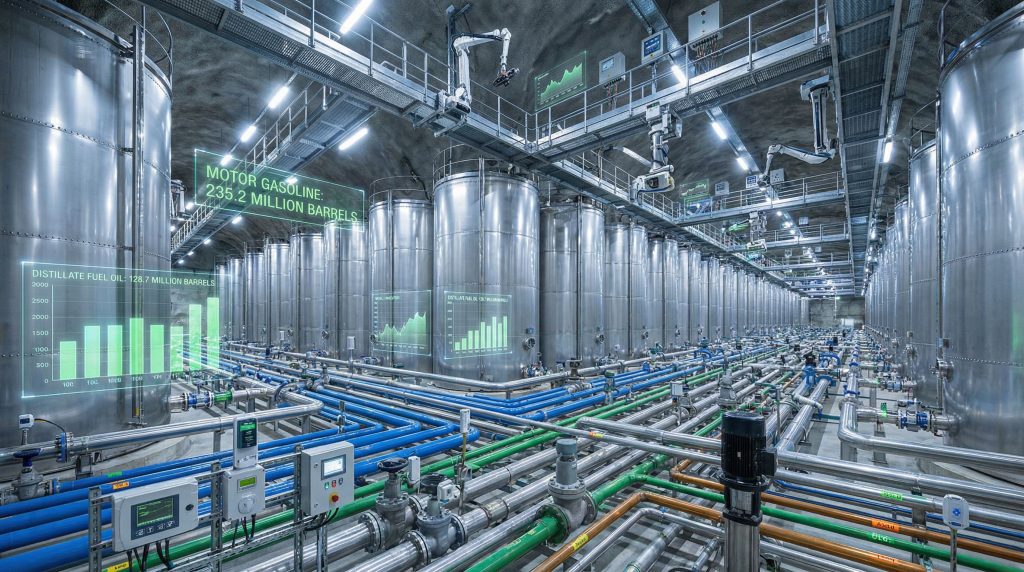
Motor gasoline production averaged 9.6 million barrels daily during the recent reporting period, whilst middle distillate production decreased by 268,000 barrels daily to 4.8 million barrels daily. These production rate adjustments reflect refinery operators responding to inventory signals and seasonal demand patterns.
The sequential gasoline inventory pattern reveals typical post-holiday market dynamics. A 6 million barrel gasoline inventory build in the week prior to January 24, followed by a more modest 200,000 barrel increase, demonstrates refinery production rate adjustments following peak holiday driving season demand collapse. Additionally, the oil price rally has influenced these operational decisions.
Refinery maintenance scheduling typically follows seasonal patterns, with substantial turnarounds occurring in spring and fall, creating predictable inventory movement patterns that require contextual interpretation rather than reactive market responses.
Import Timing and Transportation Dynamics
Crude oil import patterns display episodic characteristics based on tanker scheduling and international price differential calculations. A single crude oil tanker carrying 2-3 million barrels can create measurable weekly import variations independent of underlying demand changes.
Pipeline capacity constraints amplify inventory movements at critical distribution points. When Cushing, Oklahoma pipeline utilisation approaches maximum throughput capacity, inventory accumulation or depletion patterns become exaggerated regardless of broader market supply-demand conditions. However, easing tariff pressures have somewhat stabilised these dynamics.
Weather-Related Supply Chain Disruptions and Market Impact
Extreme weather events function as supply-side disruption mechanisms that create discrepancies between expected seasonal inventory patterns and actual market conditions. Recent winter storm impacts contributed to the documented 2.3 million barrel inventory draw, with market participants interpreting these disruptions as structural rather than temporary supply reductions.
Weather Impact Transmission Mechanisms:
- Production Shutdown Protocols: Extreme temperature events force temporary cessation of drilling operations
- Pipeline Flow Restrictions: Crude oil reaching cloud point temperatures creates transportation impediments
- Refinery Operational Adjustments: Cold weather increases heating fuel demand whilst reducing gasoline processing priorities
- Strategic Reserve Utilisation: Emergency release requests compensate for temporary supply disruptions
Production Infrastructure Vulnerability
Gulf of Mexico crude oil production experiences 10-25% reductions during major hurricane passages through Category 4-5 storm systems, potentially affecting 1-2 million barrels daily during peak disruption periods. Onshore production regions including the Permian Basin, Eagle Ford Shale, and Bakken formations can experience 0.5-2 million barrel daily output reductions during multi-day freeze events.
The operational response cascades through petroleum supply chains as production shutdowns create inventory drawdowns whilst refineries attempt to maintain processing rates. Downstream refineries may reduce heating fuel production whilst continuing gasoline output at scheduled rates, creating seemingly contradictory inventory signals that require technical analysis for proper interpretation. US crude oil inventories have shown significant volatility due to these factors.
Price Volatility and Market Psychology
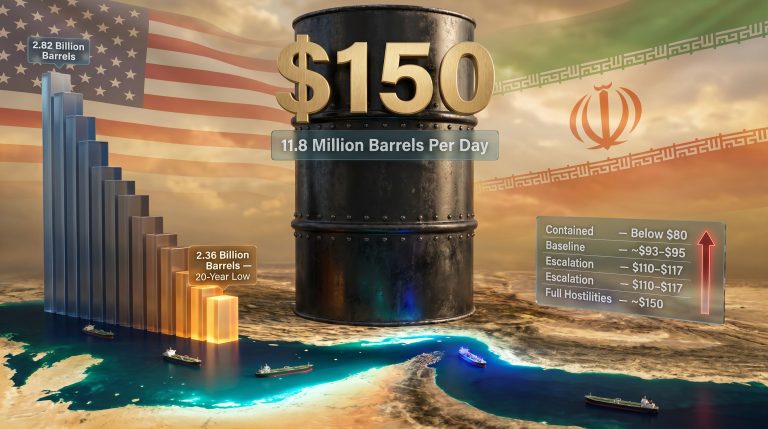
Recent price movements showing Brent crude at $68.11 per barrel (up 0.80% daily) and WTI crude at $63.00 per barrel (up 0.98% daily) reflect market participants repricing supply disruption expectations. The $3+ week-over-week Brent price increase demonstrates accumulating supply concerns as winter storm impacts became quantifiable through production reporting.
Market commentary referencing "geopolitical risk premiums continuing to deteriorate" illustrates the challenge of distinguishing temporary weather disruptions from structural supply reductions. Professional traders develop strategies considering not merely absolute inventory levels but operational context behind inventory movements. The tariff impact on markets has further complicated these assessments.
Refined Product Inventory Relationships and Demand Indicators
The operational relationship between crude oil inventories and refined product stockpiles creates feedback loops influencing overall petroleum demand patterns. Motor gasoline inventories maintained 200,000 barrel increases following earlier significant builds, whilst middle distillate inventories showed 300,000 barrel increases despite production reductions.
Refined Product Demand Metrics (Four-Week Averages):
| Product Category | Current Demand | Year-Over-Year Change | Market Significance |
|---|---|---|---|
| Motor Gasoline | 8.3 million barrels daily | Stable seasonal pattern | Primary crude demand driver |
| Middle Distillates | 3.7 million barrels daily | -4.8% year-over-year | Weather-sensitive heating demand |
| Total Products Supplied | 20.3 million barrels daily | -0.1% year-over-year | Economic activity indicator |
Seasonal Demand Pattern Analysis
The 4.8% year-over-year distillate demand decline reflects comparative winter warmth in 2025-26 relative to 2024-25, evidenced by reduced heating oil consumption. This seasonal variation illustrates why inventory interpretation requires weather normalisation and historical context rather than simple week-to-week comparisons.
Refinery operators adjust product slate configurations based on seasonal demand shifts. Cold weather increases space heating requirements, shifting production yields toward heating oil and distillate output at the expense of gasoline and other products. The net effect on total petroleum demand varies by event severity and geographic scope. Consequently, US economy tariffs have added another layer of complexity to these patterns.
Advanced Technical Indicators and Market Signal Interpretation
Professional energy market analysis employs sophisticated methodologies that account for multiple operational variables when interpreting inventory data. These analytical frameworks consider refinery maintenance schedules, pipeline capacity utilisation rates, and seasonal demand pattern adjustments to identify genuine market signals versus operational noise.
Critical Technical Metrics:
- Days of Supply Coverage: Inventory levels relative to consumption rate calculations
- Seasonal Adjustment Factors: Historical pattern normalisation for predictable variations
- Regional Distribution Analysis: Geographic inventory concentration and transportation constraints
- Quality Grade Differentiation: Light versus heavy crude inventory composition analysis
Predictive Modelling Applications
Advanced forecasting systems integrate real-time operational data with historical pattern analysis to predict inventory movements. These models consider refinery capacity utilisation rates across different regions, pipeline flow data indicating transportation bottlenecks, international crude price differentials affecting import decisions, and weather forecasting models predicting demand variations.
The divergence between API and EIA reporting methodologies provides additional analytical insight. API data reflects secondary market transactions whilst EIA comprehensive surveys capture direct refinery and terminal operator reporting, creating complementary perspectives on petroleum supply chain dynamics. For instance, recent oil price stagnation has been reflected differently across these reporting systems.
The next major ASX story will hit our subscribers first
Strategic Investment Implications and Market Participant Responses
Energy sector investment strategies utilise inventory data as fundamental analysis components for evaluating upstream producers, midstream pipeline operators, downstream refineries, and integrated energy companies. Inventory trends influence production planning, capital allocation decisions, margin expectations, and strategic positioning across the energy value chain.
Investment Decision Framework:
- Immediate Price Impact Assessment: Quantifying short-term volatility expectations based on inventory surprises
- Operational Context Analysis: Understanding underlying causes of inventory changes for sustainability evaluation
- Forward Curve Implications: Adjusting longer-term price forecasts based on inventory trend analysis
- Risk Management Adjustments: Modifying position sizes based on inventory-driven volatility patterns
Trading Strategy Development
Professional energy traders develop sophisticated approaches based on inventory data interpretation that consider operational context alongside absolute inventory levels. These strategies evaluate refinery operational rates, pipeline transportation schedules, import timing decisions, and seasonal demand pattern expectations.
The coordination between commercial inventory management and Strategic Petroleum Reserve operations creates layered market dynamics. When commercial stockpiles decline below five-year seasonal averages, policymakers face strategic decisions regarding SPR utilisation that influence both immediate market pricing and longer-term supply security considerations.
Technology Integration and Future Infrastructure Development
The petroleum industry continues advancing toward automated inventory management systems providing real-time operational visibility across the supply chain. These technological developments integrate Internet of Things sensor networks for continuous tank level monitoring, predictive analytics utilising artificial intelligence for demand forecasting, supply chain optimisation through automated logistics coordination, and quality management systems enabling real-time crude oil specification tracking.
Environmental and Regulatory Evolution
Environmental regulations increasingly influence inventory management strategies through emissions monitoring requirements, enhanced safety protocols including leak detection systems, renewable fuel integration affecting blending operations, and Strategic Petroleum Reserve infrastructure modernisation for operational efficiency improvements.
Modern regulatory frameworks require petroleum facility operators to maintain sophisticated environmental monitoring whilst optimising operational efficiency. These dual requirements create technical challenges that influence inventory management decisions and infrastructure investment priorities.
Market Structure Evolution and Strategic Considerations
The technical complexity of U.S. crude oil inventory management reflects the sophisticated nature of modern energy markets where operational expertise, technological integration, and strategic planning determine competitive advantages. Understanding operational factors behind the U.S. crude oil inventory decrease provides critical insights for market participants ranging from individual investors to multinational energy corporations.
Successful navigation of petroleum markets requires appreciation for technical infrastructure limitations, operational constraint impacts, and strategic considerations driving inventory dynamics. As energy markets continue evolving toward greater technological sophistication and environmental compliance requirements, the importance of technical operational analysis in investment decision-making will expand significantly.
The integration of traditional petroleum infrastructure with emerging technologies creates opportunities for improved operational efficiency whilst maintaining supply chain resilience. Market participants who develop technical expertise in inventory management mechanics, quality specification requirements, and transportation logistics will maintain competitive advantages in increasingly complex energy markets.
Looking for Investment Opportunities in Energy Markets?
Discovery Alert's proprietary Discovery IQ model provides real-time alerts on significant ASX mineral discoveries across energy-related commodities, instantly empowering subscribers to identify actionable opportunities ahead of the broader market. Begin your 14-day free trial today and secure your market-leading advantage in the rapidly evolving resources sector.