July 25, 2026
When Geopolitics Rewrites the Oil Price Rulebook
Energy markets have always been sensitive to political friction, but there is a meaningful difference between routine tension and the kind of structural dislocation that forces analysts to rebuild their pricing models from scratch. The Persian Gulf in mid-2026 is producing the latter. What is unfolding is not simply a spike in geopolitical noise but a fundamental repricing of supply risk across one of the most consequential energy corridors on the planet.
Understanding why the Rystad oil price $150 Iran conflict scenario has entered serious analytical discussion requires stepping back from the headlines and examining the underlying mechanics of how oil markets absorb, price, and ultimately misread geopolitical risk. The geopolitical oil price analysis emerging from this environment is unlike anything seen in the modern era.
When big ASX news breaks, our subscribers know first
The Strait of Hormuz: A Chokepoint That Defines Global Energy Security
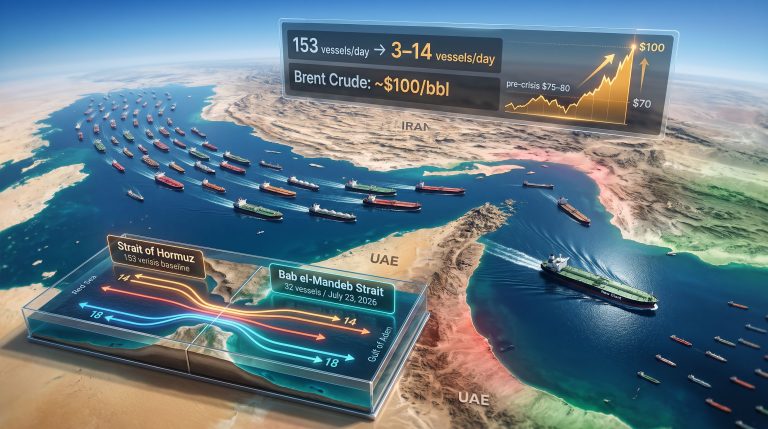
The Strait of Hormuz is not merely a geographic feature. It is the single most critical energy transit corridor in the world, responsible for channelling crude oil and liquefied natural gas from six major Gulf producers to global import markets. Under normal operating conditions, approximately 135 ships transit the strait every single day, carrying volumes that underpin everything from European diesel prices to Asian petrochemical feedstocks.
When that corridor faces disruption, the consequences are not linear. The interdependency of global supply chains means that even partial closures create disproportionate market reactions, as buyers scramble to reroute cargoes, storage assets fill rapidly, and the forward curve for oil futures reprices across months and years simultaneously.
What makes the current environment particularly difficult to model is that markets are not dealing with a straightforward closure scenario. The operative question is whether transit volumes can recover even partially, and the answer from crowd-sourced probability markets is deeply sobering.
According to Polymarket data highlighted by SEB Chief Commodities Analyst Bjarne Schieldrop, there is currently only a 27% probability that the Strait of Hormuz will see 60 or more daily ship transits for even one continuous week by July 31, 2026. To put that in context: 60 ships per day represents less than half of normal throughput, and the threshold does not even require that recovery to be sustained beyond seven days.
The market is not pricing a catastrophe. It is pricing the near-impossibility of even a minimal, temporary return to functionality within the near term.
This distinction matters enormously for investors trying to position around the conflict. The uncertainty is not about whether the worst case happens. It is about whether even a modest improvement in conditions is achievable on any meaningful timeline.
What the Rystad $150 Oil Price Scenario Actually Requires
The Rystad oil price $150 Iran conflict forecast has generated considerable attention, but it is frequently mischaracterised in market commentary. Rystad Energy warns that the $150 per barrel figure represents a conditional escalation scenario, not a base-case projection, as senior vice president and head of geopolitical analysis Jorge Leon has been explicit in stating. The trigger condition is a full resumption of U.S.-Iran hostilities, not a contained episode of military friction.
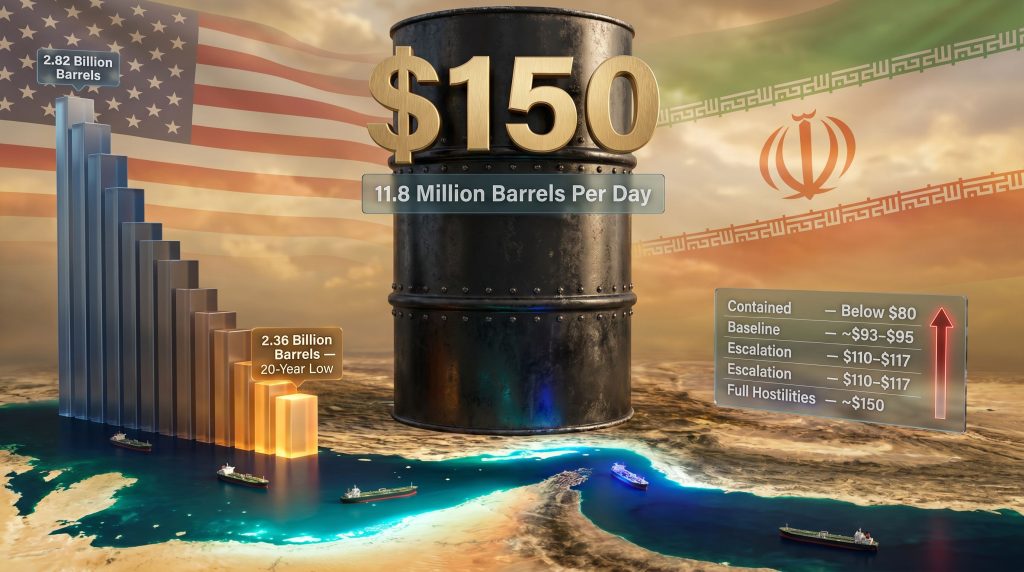
The supply disruption that would accompany such a scenario is staggering in its scale. Approximately 11.8 million barrels per day of production across six Gulf-region producers would be effectively removed from global markets under a sustained Hormuz closure. That figure rivals the most severe supply shocks in the history of the modern oil industry.
The scenario spectrum, as currently modelled, spans an extraordinary range:
| Scenario | Brent Price Outlook | Key Condition |
|---|---|---|
| Conflict contained | Below $80/bbl | Diplomacy holds; supply impact minimal |
| Current mid-2026 baseline | ~$93-$95/bbl | Partial disruption; ceasefire uncertain |
| Escalation intensifies | $110-$117/bbl | OECD inventory drawdown accelerates sharply |
| Full resumption of hostilities | Toward $150/bbl | Hormuz remains effectively closed |
The nearly $70 per barrel spread between the containment and full escalation outcomes is itself a critical market signal. It reflects not just uncertainty about the conflict's trajectory but deep uncertainty about Iran's internal political dynamics, which remain largely opaque to external observers, including Western intelligence services and market participants alike.
Leon has noted that determining whether the current escalation represents a full resumption of hostilities or a dangerous but still containable episode remains premature at this stage, and that the next few days will be decisive in establishing which direction the conflict is moving.
The Inventory Crisis That Outlasts the Headlines
Perhaps the most underappreciated dimension of the current oil market shock is the inventory damage being silently accumulated while diplomatic attention focuses on ceasefire prospects and deal probabilities.
Research from Enverus Intelligence Research (EIR) provides the most granular picture of this dynamic. EIR's balance modelling indicates that OECD crude and product inventories were at approximately 2.82 billion barrels at year-end 2025 and are projected to trough at 2.36 billion barrels in Q4 2026. EIR characterises this drawdown as an unprecedented 20-year low in global inventory levels.
The significance of this projection cannot be overstated. Inventory levels are not merely a lagging indicator of supply disruption. They are a structural determinant of forward price floors. Historically, inventory troughs at levels comparable to those being modelled correlate with sustained price strength, regardless of whether the underlying geopolitical catalyst has been resolved.
EIR director Al Salazar has articulated this concept through the idea of a structural inventory stock hole, noting that the inventory deficit can outlast the headline event that created it, and that even if diplomacy advances, stocks are projected to bottom at levels that historically correlate with stronger prices. Furthermore, Salazar flagged that the crisis is likely to leave behind a more durable geopolitical risk premium that does not fully unwind even after flows normalise. The geopolitical risk landscape affecting energy commodities has rarely been this consequential.
Under EIR's base case:
- Brent averages $110 per barrel across the second half of 2026
- Prices peak near $117 per barrel in Q4 2026
- Brent remains above $100 per barrel until at least Q3 2027
- Year-end 2027 settlement is projected only in the mid-$90s as supply normalisation and inventory rebuilding gradually take hold
A successful ceasefire agreement does not reset inventory levels. The structural price floor has been permanently elevated for what may be 12 to 18 months beyond any diplomatic resolution.
How Opposing Forces Are Creating Lateral Price Action
Brent crude's behaviour in the immediate trading sessions around these developments tells a revealing story about how competing market forces are cancelling each other out. On the day of the most recent Rystad update, Brent traded in a range of $90.77 to $95.00 per barrel, closing up 1.8% at $93.10 per barrel. The following morning saw intraday highs of $95.50 per barrel, but bullish momentum failed to hold, with prices settling around $93.50 per barrel.
The brief dip below $90 per barrel on the preceding Tuesday serves as a useful reference point for sentiment. It represented a moment when diplomatic optimism temporarily overwhelmed supply disruption fear, only to be rapidly reversed as the escalation picture darkened.
Why Is Oil Swinging Laterally Rather Than Trending?
Naeem Aslam, CIO at Zaye Capital Markets, has identified the mechanism driving this oscillatory price behaviour. Presidential commentary from the United States is simultaneously feeding two opposing market forces: statements emphasising strike risk push prices higher by amplifying supply disruption fears, while assertions about U.S. military support for oil transit through Hormuz provide a partial ceiling on panic-driven buying.
Aslam has characterised this dynamic as the primary reason oil is swinging laterally rather than establishing a directional trend. When geopolitical risk simultaneously generates both upside and downside price pressures, volatility becomes the dominant market characteristic rather than directionality. In addition, the oil price trade war impact layered on top of these tensions is further complicating the directional picture.
In environments like this, traders are not making directional bets on an outcome. They are constructing hedges against a probability distribution of outcomes. Volatility itself becomes the asset being priced.
The Diplomatic Probability Collapse and What It Signals
Rystad's prior assessment of deal probability in the weeks before the latest escalation stood at approximately 40%. That figure has now materially narrowed, with the direction of travel described as significantly more uncertain than it was only weeks ago.
The collapse in probability is not simply a function of rhetoric. SEB's Schieldrop has noted that genuinely understanding what is occurring inside Iran and within the U.S.-Iran negotiation architecture is extraordinarily difficult, even for seasoned geopolitical analysts. Iran's internal political dynamics, factional competition between hardliners and pragmatists, and the institutional role of the Revolutionary Guards in decision-making all introduce layers of opacity that market models struggle to adequately capture.
For diplomacy to regain traction, several conditions would need to converge:
- A credible third-party mediation framework capable of providing both sides with face-saving off-ramps
- Internal Iranian consensus around the terms of any agreement, which requires navigating significant factional divisions
- U.S. willingness to delink nuclear programme demands from immediate ceasefire conditions
- Verified mechanisms for monitoring Hormuz transit resumption that both sides can accept
None of these conditions appear to be in place at present, which explains why the Polymarket probability figure sits at such a remarkably low threshold.
The next major ASX story will hit our subscribers first
Second-Order Effects: Beyond the Crude Price Headline
A sustained $100-plus oil environment carries consequences that extend well beyond the energy sector. The inflationary transmission mechanisms from elevated crude prices touch transport costs, petrochemical manufacturing, agricultural production, and food supply chains. Central banks in major economies would consequently face a particularly difficult policy environment, confronting inflationary pressure from energy costs at a time when growth may already be softening.
Historical analogies are instructive but imperfect. The 1973 oil embargo and the 1979 Iranian Revolution both generated structural oil price shocks with multi-year economic consequences. The key differences today include a much larger global oil market, greater geographic diversity of production, and more sophisticated financial hedging mechanisms. However, the concentration of supply through a single geographic chokepoint remains a vulnerability that has not been structurally resolved since those earlier crises.
Emerging market economies with high oil import dependency face particularly acute exposure. Currency depreciation pressure, widening fiscal deficits from fuel subsidy costs, and imported inflation all compound in an environment where dollar-denominated crude prices remain elevated. The global LNG supply outlook is similarly under pressure, as buyers scramble for alternative sources amid Hormuz uncertainty.
How Does OPEC Factor Into This Crisis?
OPEC market influence is being tested in a fundamentally new way by this crisis. The cartel's ability to offset Gulf supply disruptions is constrained by the fact that several of its most significant members are themselves located within the disruption zone, limiting the conventional stabilisation mechanisms that OPEC has deployed in previous supply shocks.
There is also a paradox embedded in the energy transition dimension of this crisis. Short-term oil price spikes simultaneously accelerate investment in alternatives while generating the cash flows that fund those very same investments. The long-term structural outcome may ultimately prove more favourable for energy diversification than the immediate economic pain would suggest.
Frequently Asked Questions: Rystad Oil Price Forecast and the Iran Conflict
What is Rystad Energy's oil price forecast if Iran conflict escalates?
Rystad Energy has modelled a scenario in which Brent crude could move toward $150 per barrel if U.S.-Iran hostilities fully resume and Strait of Hormuz disruptions persist at scale. As reported by CNBC, this is a conditional worst-case scenario estimate, not a base-case projection.
What is the current Brent crude price amid U.S.-Iran tensions?
At the time of the latest market updates, Brent was trading in the $93 to $95 per barrel range, having briefly tested levels above $95.50 and below $90 within the same trading week, reflecting the volatile two-force dynamic driving price action.
What happens to oil prices if the Strait of Hormuz remains closed?
A sustained closure would remove approximately 11.8 million barrels per day of Gulf producer output from global markets, driving OECD inventories to a projected 20-year low of 2.36 billion barrels by Q4 2026, with Brent supported above $100 per barrel through at least mid-2027.
What is the probability of a U.S.-Iran deal in 2026?
Market-based probability models currently assign approximately a 27% chance that the Strait of Hormuz will see even minimal partial reopening by July 31, 2026, down significantly from prior assessments of approximately 40% deal probability in preceding weeks.
Could oil prices fall back below $80 despite current tensions?
Yes. Rystad's scenario modelling explicitly includes a sub-$80 per barrel outcome if the conflict remains contained and diplomatic channels stabilise. The extraordinary price range across scenarios reflects the binary nature of the current geopolitical risk environment.
Key Takeaways for Energy Market Participants
- The Rystad oil price $150 Iran conflict scenario represents a scenario boundary, not a consensus forecast, but the conditions capable of triggering it are not implausible given current trajectory
- The more immediate structural concern is the inventory drawdown trajectory, which creates a durable price floor that outlasts any eventual diplomatic resolution
- Oil price volatility is structurally elevated and unlikely to compress meaningfully until ceasefire durability and Hormuz transit normalisation can be independently verified
- A geopolitical risk premium is being repriced into energy markets with implications that extend well beyond 2026, potentially establishing a new structural floor for crude through 2027
- Investors should treat the $70 per barrel spread between containment and full escalation scenarios as the defining characteristic of current market risk, not any single price point
This article is intended for informational purposes only and does not constitute financial advice. All price forecasts, scenario estimates, and probability assessments referenced herein are drawn from third-party analyst modelling and are subject to significant uncertainty. Readers should conduct their own research before making any investment decisions.
Want To Stay Ahead Of Major Commodity Market Shifts?
Discovery Alert's proprietary Discovery IQ model delivers real-time alerts on significant ASX mineral discoveries, transforming complex market data into actionable investment insights — explore the historic returns major discoveries have generated and begin your 14-day free trial at Discovery Alert to position yourself ahead of the next major market move.