July 25, 2026
The Geometry of Scarcity: Why Strait of Hormuz Vessel Transits Define the Global Oil Price Floor
Few economic variables carry the geopolitical weight of a single maritime corridor. The Strait of Hormuz, a narrow sliver of water separating the Arabian Peninsula from Iran, has long functioned as the central nervous system of global crude oil supply. Understanding how Strait of Hormuz vessel transits behave during periods of escalation — and what the data actually reveals beneath the surface noise — is no longer a concern limited to shipping analysts or naval strategists. It is now fundamental to anyone tracking energy markets, commodity price formation, or macroeconomic stability across Asia, Europe, and beyond.
When big ASX news breaks, our subscribers know first
Why the Strait's Narrowness Amplifies Its Strategic Power
The Strait of Hormuz is approximately 21 miles wide at its most constrained navigable point, yet it facilitates the movement of roughly 20 to 21 percent of all globally traded oil. Under stable operating conditions, this translates to an estimated 17 to 20 million barrels of oil equivalent passing through the corridor every single day, alongside substantial volumes of liquefied natural gas (LNG) originating primarily from Qatar, the world's largest LNG exporter.
What makes this chokepoint uniquely irreplaceable is the absence of scalable alternatives. Saudi Arabia, Iraq, Iran, Kuwait, the UAE, and Qatar all depend on this single maritime exit for the bulk of their crude exports. The East-West Petroline, which runs across Saudi Arabia to Red Sea terminals, carries a maximum capacity of approximately 5 million barrels per day. The UAE's Abu Dhabi Crude Oil Pipeline (ADCOP) adds roughly 1.5 million barrels per day of bypass capacity via Fujairah.
Combined, these two pipelines can substitute for less than 35 percent of normal Hormuz throughput, a structural vulnerability that has persisted despite decades of geopolitical awareness and infrastructure planning. Furthermore, the global LNG supply outlook compounds this challenge considerably.
LNG export infrastructure faces an even more acute bypass challenge. Unlike crude oil, which can in theory be redirected through pipeline networks, LNG requires purpose-built liquefaction terminals and specialised marine terminals that simply do not exist in sufficient numbers outside the Gulf corridor.
Reading the Data: What Current Strait of Hormuz Vessel Transit Numbers Actually Signal
The Measurement Gap Problem
Interpreting Strait of Hormuz vessel transit data during periods of active conflict requires understanding a systematic measurement problem that most market commentary glosses over. The Automatic Identification System (AIS), which forms the backbone of commercial vessel tracking platforms, relies on transponders that vessels are legally required to operate. In practice, however, vessels operating near conflict zones frequently disable their AIS equipment to reduce targeting risk.
This creates a structural floor effect in reported transit data: published figures during active disruption periods almost certainly undercount actual movement, sometimes significantly. Analysts who treat reported transit volumes as accurate totals rather than minimums risk systematically overestimating the degree of supply disruption.
The implication for market participants is significant. When a tracking platform reports three daily transits, the true figure may be higher, though the directional signal — that traffic has fallen dramatically from the normal baseline — remains valid and meaningful. Live monitoring tools such as Hormuz Strait Monitor can provide useful real-time context when assessing these conditions.
How Different Platforms Produce Different Numbers
The table below illustrates how data methodology drives radically different reported transit volumes for the same time period:
| Data Source | Reported Daily Transits | Measurement Methodology | Operational Classification |
|---|---|---|---|
| AIS-only live tracker | Near zero | Active AIS signal detection only | Effectively closed |
| Kpler composite data | 3 per day (July 22–24, 2026) | Satellite imagery + AIS fusion | Severely restricted |
| Bloomberg/Yahoo Finance | ~13 ships (multi-day window) | Vessel position reporting composite | Selectively operational |
| CNBC/U.S. Central Command | ~14 ships, ~8.5M barrels (single day) | Military surveillance + commercial data | Open but heavily constrained |
| Pre-crisis industry baseline | ~153 vessels per day | Historical AIS aggregate | Normal operations |
The divergence between signal-only trackers reporting near-zero activity and military-verified data showing 14 vessels is not a contradiction. It reflects the reality that vessels deactivating AIS transponders become invisible to commercial platforms while remaining physically present in the waterway.
The Three-Vessel Story: July 22–24, 2026
According to data from Kpler shiptracking analytics, Strait of Hormuz vessel transits held at precisely three per day across three consecutive days from July 22 to July 24, 2026, a period during which oil prices surged back to $100 per barrel amid ongoing regional military escalation.
The composition of those transits reveals as much as the volume:
- VLCC New Giant exited the strait carrying approximately 2 million barrels of Iraqi Basrah crude, scheduled to arrive at China's Rizhao port by mid-August. This represents a direct data point confirming that Chinese crude procurement continued despite elevated risk.
- VLCC Romania Prosperity was observed holding position off Fujairah carrying Murban crude of UAE origin, with its destination unconfirmed at the time of reporting. This pattern, known informally in shipping circles as an anchorage hold, is consistent with operators awaiting market clarity on security conditions and insurance terms before committing to a transit or destination.
- Empty VLCC Noble entered the Persian Gulf through the strait on July 24. This is arguably the most analytically significant data point of the three: an empty inbound supertanker signals that an operator calculated that the commercial opportunity of loading a crude cargo inside the Gulf outweighed the risk of a return transit. Empty inbound movements are therefore a forward-looking indicator of expected export continuity.
Empty VLCC inbound transits during a disruption event function as a market confidence signal. If operators truly believed the strait would close indefinitely, positioning an empty vessel inside the Gulf would represent an irrational and costly gamble. The presence of Noble suggests the commercial calculus remains tilted toward expected resumption of normal operations.
Fujairah: The Understated Pivot Point of Persian Gulf Shipping
Fujairah occupies a geographic position that makes it indispensable during Hormuz disruption events. Located on the UAE's eastern coastline just outside the strait itself, it serves as the primary tanker staging hub, bunkering centre, and crude blending location for vessels operating in the region.
During elevated risk periods, laden VLCCs frequently anchor in Fujairah's offshore anchorage zone while operators assess three simultaneous variables:
- Real-time security intelligence on strait passage conditions
- War risk insurance premium quotes for the specific transit window
- Delivered price differentials at the destination port versus the cost of holding and waiting
The appearance of Romania Prosperity anchored off Fujairah with Murban crude aboard is therefore not simply a curiosity. It is a visible manifestation of the market's uncertainty premium being priced into the physical logistics chain in real time. Indeed, the oil trade and geopolitics dimension of these logistics decisions has rarely been more consequential.
Bab el-Mandeb: The Second Chokepoint Compounding the Crisis
Why Simultaneous Disruptions at Two Chokepoints Create Non-Linear Stress
The Bab el-Mandeb Strait, separating Yemen from Djibouti at the southern mouth of the Red Sea, normally functions as the primary alternative routing pathway for vessels seeking to bypass Hormuz exposure. Under normal conditions, a vessel departing the Persian Gulf can transit the Strait of Hormuz, traverse the Arabian Sea, pass through Bab el-Mandeb, enter the Red Sea, and reach Europe or Asia via the Suez Canal.
When both chokepoints experience simultaneous disruption, this standard routing architecture collapses. The only remaining alternative is a full Cape of Good Hope circumnavigation, which fundamentally reshapes the economics of every cargo moving between the Middle East and its primary import markets.
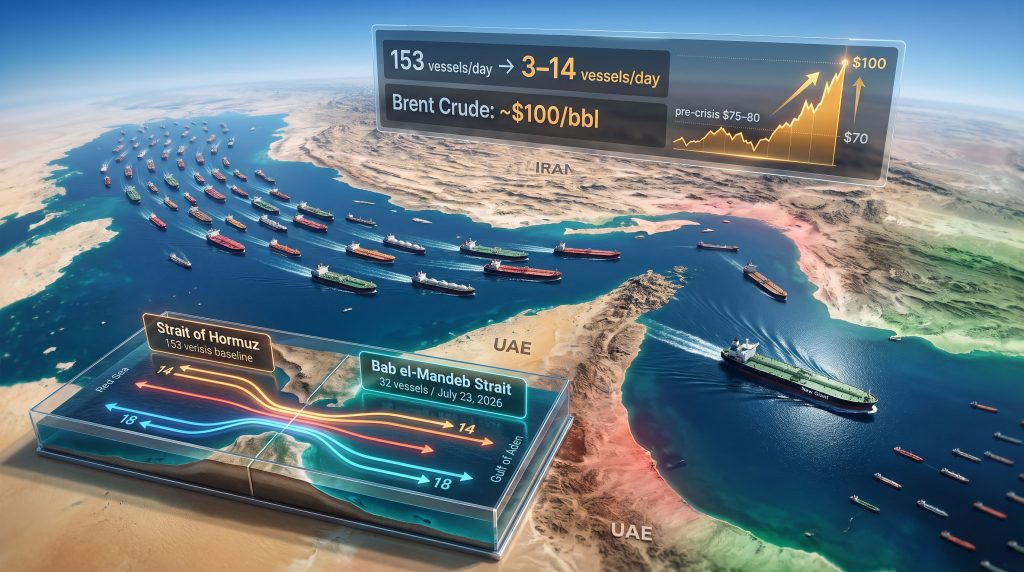
On July 23, 2026, Kpler data showed 32 commodity vessel crossings at Bab el-Mandeb, up from 26 the previous day. The directional breakdown was:
- 14 vessels transiting northbound into the Red Sea
- 18 vessels exiting southbound into the Gulf of Aden
- 9 of the 18 southbound vessels were carrying crude oil cargo
- 2 of the crude-carrying vessels were Chinese-flagged supertankers bound for Chinese ports
The concentration of Chinese-flagged crude carriers continuing to operate through Bab el-Mandeb during a period of elevated regional risk reflects a well-documented pattern: Chinese shipping operators and their state-backed counterparties have demonstrated consistently higher risk tolerance than their Western counterparts when securing Middle Eastern crude supply. This is partly a function of commercial necessity given China's scale of Gulf dependence, and partly a reflection of the different insurance and liability frameworks under which Chinese-flagged vessels operate.
The Torm Innovation Reroute: Quantifying the Cost of Caution
The clean tanker Torm Innovation, carrying approximately 500,000 barrels of naphtha bound for Asia, altered course toward the Suez Canal exit rather than the conventional Bab el-Mandeb routing, according to data from both Kpler and LSEG shiptracking. Rerouting via Suez rather than Bab el-Mandeb extends voyage duration by a factor of nearly three, according to regional trade sources cited by Reuters.
The financial implications of this rerouting cascade across multiple cost categories:
| Cost Component | Impact of ~3x Voyage Extension |
|---|---|
| Bunker fuel consumption | Proportionally higher absolute fuel burn |
| Charter hire cost | Extended daily hire rate periods |
| Crew costs | Additional sea days incur additional costs |
| Cargo financing cost | Delayed delivery extends working capital tie-up |
| Port demurrage risk | Missed delivery windows create secondary costs |
These are not marginal adjustments. For a 500,000-barrel naphtha cargo, the cost differential between a standard Bab el-Mandeb routing and a Suez Canal alternative can translate to multiple dollars per barrel of delivered cost, which ultimately transmits into downstream product pricing for consumers.
Saudi Aramco's Mediterranean Pivot
One of the more strategically significant operational adaptations to emerge from the current disruption is Saudi Aramco's activation of additional crude cargo loading at Sidi Kerir, Egypt's Mediterranean port. Sidi Kerir is the Mediterranean terminus of the Sumed Pipeline, a 320-kilometre crude oil pipeline connecting the Red Sea port of Ain Sukhna to the Mediterranean.
By loading crude at Sidi Kerir, Aramco effectively decouples a portion of its export capacity from both Bab el-Mandeb transit risk and Hormuz transit risk simultaneously. For buyers in Europe and the Mediterranean basin, this routing offers a supply line that requires no transit through either active disruption zone.
The significance of this operational shift should not be underestimated. When a producer of Aramco's scale and commercial conservatism restructures its loading operations in response to a security environment, it communicates a judgement that the disruption is not a transient spike but a sustained condition requiring structural adaptation.
Oil Price Dynamics and the $100 Threshold
Current crude oil prices reclaimed the $100 per barrel level during the period under analysis, a psychologically and technically significant marker that triggers a distinct set of market behaviours. The mechanism connecting Strait of Hormuz vessel transit compression to price formation operates through several channels simultaneously:
- Physical supply signal: Reduced verified transit volumes communicate potential tightening in near-term delivered crude availability, particularly for Asian buyers whose cargoes originate in the Gulf.
- Speculative positioning acceleration: Futures markets respond to perceived supply risk faster than physical markets. When transit data confirms restricted throughput, speculative long positions in Brent and WTI accumulate rapidly, amplifying the initial price move.
- War risk premium transmission: Elevated insurance premiums make delivered crude more expensive even for volumes that do successfully transit, widening the effective price spread between Gulf-origin crude and alternative supply sources.
- Inventory draw expectations: Markets anticipate accelerated drawdowns of strategic petroleum reserves and commercial inventories, which further tightens the forward curve structure.
If Hormuz transits were to remain suppressed at the 3 to 14 vessel range for an extended period against the 153-vessel baseline, the theoretical daily supply shortfall could approach 14 to 17 million barrels. To put this in context, the largest coordinated OPEC production cut in recent history amounted to approximately 10 million barrels per day during the pandemic period. A sustained Hormuz supply shock of this magnitude would dwarf any voluntary production adjustment mechanism available to consuming nations.
However, it is worth noting that OPEC's market influence and its ability to respond to such shocks remains a critical variable in how price dynamics ultimately resolve.
Disclaimer: The scenario analysis and price projections contained in this article represent analytical frameworks based on historical precedents and current data. They do not constitute financial advice. Energy market conditions are subject to rapid change based on geopolitical, military, and diplomatic developments that are inherently unpredictable.
The next major ASX story will hit our subscribers first
Scenario Pathways: Three Trajectories for Global Energy Markets
Scenario 1: Rapid Normalisation Within 60 to 90 Days
Under this pathway, diplomatic or military resolution reduces active threat levels sufficiently for transit volumes to recover toward 80 to 100 vessels per day within two months. Oil prices retreat from the $100 level toward an $80 to $85 range as the supply risk premium deflates. Shipping operators absorb elevated war risk insurance costs as temporary operating expenses, and no permanent infrastructure changes are required or implemented.
Scenario 2: Extended Partial Disruption Over 6 to 18 Months
Strait of Hormuz vessel transits stabilise at 30 to 50 percent of the pre-crisis baseline, supporting a sustained $90 to $110 crude price range with elevated volatility. This scenario would likely accelerate investment in the Saudi East-West Petroline expansion and optimisation of ADCOP utilisation rates. Furthermore, Qatar would face pressure to explore alternative LNG export routing options, though viable alternatives are structurally limited.
Asian importers would consequently accelerate crude diversification strategies toward non-Gulf supply sources. The trade war impact on oil markets could further complicate this diversification effort by reshaping commercial relationships between key buyers and alternative suppliers.
Scenario 3: Prolonged Near-Closure Lasting 18 Months or More
Daily transits remain below 20 vessels for an extended period. Brent crude price discovery above $120 to $150 per barrel triggers emergency activation of International Energy Agency (IEA) strategic petroleum reserves across member nations. Cape of Good Hope rerouting becomes the default pathway for a material portion of Asian crude imports.
Critically, the global tanker fleet is not currently configured for mass Cape of Good Hope rerouting. Industry analysts estimate that a sustained Hormuz closure would require an increase of roughly 15 to 25 percent in effective tanker demand simply to maintain equivalent cargo delivery volumes on extended routing. Shipbuilders would require an estimated 18 to 36 months to address this gap through new vessel construction, meaning that even if political conditions resolved, the physical shipping infrastructure deficit would create supply chain friction lasting well beyond the geopolitical event itself.
The Structural Investment Case: Beyond the Crisis Window
Pipeline Bypass Infrastructure: The 35 Percent Gap That Persists
The current disruption has once again exposed a long-standing strategic failure: despite decades of awareness about Hormuz vulnerability, the combined bypass pipeline infrastructure covers less than 35 percent of normal throughput capacity. The investment economics of expanding Petroline capacity and optimising ADCOP utilisation have always been understood. The political and commercial inertia preventing that investment reflects a collective assumption that full closure was a tail risk rather than a realistic scenario.
That assumption is being tested.
Asian Importer Vulnerability: A Structural Dependency Problem
The acute vulnerability of Japan and South Korea deserves particular attention. Both economies operate with near-total dependence on Gulf crude imports, limited domestic production, and constrained strategic reserve capacity relative to consumption rates. China's scale of strategic petroleum reserve deployment provides a meaningful buffer, but even Beijing's reserves are calibrated for disruptions measured in weeks, not months.
India's crude import diversification strategy, which has accelerated engagement with West African and Americas-origin crude over the past several years, offers a partial template for reducing chokepoint concentration risk. However, the infrastructure investment required to fully substitute Gulf-origin crude with alternative suppliers at scale is measured in years and tens of billions of dollars, not months.
The Hormuz crisis, if sustained, may ultimately do more to accelerate global crude supply diversification than any policy framework or voluntary commercial agreement achieved over the preceding two decades.
Key Metrics at a Glance: Hormuz and Bab el-Mandeb Crisis Snapshot
| Metric | Pre-Crisis Baseline | Crisis Period Reading | Scale of Disruption |
|---|---|---|---|
| Hormuz daily vessel transits | ~153 vessels/day | 3–14 vessels/day | ~90–98% reduction |
| Hormuz daily oil throughput | ~17–20M bbl/day | Severely constrained | Structural supply risk |
| Bab el-Mandeb daily transits | ~60–80 vessels/day (est.) | 32 vessels/day (July 23) | ~50–60% reduction |
| Brent crude price | ~$75–80/bbl pre-crisis | ~$100/bbl | +25–33% increase |
| Voyage extension (Bab el-Mandeb reroute) | Standard routing | ~3x longer via Suez | Major freight cost uplift |
| U.S. military strike sequence | N/A | 13 consecutive nights | Sustained escalation |
| Bypass pipeline capacity (combined) | N/A | Less than 35% of normal Hormuz flow | Critical structural gap |
In addition, vessel tracking platforms such as Tanker Map's Hormuz analytics provide a useful layer of independent verification when cross-referencing these figures against real-time movement data.
All figures are based on publicly available shiptracking data, Reuters reporting, and Kpler analytics as of late July 2026. Transit volumes should be interpreted as floor estimates given AIS deactivation in conflict-adjacent environments.
Want to Know Which ASX Discoveries Could Benefit From Energy Market Volatility?
When geopolitical shocks reshape global commodity markets at this scale, identifying the right resource opportunities ahead of the broader market becomes critical — Discovery Alert's proprietary Discovery IQ model delivers real-time alerts on significant ASX mineral discoveries, instantly translating complex data into actionable insights for both short-term traders and long-term investors. Explore historic examples of major discovery returns and begin your 14-day free trial today to ensure you're positioned before the market moves.