
June 20, 2026
When Geography Becomes Destiny: Alberta's Wildfire Risk and the Oil Sands Supply Chain
Alberta wildfires threaten oil sands production in ways that are both immediate and structurally embedded in the region's geography. Every major energy-producing region carries a vulnerability unique to its geology. For the Gulf of Mexico, it is hurricanes. For the Strait of Hormuz, it is geopolitical chokepoints. For Alberta's oil sands, the recurring threat is something both ancient and accelerating: wildfire. The boreal forest blanketing northern Alberta is one of the most fire-prone ecosystems on the planet, and the industrial infrastructure built within it is increasingly exposed to the consequences of that reality.
When big ASX news breaks, our subscribers know first
Why In-Situ Operations Face Disproportionate Wildfire Exposure
The Alberta oil sands are broadly divided into two extraction categories: open-pit surface mining and in-situ thermal recovery. While both face fire-season risks, the wildfire exposure profile of each is strikingly different, and this distinction is rarely discussed in mainstream energy coverage.
Open-pit mining operations, concentrated near Fort McMurray, involve large cleared areas and significant industrial infrastructure that creates natural firebreaks. In-situ operations, by contrast, use Steam-Assisted Gravity Drainage (SAGD) technology, which involves drilling pairs of horizontal wells deep into bitumen-bearing formations and injecting steam to reduce viscosity and allow oil to flow to surface.
These facilities are scattered across heavily forested terrain, with well pads, steam generation plants, pipelines, and worker camps distributed across the boreal landscape rather than consolidated on a single cleared site.
Why Distributed Operations Increase Risk
This distributed model means that in-situ operations cannot rely on the same passive fire buffer that surface mining creates. The Lac la Biche region, which hosts many of Alberta's largest SAGD operations, exemplifies this vulnerability. With six out-of-control fires burning simultaneously in the area — the largest exceeding 1,000 hectares (approximately 2,471 acres) — multiple major facilities find themselves within 11 to 19 kilometres of active fire perimeters.
Furthermore, according to NASA's Earth Observatory, fires near Alberta's oil sands have shown increasing intensity in recent seasons, reinforcing concerns about long-term structural exposure.
The physics of SAGD also introduce a lesser-discussed hazard: high-pressure steam infrastructure is particularly sensitive to fire-related damage, meaning that even a moderate fire encroachment can require extended shutdown and inspection protocols before safe restart is possible.
The Scale of What Is Actually at Risk
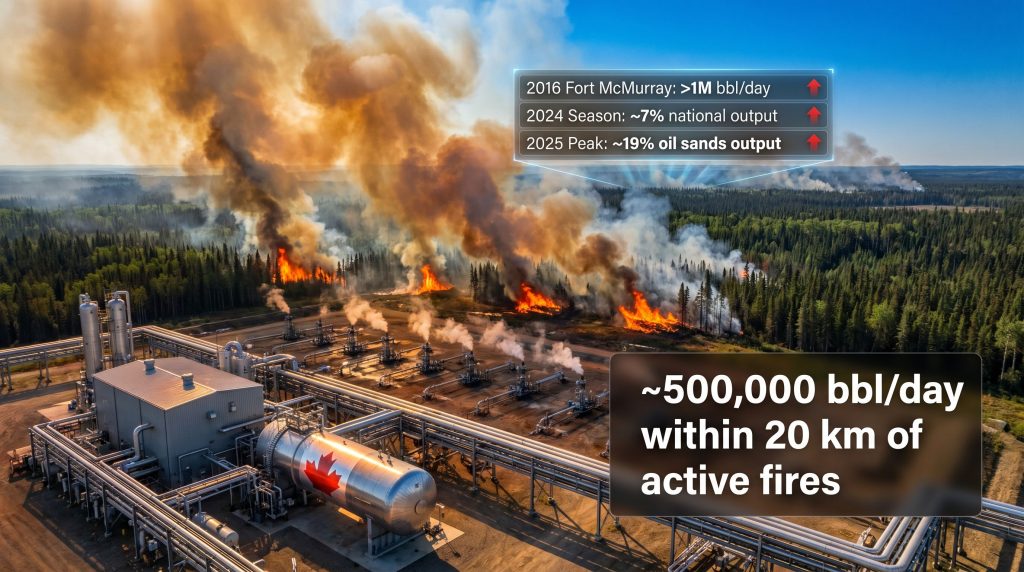
The production volumes concentrated within the current fire zone are substantial. Facilities within 20 kilometres of active fire perimeters collectively represent approximately 500,000 barrels per day of crude output. To put that figure in context, it is roughly equivalent to the total daily oil production of several mid-sized OPEC member nations.
The major operators directly affected include some of the most significant names in Canadian upstream energy:
| Operator | Facility | Proximity to Active Fires | Approximate Impact |
|---|---|---|---|
| Cenovus Energy | Christina Lake | Within risk corridor | ~238,000 bbl/day shut-in at peak |
| Canadian Natural Resources (CNRL) | Jackfish 1 and Kirby North | 11–19 km from active fires | Non-essential personnel evacuated |
| ConocoPhillips | Surmont | 11–19 km from active fires | Within monitored risk zone |
| MEG Energy | Christina Lake | Within risk corridor | Personnel evacuation, restart delayed |
| Harvest Operations Corp. | Multiple sites | Within 20 km corridor | Operational risk flagged |
At the peak of the 2025 disruption, the collective shutdown represented approximately 19% of total Alberta oil sands output and roughly 8% of Canada's national crude production. For a country ranked as the world's fourth-largest oil producer, with the overwhelming majority of that output flowing south to US refineries, these are figures with supply chain implications extending well beyond provincial borders.
Historical Benchmarks: What Past Fire Seasons Reveal
Contextualising the current disruption against historical precedents is essential for calibrating both the severity of the immediate threat and the longer-term risk trajectory.
The 2016 Fort McMurray wildfire remains the defining reference event. At its peak, that fire eliminated more than one million barrels per day of production for several weeks, destroyed significant portions of Fort McMurray itself, and created cascading disruptions to the workforce infrastructure that underpins oil sands operations. The 2016 event demonstrated that when fire conditions are severe enough, the damage extends far beyond physical infrastructure.
More recently, wildfires during the 2024 fire season removed approximately 7% of Canada's total oil production at peak disruption. That event reinforced a pattern now clearly visible in the data: fire-season disruptions are not anomalies but recurring features of Alberta's operational calendar.
| Event | Peak Production Loss | Approximate Duration | Primary Mechanism |
|---|---|---|---|
| 2016 Fort McMurray | >1 million bbl/day | Several weeks | Infrastructure destruction, mass evacuation |
| 2024 Fire Season | ~7% of national output | Days to weeks | Precautionary curtailments |
| 2025 Current Event | ~19% of oil sands / ~8% national | Short-term (recovering) | Facility shutdowns, personnel evacuation |
A pattern worth noting: the 2025 disruption, measured as a share of oil sands output, exceeds the 2024 event's proportional impact, even if it remains well short of the absolute scale of 2016. This suggests that fire risk in the Lac la Biche in-situ corridor is intensifying as a proportion of the affected production base.
The Global Price Context: Why Timing Amplifies the Market Signal
Wildfire disruptions do not occur in a vacuum, and the timing of the 2025 fire season adds a layer of market complexity that is difficult to overstate. Monitoring current crude oil prices reveals that global benchmarks have traded above $100 per barrel at various points over the preceding three months.
This was driven in significant part by the curtailment of an estimated 20% of global oil supply from the Middle East as a result of ongoing geopolitical conflict. However, the subsequent oil price rally has added further complexity to how markets are interpreting Canadian supply shocks.
What Market Participants Are Watching
When global supply buffers are already compressed by geopolitical disruption, secondary supply shocks carry amplified market weight. Even a disruption widely expected to be temporary can produce outsized effects on:
- Near-term price volatility in North American crude benchmarks, particularly Western Canadian Select (WCS)
- Forward curve pricing as traders reprice near-term supply risk
- Refinery feedstock planning for US facilities configured to process heavy Alberta crude
- Investor positioning in Canadian energy equities with concentrated oil sands exposure
Understanding the broader oil price impact of simultaneous geopolitical and weather-driven disruptions is increasingly important for energy market participants. Furthermore, analysing crude oil price trends alongside fire-season data reveals a pattern of compounding volatility that is difficult for markets to price accurately in real time.
The interaction between geopolitical supply compression and weather-driven production disruption creates a compounding dynamic that is particularly challenging when the duration of the disruption remains uncertain.
How Operators Actually Respond: The Emergency Protocol Framework
Understanding the operational response to approaching fire fronts helps explain why production losses are often precautionary rather than caused by direct fire damage. The response framework typically follows a structured sequence:
- Real-time monitoring coordination with Alberta Wildfire and the Alberta Energy Regulator (AER) to track fire perimeter movement relative to facility boundaries
- Non-essential personnel evacuation once fire fronts approach within defined risk thresholds, protecting workforce safety before any production decision is made
- Voluntary production curtailment to allow safe shutdown of steam generation, processing, and well control systems without compromising infrastructure integrity
- Facility safeguarding procedures placing all high-pressure and heat-generating systems into controlled shutdown configurations
- Community evacuation coordination with provincial emergency management, as seen with the approximately 229 residents of Conklin receiving evacuation readiness notices
- Regulated restart assessment, requiring operator inspections and AER clearance before production resumes
A technically important but underappreciated point: proximity alone does not automatically trigger shutdown. Fire behaviour is governed by wind speed and direction, relative humidity, fuel moisture content, and topography. Many facilities maintain purpose-built firebreaks, on-site suppression equipment, and trained industrial fire response teams capable of defending infrastructure against moderate fire encroachment.
The next major ASX story will hit our subscribers first
Wildfire Risk as a Financial Disclosure Challenge
Beyond the immediate operational disruption, Alberta wildfires threaten oil sands production economics in ways that are reshaping how institutional capital views the sector. Several interconnected financial risk dimensions are now receiving serious attention.
Physical Climate Risk in ESG Disclosure
The intensification of Alberta's fire seasons is increasingly appearing as a material physical climate risk in financial disclosures prepared by oil sands operators for institutional investors and lenders. As climate-related financial reporting frameworks mature globally, the frequency and severity of wildfire disruptions is becoming a quantifiable liability rather than a force majeure footnote.
Insurance Market Reassessment
Underwriters covering remote industrial assets in northern Alberta are reassessing wildfire exposure models. Repeated high-severity fire seasons create actuarial pressure that can translate into higher premiums, tighter policy terms, or reduced coverage limits for facilities in the highest-risk corridors.
Capital Planning for Resilience
Some operators are directing capital toward enhanced firebreak construction, improved early warning systems, and upgraded emergency response infrastructure. In addition, tracking WTI and Brent futures alongside fire-season developments has become standard practice for energy investors assessing near-term Canadian supply risk. The clustering of major SAGD assets in the Lac la Biche corridor may prompt longer-term structural conversations about whether distributed operational models can reduce systemic fire-season vulnerability.
Frequently Asked Questions
How much of Canada's oil production can Alberta wildfires affect?
At peak disruption during the 2025 fire season, approximately 19% of Alberta oil sands output and around 8% of total Canadian crude production was affected. The 2016 Fort McMurray fires eliminated more than one million barrels per day at their peak.
Which companies face the greatest wildfire exposure in Alberta?
Operators with large SAGD facilities in the Lac la Biche and Fort McMurray corridors carry the highest structural exposure. Cenovus Energy, Canadian Natural Resources, MEG Energy, and ConocoPhillips were among the most significantly affected during the 2025 event.
Why are in-situ oil sands operations more vulnerable to wildfires than open-pit mines?
SAGD and other thermal in-situ operations are distributed across heavily forested terrain without the cleared land buffers that characterise surface mining sites. This dispersed footprint, combined with the sensitivity of high-pressure steam infrastructure to fire damage, creates a more acute vulnerability profile.
Are production disruptions from Alberta wildfires permanent?
In most cases, disruptions are temporary. Facilities are typically restored once fire conditions improve and safety inspections are completed. However, catastrophic events such as 2016 demonstrated the capacity for sustained losses when community and workforce infrastructure is also damaged.
How do Alberta wildfire disruptions affect global crude markets?
Canada's position as the world's fourth-largest oil producer, combined with its role as the primary crude supplier to US refineries, means significant production curtailments can tighten North American supply balances. This effect is particularly pronounced when global supply is already constrained by geopolitical disruption, as is the case during the 2025 fire season.
Disclaimer: This article contains references to production estimates, proximity data, and market conditions based on publicly available information. Forward-looking assessments regarding market pricing, insurance outcomes, and operational resilience are analytical perspectives and should not be construed as investment advice. Production figures and fire-related data are subject to change as conditions evolve.
Want To Stay Ahead of Supply Shocks Driving Energy and Commodity Markets?
Discovery Alert's proprietary Discovery IQ model delivers real-time alerts on significant ASX mineral discoveries, transforming complex geological and market data into actionable investment insights — ensuring subscribers are positioned ahead of the broader market when major resource events unfold. Explore historic examples of exceptional discovery-driven returns and begin a 14-day free trial at Discovery Alert to gain an immediate market-leading edge.