May 15, 2026
When Mergers Actually Work: The Financial Architecture Behind Alkane Resources' Record Quarterly Profit
The mining sector is littered with acquisitions that promised transformational scale but delivered integration headaches, bloated cost bases, and margin dilution. The pattern is so familiar that seasoned resource investors have developed a conditioned scepticism toward merger-driven growth narratives. When a company doubles or triples its asset base through acquisition, the default assumption is that complexity increases faster than cash flow.
That assumption is now being tested in real time by Alkane Resources (ASX: ALK), whose Q3 FY26 result for the March 2026 quarter delivered the strongest financial performance in the company's listed history. The Alkane Resources record quarterly profit of A$93 million net profit after tax, generated on A$274 million of revenue, is not primarily a story about gold prices. It is a case study in what happens when merger mathematics actually compound through the profit and loss statement rather than simply appearing in a management presentation.
Understanding why this quarter looks the way it does requires examining the structural architecture of the business, not just the headline numbers.
When big ASX news breaks, our subscribers know first
From Single-Asset Producer to Multi-Continent Cash Generator
Before August 2025, Alkane Resources operated as a focused single-mine gold producer centred on Tomingley in New South Wales. The investment thesis was straightforward but inherently concentrated: one deposit, one commodity, one jurisdiction. The acquisition of Mandalay Resources, completed in August 2025, fundamentally altered that profile by adding two additional operating mines to the portfolio.
The combined entity now operates:
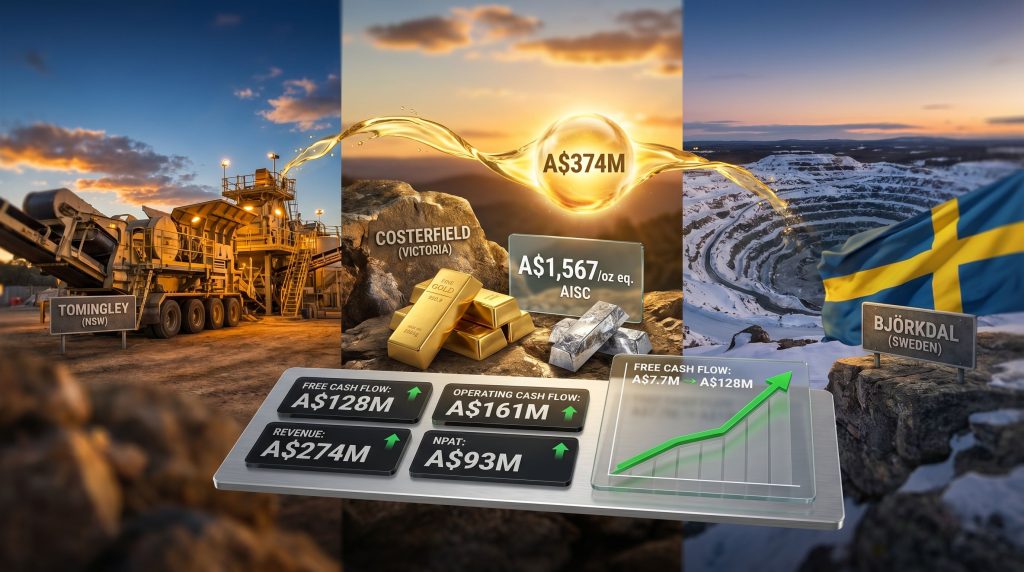
- Tomingley Gold Operations in New South Wales, Australia, functioning as the highest-volume, cost-efficient anchor asset
- Costerfield in Victoria, Australia, a dual-commodity operation producing both gold and antimony
- Björkdal in Sweden, a gold operation with the highest current unit costs but a clearly improving cost trajectory
This structural transition from single-asset producer to three-mine, two-continent, dual-commodity business is not cosmetic. Fixed corporate costs are now spread across a meaningfully larger production base. A single adverse geological quarter at Tomingley no longer threatens the entire quarterly result. Furthermore, antimony revenue at Costerfield provides a commodity diversification layer that is entirely independent of the gold price impact on overall earnings — these are qualitative changes to the risk profile, not just quantitative changes to revenue.
What makes the Q3 FY26 result genuinely instructive is that the merger-derived operating leverage is now visible in hard financial data rather than theoretical projections.
Decoding the Numbers: What the Financial Metrics Actually Reveal
The headline figures from the March 2026 quarter represent a step-change improvement across every meaningful profitability metric:
| Financial Metric | Q3 FY26 (Mar 2026) | Q3 FY25 (Mar 2025) | Year-on-Year Change |
|---|---|---|---|
| Net Profit After Tax | A$93 million | Materially lower | Record high |
| Revenue | A$274 million | Significantly lower | Material increase |
| EBITDA | A$161 million | ~A$29M site op. cash flow | ~+455% |
| Operating Cash Flow | A$161 million | A$29.0 million | ~+455% |
| Free Cash Flow | A$128 million | A$7.7 million | ~+1,562% |
| Cash, Bullion & Investments | A$374 million | A$58.6 million | ~+538% |
The free cash flow expansion from A$7.7 million to A$128 million is the single most important figure in the table. Free cash flow, calculated as operating cash flow less total capital expenditure (A$161 million minus A$46.9 million in Q3 FY26), represents the genuine cash generation capacity of the business after maintaining and growing the asset base. A 1,562% year-on-year improvement at this scale cannot be explained by gold price appreciation alone.
The explanation lies in what analysts refer to as operating leverage: the phenomenon where a fixed cost base, once established, allows incremental revenue to flow disproportionately into profit. Tomingley was already a functional operation with management infrastructure, regulatory relationships, and processing facilities in place. Adding Costerfield and Björkdal on top of that base added production volume and revenue without requiring a proportional increase in corporate overhead.
Key Analytical Point: The year-on-year free cash flow expansion from A$7.7 million to A$128 million reflects the compounding effect of a structurally larger, more diversified production base rather than gold price appreciation. Investors attributing this result solely to the gold price environment are likely underweighting the structural contribution of the Mandalay merger.
The Three-Mine Production Engine: A Mine-by-Mine Analysis
The portfolio produced a combined 45,776 gold equivalent ounces in Q3 FY26, a record for the merged entity. Understanding what each mine contributed, and at what cost, requires examining the assets individually.
| Mine | Q3 FY26 Production | AISC (A$/oz eq.) | Notable Development |
|---|---|---|---|
| Tomingley | 21,652 oz gold | A$2,444/oz | Mobile crusher rental operational; paste plant commissioned 2025 |
| Costerfield | Included in 45,776 oz total | A$1,567/oz eq. | Antimony output: 377 tonnes (up from 267t in Q2) |
| Björkdal | Included in 45,776 oz total | A$3,699/oz | Improved from A$4,117/oz in Q2; still highest-cost asset |
| Portfolio Total | 45,776 oz gold equivalent | A$2,928/oz eq. | Record quarterly gold equivalent output |
Tomingley: The Margin Anchor
Tomingley's Q3 FY26 AISC of A$2,444 per ounce makes it one of the more cost-competitive underground gold operations in the ASX small-cap space. Two operational developments are driving this efficiency.
The paste plant, commissioned in 2025, is a hydraulic backfill system that uses processed tailings mixed with cement to fill mined-out underground voids. This is not merely an environmental compliance measure. Paste backfill allows miners to recover ore pillars that would otherwise be left in the ground for structural stability reasons, effectively increasing mineable ore recovery from the same deposit.
The rented mobile crusher, moreover, represents a pragmatic approach to throughput flexibility. Rather than committing capital to fixed crushing infrastructure, the operational team has retained processing flexibility while managing capital intensity. The fact that Tomingley achieved its production and cost results with a rental arrangement implies the underlying mine economics are genuinely robust, not dependent on capital efficiency shortcuts.
Costerfield: The Dual-Commodity Structural Advantage
Costerfield's consolidated AISC of A$1,567 per gold equivalent ounce is the lowest in the portfolio by a substantial margin, and this is entirely a function of antimony's contribution to the revenue calculation.
Antimony is a metalloid with a relatively narrow set of industrial applications, but those applications include flame retardants, lead-acid battery alloys, semiconductor compounds, and military-grade tracer ammunition. The antimony shortage risks facing Western nations make non-Chinese producers like Costerfield particularly strategically significant. In addition, Costerfield operates in Victoria, Australia, making it one of a very limited number of antimony producers accessible to buyers seeking non-Chinese supply.
The antimony production trajectory over three consecutive quarters tells a compelling operational story:
- Q1 FY26: 124 tonnes produced
- Q2 FY26: 267 tonnes produced
- Q3 FY26: 377 tonnes produced
This sequential ramp-up suggests operational improvement rather than cyclical variation. However, the Q3 realised antimony price of A$34,394 per tonne represented a decline of approximately 19% from the Q2 realised price of A$42,488 per tonne. This price drop is material to Costerfield's economics, and investors modelling Costerfield's forward contributions should treat the Q3 antimony price as a data point rather than a baseline. Understanding the antimony critical mineral dynamics is essential for correctly valuing this asset's contribution.
Risk Note: Costerfield's impressively low AISC of A$1,567/oz gold equivalent is partially a mathematical function of elevated antimony prices. A continued decline in antimony pricing would increase this figure, potentially significantly. The underlying gold operations at Costerfield remain strong, but the reported unit cost metric should be interpreted with this commodity price dependency in mind.
Björkdal: The Cost Reduction Opportunity in Progress
Björkdal is the portfolio's most straightforward story, and also its most important monitoring variable. The Swedish operation's AISC declined from A$4,117 per ounce in Q2 FY26 to A$3,699 per ounce in Q3 FY26, a reduction of A$418 per ounce or approximately 10% quarter-on-quarter. This is directionally positive and, if sustained across multiple quarters, represents meaningful margin accretion at the portfolio level.
The critical context is that Björkdal's cost level remains A$771 per ounce above the consolidated portfolio average. At current gold prices this is manageable, but the sensitivity analysis changes materially if gold prices decline. At a gold price of approximately A$5,800 per ounce, Björkdal would be approaching breakeven on an AISC basis.
The Margin Architecture: Where Profit Is Actually Constructed
The consolidated AISC of A$2,928 per gold equivalent ounce against an average realised gold price of A$6,315 per ounce produces a gross margin per ounce of approximately A$3,387. This is the number that underpins the Alkane Resources record quarterly profit result.
To understand what this means in cash flow terms, consider the full-year guidance range of 160,000 to 175,000 gold equivalent ounces. At the guidance midpoint of approximately 167,500 ounces and the Q3 margin structure:
- Implied gross margin contribution: approximately A$567 million at A$3,387 per ounce
- This is before deducting exploration spend, growth capital, and corporate costs
- Q3 FY26 capital expenditure was A$46.9 million, of which approximately A$10 million was growth-oriented and A$12.5 million was exploration
The stress-test scenario for this margin structure is informative:
| Gold Price Scenario | Estimated Margin/oz (vs A$2,928 AISC) | Björkdal Margin Status |
|---|---|---|
| A$6,315 (Q3 FY26 actual) | ~A$3,387/oz | Positive (~A$616/oz) |
| A$5,800 (-A$515) | ~A$2,872/oz | Positive (~A$101/oz) |
| A$5,300 (-A$1,015) | ~A$2,372/oz | Negative (~-A$399/oz) |
| A$4,800 (-A$1,515) | ~A$1,872/oz | Significantly negative |
The takeaway from this scenario analysis is not that Björkdal is a problem at current prices. However, Björkdal's cost trajectory becomes the critical variable under any realistic gold price downside scenario. Consequently, monitoring the gold price outlook remains essential for investors assessing portfolio-level risk in this three-mine structure.
Balance Sheet Strength as a Competitive Advantage
The cash, bullion, and listed investments position of A$374 million as at 31 March 2026 represents one of the more unusual balance sheets in the ASX small-to-mid-cap mining space. According to Alkane's quarterly report, this comprises A$362 million in cash and bullion plus A$12 million in listed investments, with debt described as effectively negligible.
This position accumulated rapidly. The comparable figure at Q3 FY25 was A$58.6 million, implying that approximately A$315 million of net cash was generated or retained over the twelve-month period following the merger close. The capital expenditure allocation during Q3 FY26 provides a useful lens on how management is deploying this cash:
| Capex Category | Q3 FY26 Spend | Purpose |
|---|---|---|
| Total Capital Expenditure | A$46.9 million | Portfolio-wide sustaining and growth |
| Growth Projects | ~A$10 million | Newell Highway realignment (Tomingley) |
| Exploration | A$12.5 million | Costerfield, Björkdal, Boda-Kaiser (NSW) |
The Newell Highway Realignment: An Infrastructure Prerequisite
The Newell Highway realignment is a piece of enabling infrastructure that receives less analytical attention than the mine operations themselves, but it is a prerequisite for Tomingley's long-term production horizon. Relocating a section of the highway, with completion targeted for the first half of calendar year 2027, unlocks additional ore access at depth and extends the mine's viable operating life beyond its current approved configuration.
For investors modelling Tomingley's contribution to FY28 and FY29 earnings, the highway realignment completion is a binary milestone. Prior to completion, mine planning is constrained; following completion, the mine plan expands and the production profile extends.
Boda-Kaiser: The Longer-Dated Option
The NSW porphyry system at Boda-Kaiser is at scoping study stage and represents a longer-dated exploration and development option rather than a near-term capital requirement. Thorough mining project studies will ultimately determine the viability of bringing this large, bulk-tonnage system into production. With A$161 million per quarter in operating cash flow, Alkane is in the unusual position of being able to advance a major exploration asset at its own pace without needing to access equity markets.
The next major ASX story will hit our subscribers first
What "Gold Equivalent Ounces" Actually Measures (and Where It Can Mislead)
The gold equivalent ounce (GEO) metric is widely used in multi-commodity mining but is often misunderstood by investors outside the sector. The conversion methodology is straightforward: non-gold commodity production is divided by the gold price and multiplied by the commodity's own price to calculate the equivalent number of gold ounces that would generate the same revenue.
For Costerfield, this means antimony tonnes are converted to gold equivalent ounces using the ratio of the antimony price to the gold price at the time of production. When antimony prices are elevated, as they were in Q2 FY26 at A$42,488 per tonne, the GEO conversion is more favourable. When antimony prices decline, as occurred in Q3 FY26 to A$34,394 per tonne, the GEO equivalent of the same physical antimony production decreases.
This creates a subtle but important dynamic: the 45,776 gold equivalent ounce record production figure for Q3 FY26 is partly a function of the commodity price environment at the time of conversion. Investors comparing quarterly GEO production across periods where antimony prices differ materially are not making a strictly apples-to-apples comparison. Furthermore, the broader gold price impact on GEO calculations reinforces why understanding multi-commodity conversion mechanics is essential for accurate analysis.
Forward Outlook: Three Variables That Will Define the Next Two Quarters
The record result reported by Crux Investor establishes a high financial baseline for the Alkane Resources record quarterly profit. Whether the company sustains, improves, or retreats from this baseline over Q4 FY26 and Q1 FY27 will depend on three specific operational variables:
-
Björkdal's cost trajectory: Can the sequential improvement from A$4,117 to A$3,699 per ounce continue? The next meaningful milestone would be approaching the A$3,200 to A$3,400 per ounce range, which would bring Björkdal closer to the portfolio average.
-
Tomingley throughput sustainability: The paste plant and mobile crusher contributed to Q3's strong output. Whether these operational improvements represent a permanent step-change in processing capacity or a temporarily elevated run-rate will become clearer over the next two quarters.
-
Antimony price and Costerfield production rate: The 377-tonne Q3 output represents a substantial increase from prior quarters. Whether this trajectory continues, stabilises, or partially reverses — combined with where antimony prices settle — will determine Costerfield's contribution to consolidated EBITDA.
The full-year FY26 guidance of 160,000 to 175,000 gold equivalent ounces means that Q3 alone (at 45,776 ounces) represents approximately 26% to 29% of the full-year target. This implies the guidance range is achievable and potentially conservative at the top end, assuming no material operational disruptions in Q4.
Investment Framework Reminder: All financial analysis presented in this article is general in nature and does not constitute financial advice. Forecasts, scenario models, and operational projections involve inherent uncertainty. Investors should conduct independent due diligence and consider their personal financial circumstances and risk tolerance before making any investment decisions. Past financial performance does not guarantee future results.
Frequently Asked Questions
What drove the Alkane Resources record quarterly profit in Q3 FY26?
The Alkane Resources record quarterly profit of A$93 million net profit after tax was driven by three converging factors: a record 45,776 gold equivalent ounces produced across three operating mines, a consolidated AISC of A$2,928 per ounce generating approximately A$3,387 per ounce of margin against the A$6,315 per ounce average realised gold price, and the compounding effect of the August 2025 Mandalay Resources acquisition spreading fixed costs across a materially larger production base.
What does AISC mean and why does it matter for gold miners?
All-In Sustaining Cost (AISC) represents the total cash cost required to produce and sustain one ounce of gold production, including operating costs, sustaining capital, and exploration expenditure. It is the most comprehensive cost metric available for gold producers and is far more informative than cash costs alone. Alkane's consolidated AISC of A$2,928 per gold equivalent ounce, measured against a realised gold price of A$6,315 per ounce, demonstrates a margin structure that generates substantial cash flow at current commodity prices.
How much cash does Alkane Resources hold on its balance sheet?
As at 31 March 2026, Alkane Resources held A$374 million in cash, bullion, and listed investments, comprising A$362 million in cash and bullion plus A$12 million in listed investments. This compares to A$58.6 million at the equivalent point in the prior year, reflecting the substantial cash generation of the merged three-mine portfolio over the preceding twelve months.
What is antimony and why does Costerfield's production matter?
Antimony is a metalloid used in flame retardants, battery alloys, semiconductor manufacturing, and defence applications including armour-piercing ammunition and tracer rounds. China dominates global antimony production, making non-Chinese producers strategically significant to Western supply chains. Costerfield in Victoria, Australia consequently operates as one of a small number of meaningful non-Chinese antimony producers, giving it a market position that extends beyond conventional gold mine economics.
What is the Mandalay Resources merger and how has it changed Alkane's financial profile?
The August 2025 acquisition of Mandalay Resources added Costerfield (Victoria) and Björkdal (Sweden) to Alkane's existing Tomingley operation. The structural effect was to convert Alkane from a single-mine, single-commodity producer into a three-mine, two-continent, dual-commodity business. Fixed corporate and operational overhead is now spread across a production base roughly three times larger, creating operating leverage that amplifies the financial benefit of elevated gold prices through the profit and loss statement.
What are the main risks to Alkane Resources' earnings outlook?
Three principal risks warrant monitoring. First, Björkdal's AISC of A$3,699 per ounce means the Swedish operation approaches breakeven at gold prices approximately A$500 to A$600 per ounce below Q3 FY26 realised levels. Second, antimony price volatility at Costerfield could significantly alter the reported AISC and EBITDA contribution from that asset, as demonstrated by the 19% quarter-on-quarter price decline between Q2 and Q3 FY26. Third, execution risk on both the Newell Highway realignment and the ongoing Björkdal cost reduction programme could affect production volumes and cost outcomes over the next two to four quarters.
Want to Identify the Next Major ASX Mining Opportunity Before the Market Does?
Discovery Alert's proprietary Discovery IQ model scans ASX announcements in real time, delivering instant alerts on significant mineral discoveries across gold, antimony, and over 30 other commodities — turning complex data into actionable investment insights the moment they emerge. Start your 14-day free trial today, or explore Discovery Alert's dedicated discoveries page to see how historic ASX mineral finds have generated substantial returns for investors who moved early.