July 22, 2026
Aluminium CBAM First Year Winners: Why Regulatory Design Matters More Than Carbon Intensity in 2026
Carbon policy rarely hits markets in a straight line. In its early stages, regulation often rewards the operators with the best systems, the strongest documentation, and the most flexible commercial structures long before it fully rewards the cleanest physical assets. That is exactly what makes the aluminium CBAM first year winners such a revealing case study for producers, traders, and investors watching Europe's carbon border regime take shape.
The European Union's Carbon Border Adjustment Mechanism, or CBAM, was built to narrow the carbon cost gap between domestic EU industry and foreign suppliers exposed to different policy settings. But aluminium's first full compliance year shows that the mechanism's initial settings do not yet create a simple low-carbon versus high-carbon divide. Instead, Year One advantages flow to suppliers that are structurally favoured by the rules around emissions scope, phase-in, verification, and carbon price deductions.
The central lesson from 2026 is straightforward: the first beneficiaries are not automatically the cleanest aluminium producers. They are the producers whose emissions profile, reporting capability, and market routing options fit the current rulebook best.
This matters because the headline cost looks small today, while the strategic consequences are not. The border charge in 2026 is limited, but the mechanism's escalation path toward 2034 is steep enough to reshape trade flows, investment timing, portfolio allocation, and the economics of primary versus secondary aluminium. Furthermore, the aluminium trade barriers emerging globally are adding another layer of complexity to how producers position their supply chains.
When big ASX news breaks, our subscribers know first
How CBAM Works for Aluminium Imports in 2026
Aluminium importers into the EU now face a compliance structure tied to embedded emissions and the prevailing carbon price under the EU ETS framework. Under the operational timeline, importers above the threshold require authorised declarant status, report embedded emissions, and later surrender CBAM certificates against those emissions. For 2026 imports, the first surrender deadline falls on 30 September 2027, with certificate sales opening from 1 February 2027.
The Four Design Variables That Shape Year One Outcomes
The first year is governed by four critical parameters.
| Design parameter | 2026 setting | Longer-term direction |
|---|---|---|
| Emissions scope | Direct emissions only | Indirect emissions may be added later |
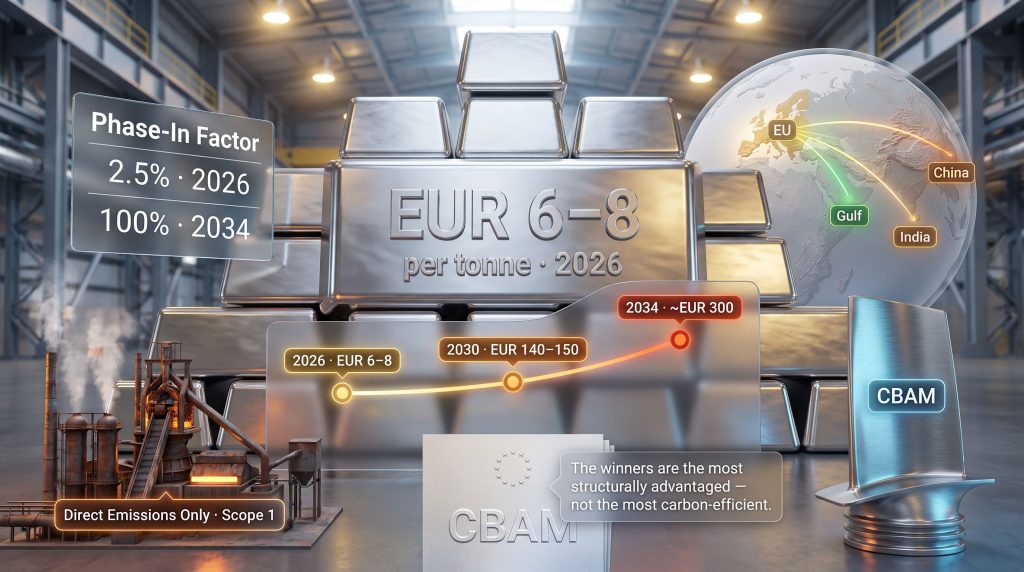
| Phase-in factor | 2.5% | 100% by 2034 |
| Default values for unverified data | 10% above national average | 20% in 2027, 30% from 2028 |
| Carbon price deduction | Home carbon cost can be deducted | Same principle continues |
These settings sound technical, but they determine who pays, who avoids penalties, and who can protect margins.
What Direct Emissions Only Really Means
For primary aluminium, direct emissions broadly include:
- Emissions from anode consumption in smelting
- Perfluorocarbon emissions generated during electrolysis events
- Fuel combustion linked to refining and related plant processes
Crucially, electricity-related emissions are excluded in 2026 because they are treated as indirect emissions rather than direct ones. That exclusion applies even where a smelter uses captive power generation. Under the current regulatory definition, the location or ownership of the power source does not convert those electricity emissions into Scope 1 for CBAM.
This is the defining blind spot in aluminium's first CBAM year, because electricity is often the single largest driver of the metal's total carbon footprint. As noted by Hydro's analysis of CBAM loopholes, these gaps risk enabling greenwashing via the very mechanism designed to reward cleaner production.
Why the 2026 Cost Looks Small but the Trend Does Not
At the quoted Q1 2026 CBAM certificate price of EUR 75.36 per tonne of CO2e, and Q2 at EUR 75.28, the immediate burden on primary aluminium remains limited. With direct emissions for one tonne of aluminium typically in the 3 to 4 tonne CO2e range across the full counted chain, and only 2.5% of that charged in 2026, the effective Year One cost lands at roughly EUR 6 to EUR 8 per tonne.
That is approximately 0.3% of the metal's exchange price, and broadly within the scale of a normal daily move on the LME.
Cost Escalation by Phase-In Year
| Year | Phase-in factor | Estimated CBAM cost per tonne of aluminium at EUR 75/t CO2e |
|---|---|---|
| 2026 | 2.5% | EUR 6 to EUR 8 |
| 2030 | 48.5% | EUR 140 to EUR 150 |
| 2034 | 100% | About EUR 300 |
The key strategic insight is that 2026 is less important as a cost year than as a rehearsal year. The same invoice format expands dramatically as free allocations are phased out and CBAM coverage rises.
For investors and supply-chain planners, the most important number is not the current border charge. It is the slope of the charging curve between 2028 and 2034.
The Structural Paradox: Why High-Carbon Routes Are Not Hit Hardest Yet
The global average carbon footprint for primary aluminium production was about 14.8 tonnes of CO2e per tonne based on International Aluminium Institute 2023 data. Coal-powered production routes can exceed 20 tonnes of CO2e per tonne on a full footprint basis, while best-in-class hydro-powered production can sit near 4 tonnes or below on Scope 1 and 2 style comparisons.
Yet CBAM in 2026 does not capture most of that difference. Because it only counts direct emissions at the border, a coal-heavy smelter and a hydro-based smelter can show broadly similar chargeable emissions even though their total climate impact differs sharply.
Is the Market Signal Currently Inverted?
This creates a counterintuitive result:
- The dirtiest power systems avoid paying for the dirtiest part of their footprint
- The cleanest power systems do not yet receive a meaningful border advantage
- The biggest immediate reward goes to measured emissions, not necessarily lower emissions
Independent market commentary cited in industry analysis suggests that if indirect emissions were included, the average aluminium CBAM bill could rise by roughly six times, with some countries seeing as much as a ninefold increase relative to current obligations. That gap shows how much of aluminium's real emissions profile remains outside the 2026 border lens.
European low-carbon aluminium premiums have also remained limited, with some market assessments placing them in the USD 0 to USD 20 per tonne range in Europe. That is too small to consistently offset the structural weakness low-carbon primary producers face under the initial CBAM configuration. Consequently, the green metals pricing environment continues to frustrate producers who have made genuine capital investments in decarbonisation.
The Aluminium CBAM First Year Winners
1. Coal-Route Producers
The largest Year One regulatory discount goes to coal-linked smelters. This is not because they are efficient or cleaner, but because the electricity-related emissions that distinguish them most clearly are not yet charged at the border.
In effect, the mechanism currently sees only a fraction of their real carbon disadvantage. That makes coal-route producers among the biggest aluminium CBAM first year winners on a purely structural basis.
2. Multi-Asset Producers with Portfolio Flexibility
Large aluminium groups operating multiple smelters across different geographies have another advantage: they can allocate which facility's metal is deemed to serve the EU market. This practice is commonly described as resource shuffling.
In practical terms, it can allow a producer to:
- Assign lower-emission metal to EU shipments on paper
- Keep higher-emission production in other destinations
- Improve declared CBAM performance without fully changing enterprise-wide emissions intensity
European industry stakeholders and European Commission officials have both raised resource shuffling as a major early-stage enforcement concern. The commercial significance is obvious: portfolio optionality becomes a compliance asset.
3. Verified Producers with Strong Carbon Accounting
One of the clearest Year One advantages goes to companies that can measure and verify emissions properly. If a producer cannot provide auditable emissions data, default values apply at 10% above the country average in 2026, rising to 20% in 2027 and 30% from 2028.
That means carbon paperwork creates immediate economic value.
Why the Documentation Edge Matters
- A producer with verified data can avoid inflated default values
- Audit capability can improve realised pricing with EU customers
- Emissions tracking systems may generate faster short-term payback than physical decarbonisation projects
This is one of the more underappreciated mechanics in the current market. In the first few years, compliance infrastructure may deliver margin protection faster than capex-heavy decarbonisation.
Examples of structurally advantaged operators include producers with established third-party verification frameworks, detailed product-level footprint reporting, or mature sustainability accounting systems. That can include hydro-based producers such as Norsk Hydro, as well as recycled aluminium suppliers with robust scrap traceability. Among the top aluminium producers, those that have invested early in carbon measurement systems are finding that advantage compounds quickly under CBAM's default-value penalty structure.
4. Producers in Countries with Domestic Carbon Pricing
CBAM allows importers to deduct a carbon price already paid in the country of origin. That means countries developing or operating carbon pricing systems can preserve part of the carbon rent domestically instead of sending the entire compliance value to the EU border.
Relevant examples include:
- China's ETS, which covers aluminium smelting
- India's Carbon Credit Trading Scheme, which is still developing toward broader practical relevance and potential recognition pathways
Some estimates suggest India's emerging framework could support border deductions of roughly EUR 13 per tonne by 2029. That is not transformative on its own, but it does create a structural edge versus jurisdictions with no domestic carbon pricing mechanism.
By contrast, major Gulf producers currently operating without domestic carbon pricing may face the full future CBAM burden without deductions.
5. Secondary Aluminium and Post-Consumer Scrap Processors
Recycled aluminium is one of the quiet winners in this system. Post-consumer scrap currently sits outside CBAM, creating an important wedge between scrap-based supply chains and primary metal routes.
That matters because recycled aluminium generally has much lower embedded emissions than primary aluminium, especially when measured on an energy basis.
Why Secondary Supply Is Structurally Advantaged
- Post-consumer scrap is outside the current CBAM scope
- Secondary production usually carries much lower energy intensity
- European circularity strategies support demand for traceable recycled content, even without project-specific support claims
From 2028, pre-consumer scrap is expected to enter the mechanism, but the post-consumer advantage is still expected to remain meaningful.
The First-Year Losers
Clean-Energy Primary Producers
Hydropower-based aluminium producers look like natural winners in a carbon border system, but that is not how 2026 works. Their strength sits mainly in electricity emissions, which CBAM is not yet charging for aluminium.
As a result, their border bill can be close to that of far dirtier competitors. Until indirect emissions are included, clean-energy producers may remain commercially under-rewarded relative to their true carbon position. However, operators pursuing low-carbon aluminium operations are positioning themselves for the post-2028 compliance environment where their advantage should become more financially tangible.
Unverified Exporters
The harshest pain point for many suppliers is administrative, not carbon-intensive production itself. Registration, emissions tracking, third-party verification, allocation methods, and customer-facing reporting all create cost and execution risk.
Indian aluminium exports provide a useful market signal here. Industry data cited in sector commentary indicated that Indian exports of unwrought aluminium to the EU were down 41.7% year on year by January 2026. Separate trade analysis suggested exporters may need to concede 15% to 22% price discounts where buyers fear elevated CBAM exposure from unverified emissions data.
Gulf Primary Producers
Gulf aluminium producers remain globally important and often operationally competitive, but under CBAM they face a structural issue if no domestic carbon pricing offset is available. Without a recognised home carbon price, the future border obligation is not reduced. As phase-in percentages rise, that can leave Gulf supply exposed to one of the highest net CBAM charges among major exporting regions.
The next major ASX story will hit our subscribers first
The Carbon-Optimal Supplier That Is Largely Outside the EU Market
One of the clearest contradictions in the current system involves Russian aluminium. From 2027, a full EU import ban applies to Russian primary aluminium for geopolitical reasons rather than carbon performance.
From a carbon-intensity perspective, however, Russian supply has historically included some of the most competitive primary metal available to Europe. Industry disclosures indicate that more than 98% of RUSAL aluminium production has been powered by Siberian hydropower. Its ALLOW brand has been presented with a verified Scope 1 and 2 footprint ceiling of no more than 4 tonnes of CO2e per tonne, against an average around 2.4 tonnes. Its ALLOW INERTA metal, based on inert-anode technology and third-party verification by TÜV Austria, has been cited at approximately 0.01 tonnes of CO2e per tonne.
Why This Exclusion Matters for Carbon Arithmetic
Before the import collapse, Russian aluminium represented about 18% of EU aluminium imports in 2021. By 2023, that had fallen to around 512,000 tonnes, or roughly 8% to 9% of imports.
Research cited in industry analysis suggested that replacing those volumes increased the embedded carbon footprint of EU aluminium imports by roughly:
- 3% when substituted with the cleanest alternative supply
- Around 14% when substituted at world-average carbon intensity
This creates an awkward policy tension. A mechanism designed to reduce import carbon intensity now exists alongside geopolitical restrictions that can push the actual import mix in the opposite direction.
Any scenario involving future re-entry of Russian low-carbon aluminium into Europe remains political and uncertain, not a base-case investment thesis. But from a supply-chain modelling perspective, it is a scenario worth stress-testing because its carbon profile aligns closely with where CBAM may head if indirect emissions gain full weight later this decade.
How the Competitive Map Changes from 2026 to 2034
Three closing forces define the transition window.
1. Scope Broadening
The European Commission has proposed adding roughly 180 downstream aluminium product categories to the CBAM goods list, including products such as fasteners and machinery-related components. The same period also brings pre-consumer scrap into the mechanism and raises the default-value penalty to 30% from 2028. Furthermore, the alcoa decarbonisation strategy offers one example of how major producers are beginning to pre-position for this expanded compliance environment.
2. The Phase-In Jump
The move from 2.5% in 2026 to 48.5% by 2030 is the most important financial step-change in the entire pathway. Many energy, process, and reporting investments that seem optional in 2026 become financially material by the end of the decade.
3. Possible Inclusion of Indirect Emissions
A technical study on indirect-emissions inclusion has already moved the debate from principle to methodology. If electricity emissions are eventually incorporated, the aluminium CBAM burden changes dramatically, especially for coal-heavy supply chains. The CBAM cost implications for supply chains are significant enough that many producers are now building scenario models around both the current and expanded scope.
Strategic Playbook for Producers, Traders, and Investors
Phase 1: 2026 to 2027
Focus on measurement first.
- Build verified carbon accounting systems
- Establish audit trails and facility-level allocation methods
- Improve shipment-level traceability
- Avoid default value penalties
Phase 2: 2028 to 2030
Then focus on energy and process improvement.
- Secure renewable PPAs where feasible
- Shift from coal toward lower-emission fuels where practical
- Evaluate inert-anode pathways and process upgrades
- Align customer contracts with product-level emissions claims
Phase 3: 2030 to 2034
Prepare for full carbon cost competition.
- Optimise both Scope 1 and likely Scope 2 exposure
- Engage with domestic carbon pricing design where relevant
- Position certified low-carbon and recycled products for premium segments
A useful investing lens is to separate compliance winners from decarbonisation winners. They are not always the same companies in 2026. Near-term winners may be those with verification systems and portfolio flexibility, while longer-term winners are more likely to be those with durable low-carbon power, process innovation, and credible product traceability.
Frequently Asked Questions About Aluminium CBAM First Year Winners
How Much Does CBAM Cost Per Tonne of Aluminium in 2026?
At roughly EUR 75 per tonne of CO2e and a 2.5% phase-in factor, the cost is about EUR 6 to EUR 8 per tonne of primary aluminium in 2026.
Why Are Hydropower Smelters Not the Biggest Winners Yet?
Because CBAM for aluminium currently focuses on direct emissions only. Hydropower's main advantage sits in electricity-related emissions, which remain outside the first-year calculation.
Is Recycled Aluminium Exempt?
Post-consumer scrap is currently outside CBAM, which gives recycled supply chains a structural advantage. Pre-consumer scrap is expected to become a CBAM good from 2028.
What Is Resource Shuffling?
It is the practice of assigning output from the cleanest facilities to EU shipments without changing the producer's broader production mix. This matters because it can improve declared CBAM performance while leaving total enterprise emissions largely unchanged.
What Should Investors Watch Next?
The main triggers are:
- Any move to include indirect emissions
- The 2028 rise in default penalties
- Expansion into downstream product categories
- The sharp phase-in increase by 2030
Final Takeaways
The first year of CBAM does not yet function as a pure carbon ranking tool for aluminium. It functions more like a selective compliance filter layered onto a carbon policy trajectory.
That is why the aluminium CBAM first year winners include some surprising groups:
- Coal-route producers benefiting from electricity exclusion
- Multi-asset global groups able to reshuffle supply attribution
- Verified producers avoiding default penalties
- Suppliers in countries with domestic carbon pricing offsets
- Secondary aluminium and post-consumer scrap processors
The losers are equally revealing. Clean-power primary producers are under-recognised, unverified exporters are penalised, and suppliers without carbon-price deductions face a tougher future slope.
For industry participants, the core strategic message is simple: 2026 is cheap, but not trivial. It is the lowest-cost compliance window the market is likely to see before CBAM becomes materially heavier. The companies that use that window to improve both measurement and decarbonisation should be in the strongest position as aluminium's border carbon cost becomes harder to avoid.
Disclaimer: This article is for informational and educational purposes only and should not be treated as financial, legal, or investment advice. Regulatory implementation can evolve, timelines may change, and scenario analysis involving trade flows, carbon pricing, or geopolitical developments remains inherently uncertain. Readers should review primary EU legal texts, company disclosures, and professional advice before making commercial or investment decisions.
Want to Track ASX Mineral Discoveries With a Market-Leading Edge?
Discovery Alert's proprietary Discovery IQ model delivers real-time alerts on significant ASX mineral discoveries, cutting through complex data to surface actionable investment opportunities the moment they are announced — explore Discovery Alert's discoveries page to see how historic finds have generated substantial returns, and begin your 14-day free trial to position yourself ahead of the market.