July 31, 2026
The Commodity Market Signal Most Investors Misread: Inventory Structure, Not Headlines
Commodity markets have a well-documented tendency to punish investors who anchor their analysis to news flow rather than underlying physical data. Geopolitical headlines generate short-term volatility, but the structural signals that actually drive sustained price moves are found elsewhere: in warehouse receipts, warrant cancellation rates, and the shape of the forward curve. In aluminum specifically, these technical market indicators have been communicating an increasingly urgent message throughout 2026, one that deserves careful examination beyond the daily noise around shipping lanes and ceasefire agreements.
When aluminum inventories and LME stocks compress simultaneously with widening term-structure backwardation, the market is not reacting to speculation. It is pricing a genuine physical scarcity into every forward contract on the curve. Furthermore, commodity market volatility in this environment often obscures the cleaner signals embedded in inventory data.
When big ASX news breaks, our subscribers know first
How Far Have LME Aluminum Stocks Actually Fallen?
A Multi-Year Inventory Collapse Placed in Context
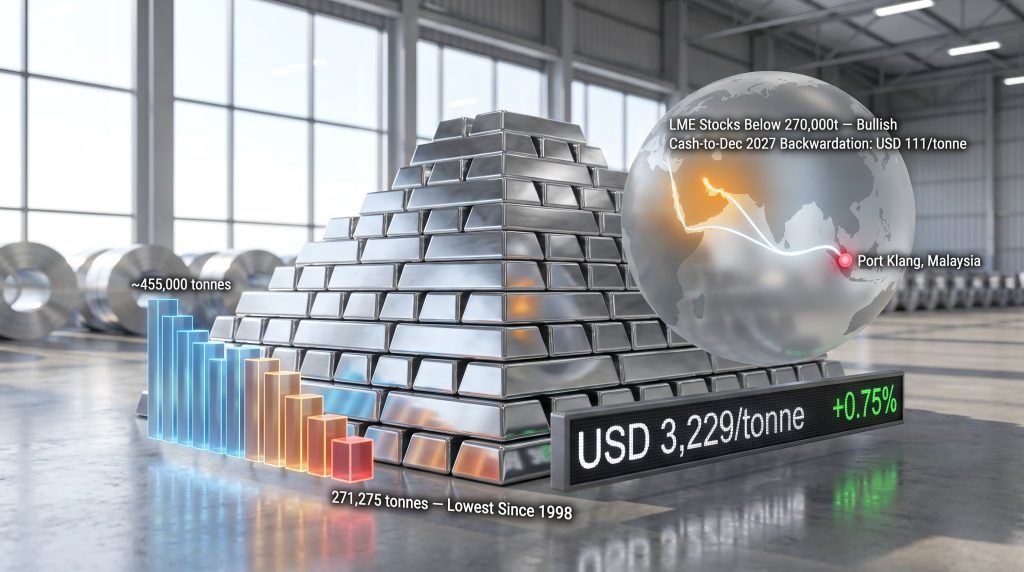
The scale of the 2026 drawdown in LME-registered aluminum is difficult to overstate. By late July 2026, total LME aluminum stocks had fallen to approximately 267,800 tonnes, representing a decline of more than 40% from the late January 2026 level of over 445,000 tonnes. This places current inventory at its lowest point since September 2022, a multi-year low that carries significant analytical weight.
| Metric | Value | Significance |
|---|---|---|
| LME aluminum stocks (late July 2026) | ~267,800 tonnes | Lowest since September 2022 |
| LME stocks (late January 2026) | ~445,000+ tonnes | Peak of the current cycle |
| Drawdown magnitude | >40% in under six months | Far exceeds seasonal norms |
| On-warrant LME stocks | ~245,350 tonnes | Immediately available to buyers |
| LME cash price (July 31, 2026) | USD 3,229/tonne | +0.75% on the session |
| Cash-to-December 2027 backwardation | USD 111/tonne | Signals acute near-term scarcity |
| China aluminum inventory | Below 1,000,000 tonnes | First breach of this threshold in current cycle |
A drawdown exceeding 40% in under six months is categorically different from normal seasonal inventory fluctuation. Standard seasonal patterns in aluminum typically produce inventory swings of 10% to 15% around construction and automotive demand cycles. What is occurring in 2026 reflects sustained physical offtake that is consistently outpacing warehouse replenishment across multiple geographies.
Critically, on-warrant stocks — the metal that is freely available for immediate purchase through the LME system — have fallen faster than total stocks. This distinction matters enormously for physical buyers. Total inventory figures include cancelled warrants, which represent metal already earmarked for removal and therefore unavailable to new buyers. When on-warrant supply compresses faster than the headline number, the true available supply cushion is even thinner than the aggregate figure implies. Indeed, LME aluminium stocks have hit their lowest level this century amid ongoing Middle East supply constraints, underscoring just how historically significant this drawdown has become.
Cancelled Warrants as a Leading Indicator of Physical Stress
Within the LME warehouse system, cancelled warrants function as one of the most reliable forward-looking indicators of supply pressure. A cancelled warrant signals that the metal has been committed for physical delivery and removal from the registered warehouse network. Once cancelled, that tonnage effectively disappears from the tradeable supply pool immediately, even before it physically leaves the facility.
Several dynamics in early 2026 illustrated this mechanism in concentrated form:
- In early March 2026, cancelled warrants represented approximately 39.5% of total LME aluminum inventory, an unusually elevated share
- Port Klang, Malaysia, saw more than 45,000 tonnes of warranted aluminum cancelled within a single week, a volume large enough to move global inventory metrics materially
- At one point in February 2026, a single counterparty reportedly controlled close to 90% of accessible LME aluminum inventory, a degree of concentration that creates substantial single-party risk in the available supply calculation
- The key reversal threshold for cancelled warrants sits at 22,450 tonnes: a recovery back above this level would signal that the destocking cycle is decelerating
The concentration of LME aluminum inventory in Port Klang introduces an important asymmetry. Large single-location cancellations amplify the tightness signal sharply on the way down, but a single large restocking event from the same location could partially reverse that signal with equal speed. Investors monitoring the situation should weight multi-location data rather than relying on any single warehouse cluster.
What Is Driving the Aluminum Supply Squeeze? A Multi-Factor Analysis
Factor 1: Strait of Hormuz Shipping Constraints and Persian Gulf Supply
The Strait of Hormuz carries approximately 9% of global aluminum supply originating from Persian Gulf producers. Following the breakdown of the US-Iran ceasefire, shipping through this corridor remained constrained. The effect on LME inventory is indirect but powerful: when seaborne deliveries from Gulf producers face delays or rerouting costs, downstream consumers source metal from exchange warehouses rather than waiting for delayed shipments.
This mechanism functions as a demand accelerant for registered exchange stocks rather than a direct supply cut, but the inventory consequence is identical. LME warehouse drawdowns deepen regardless of whether the underlying cause is reduced production or delayed delivery, and the price response is the same in either case.
Factor 2: China's 45 Million-Tonne Production Ceiling
China produces roughly half of global primary aluminum output. Its statutory production cap of 45 million tonnes per annum removes what would otherwise be the market's most significant pressure-release valve during periods of global tightness. China demand and industrial output patterns further complicate any straightforward assumptions about how quickly domestic supply can respond.
The significance of this cap extends beyond simple arithmetic. In previous commodity cycles, Chinese producers could and did ramp output aggressively in response to elevated prices, dampening global supply shortfalls within one to two quarters. Under the current regulatory framework, that response mechanism is structurally constrained regardless of price signals.
What makes the 2026 data particularly telling is the behaviour of Chinese downstream industries. The downstream operating rate for aluminum processing fell to 60.2%, declining 0.9 percentage points month-on-month. Despite this softening in processing activity, domestic Chinese aluminum inventories continued falling below the 1 million-tonne threshold for the first time in the current inventory cycle. This combination — lower operating rates alongside declining inventories — confirms that supply-side constraints are exerting greater force than seasonal demand softness.
Factor 3: Alumina Supply Recovery Lags the Aluminum Price Signal
The resumption of operations at Emirates Global Aluminium's Al Taweelah refinery in the UAE, following a three-and-a-half-month outage, is often cited as a bearish counterweight to the tightness narrative. However, the timeline from alumina restart to incremental aluminum output is measured in months, not weeks.
Aluminum smelting requires a continuous, stable supply of alumina at elevated temperatures. Ramping a smelter after alumina supply interruption involves a carefully managed restart process that cannot be accelerated simply because market prices are attractive. Consequently, even a successful alumina facility restart contributes to additional primary aluminum supply only in the subsequent quarter at the earliest.
During this lag period, the Platts alumina benchmark held at USD 337.38 per tonne while aluminum prices rose, which widened the margin advantage for vertically integrated producers who source their own alumina internally. Standalone smelters purchasing third-party alumina face a more complex margin equation during this interval.
Factor 4: The Port Klang Concentration Risk
The geographic concentration of LME aluminum inventory in Port Klang, Malaysia, introduces a structural vulnerability that is underappreciated in most market commentary. When a disproportionate share of registered inventory sits in a single location, the warrant cancellation activity of a small number of participants in that location can produce outsized moves in global inventory statistics.
This concentration effect works in both directions. The rapid cancellations seen in early 2026 amplified the apparent tightness signal beyond what a more geographically diversified warehouse base would have produced. Conversely, a single large re-warranting event at Port Klang could partially reverse global inventory metrics within days, making it essential for analysts to track warehouse-level data rather than relying solely on aggregate figures.
What Does USD 111/Tonne Backwardation Reveal About Aluminum Market Structure?
Understanding Backwardation as a Physical Scarcity Mechanism
Backwardation is the condition in which the cash (spot) price of a commodity trades above the forward price for later delivery. It is the inverse of contango, which is the normal resting state for storable commodities where forward prices reflect the cost of storage and financing over time.
In aluminum markets, a cash-to-forward backwardation of USD 111/tonne between the cash price and the December 2027 contract carries specific implications:
- Physical holders of aluminum can earn a premium by delivering metal immediately rather than holding it for future delivery
- Buyers who need metal now are paying above the forward curve to secure supply, confirming genuine near-term scarcity
- The magnitude of USD 111/tonne represents substantial compensation to current holders, indicating the scarcity signal is not marginal
- Historically, sustained backwardation at this level in base metals precedes forward curve repricing as the market seeks to incentivise new production investment
Bid-offer spreads holding at USD 2/tonne during this period reinforce the interpretation that price moves reflect genuine physical demand rather than thin-market speculative distortions.
The Bull and Bear Cases Defined by Inventory Data
Geopolitical headlines create volatility but rarely alter the underlying supply-demand balance. Inventory data, warrant cancellations, and price structure provide more reliable signals than news flow alone.
Bull Case for Aluminum (Sustained Tightness):
- LME stocks remain below 270,000 tonnes
- Cancelled warrants stay below the 22,450-tonne reversal threshold
- China inventories remain below 1 million tonnes
- Cash aluminum sustains above USD 3,200/tonne
- Backwardation persists above USD 80/tonne
Bear Case for Aluminum (Normalization):
- Al Taweelah and other refineries restore full alumina output, enabling smelter ramp-ups within one to two quarters
- Strait of Hormuz shipping normalises, reducing urgency of exchange-warehouse drawdowns
- Cancelled warrants recover above 22,450 tonnes, signalling physical restocking
- LME stocks recover above 300,000 tonnes, compressing backwardation toward flat
- Off-warrant inventory re-enters the market as prices incentivise re-registration
Critical Level to Watch: A sustained break below USD 3,085/tonne in LME cash aluminum, combined with rising cancelled warrants and increasing warehouse stocks, would constitute evidence that the supply squeeze is unwinding rather than merely pausing.
How Tight Aluminum Supply Flows Through the Entire Value Chain
Price Transmission from Smelter to End-User
The consequences of tight physical aluminum supply are not confined to LME screen prices. They propagate through every layer of the value chain with a lag that depends on contract structures at each stage.
| Market Segment | Price Movement | Implication |
|---|---|---|
| LME cash aluminum | USD 3,229/tonne (+0.75%) | Global physical contract benchmark |
| SMM A00 spot (China) | 23,630 yuan/tonne | Domestic Chinese premium pricing |
| Aluminum scrap | +100 to +200 yuan/tonne | Secondary supply cost inflation |
| ADC12 alloy (die-casting) | ~+100 yuan/tonne | Automotive and industrial cost pass-through |
Integrated vs. Standalone Producers: The Margin Asymmetry
One of the less-discussed structural dynamics of the current supply squeeze is the divergent margin impact on producers depending on their level of vertical integration. Examining the broader aluminium supply chain reveals how deeply this asymmetry runs across the industry.
Integrated bauxite-to-aluminum producers own or control their alumina supply chain. When aluminum prices rise while alumina costs remain internally stable, the full benefit of the LME price increase flows to their bottom line. This group captures the maximum upside from the current pricing environment.
Standalone smelters purchasing third-party alumina face a more complicated outcome. When alumina prices rise alongside aluminum (as they have during the Al Taweelah outage period), the net benefit from higher LME prices is partially or fully offset by input cost inflation. Their effective margin expansion is compressed relative to integrated peers.
This dynamic creates a clear investment differentiation framework during supply-squeeze cycles: integrated operators structurally outperform standalone smelters as both aluminum and alumina prices move together.
Downstream Exposure: Automakers, Packaging, and the EV Demand Multiplier
The cost pass-through mechanism for rising aluminum prices operates on quarterly adjustment cycles in most downstream industrial contracts. This means the full earnings impact of the mid-2026 supply squeeze may not appear in automotive or packaging company results until Q3 and Q4 2026.
A structural demand factor amplifying this cycle is the accelerating adoption of electric vehicles. EVs use approximately 30 to 40% more aluminum by weight than comparable internal combustion engine vehicles, driven by battery enclosure structures, thermal management systems, and the need for lightweight chassis components to offset battery mass. In addition, energy transition demand for metals such as aluminum continues to create a structural floor beneath consumption that did not exist in prior cycles. This demand increment is not demand-elastic, meaning automakers cannot substitute away from aluminum without compromising vehicle performance or regulatory compliance on weight and range targets.
Macroeconomic Conditions Amplifying the Aluminum Supply Signal
US GDP, PCE Inflation, and the Fed's Influence on Physical Commodity Markets
The macroeconomic backdrop of mid-2026 has reinforced rather than offset the physical supply tightness signal. US Q2 2026 GDP growth came in at 1.5%, accompanied by moderating PCE inflation, which collectively reduced market expectations for additional Federal Reserve rate increases.
This monetary policy shift has a direct mechanical effect on physical commodity markets through the financing cost channel. When interest rates decline or rate expectations ease, the carry cost of holding physical metal inventory falls proportionally. Lower carry costs make it more economical for consumers, traders, and merchants to maintain or build physical aluminum positions rather than drawing down inventories to minimise financing expense.
The Self-Reinforcing Cycle Between Rate Expectations and Backwardation
The interaction between easing monetary policy and commodity backwardation creates a feedback loop that is not widely understood outside specialist commodity trading circles:
- Lower rate expectations reduce the opportunity cost of holding physical aluminum
- Reduced carry costs incentivise buyers to secure physical supply earlier rather than relying on forward delivery
- Increased physical buying accelerates the drawdown of exchange-registered stocks
- Declining inventory deepens the backwardation signal
- Deeper backwardation attracts additional physical holders seeking to capture the spot premium
- This reinforces step 1, creating a self-sustaining dynamic until supply fundamentally recovers
In a high-rate environment, this cycle would be interrupted at step 2 because the opportunity cost of holding physical metal would offset the backwardation premium. The current environment removes that brake.
The next major ASX story will hit our subscribers first
How to Monitor the Aluminum Supply Situation: An Evidence-Based Framework
Primary Data Sources for Tracking Physical Aluminum Tightness
Effective monitoring of the aluminum supply situation requires discipline around data hierarchy. The following sources provide the most reliable real-time signals:
- LME Daily Warehouse and Warrant Reports: The most granular real-time measure of physically available aluminum, updated each trading day with total stocks, on-warrant stocks, and cancelled warrant volumes by location. LME warehouse and stocks reports are publicly accessible and represent the primary reference for tracking registered inventory movements
- SMM Twice-Weekly Inventory Updates: Covers Chinese domestic aluminum stocks and downstream operating rates, providing the complementary view on the world's largest producing and consuming market
- Platts Alumina Price Index: Monitors input cost trends for smelters and tracks margin conditions for integrated versus standalone producers
- LME Commitment of Traders and Position Data: Identifies concentration risk and the potential for short-covering or long-liquidation events that can create price dislocations independent of physical fundamentals
Key Threshold Indicators: A Decision Framework
| Indicator | Bullish Threshold | Bearish Threshold |
|---|---|---|
| LME total stocks | Below 270,000 tonnes | Rising above 300,000 tonnes |
| Cancelled warrants | Below 22,450 tonnes | Recovering above 22,450 tonnes |
| Cash aluminum price | Above USD 3,200/tonne | Sustained break below USD 3,085/tonne |
| China inventory | Below 1,000,000 tonnes | Rising above 1,100,000 tonnes |
| Cash-to-forward backwardation | Widening beyond USD 111/tonne | Narrowing toward flat or contango |
Why Year-on-Year Price Gains of 23% Require Analytical Caution
Aluminum's 23.14% year-on-year price appreciation through mid-2026 represents substantial momentum, but momentum itself creates analytical risk. Several factors complicate the straightforward extrapolation of this trend:
- Off-warrant inventory (metal held outside registered exchange warehouses) is inherently difficult to quantify. Unreported stockpiles could re-enter the market as re-warranted supply if prices remain elevated, providing a supply source that does not appear in LME data until it physically arrives at a registered warehouse
- The timing of any Hormuz shipping normalisation remains genuinely uncertain and could shift available supply materially within weeks rather than months
- Mean reversion risk increases proportionally with the magnitude of the preceding price move
The analytically sound approach is to weight observable inventory trends, warrant data, and price structure over geopolitical assumptions when building a forward view on aluminum.
Three Scenarios for the Aluminum Supply Outlook Through the Rest of 2026
Scenario 1: Sustained Tightness (Base Case)
Physical drawdowns continue as Hormuz shipping remains constrained, alumina supply recovery lags behind aluminum price signals, and China's production cap holds firm. LME stocks remain below 270,000 tonnes, backwardation persists above USD 80/tonne, and cash aluminum consolidates above USD 3,100/tonne. Integrated producers capture expanding margins while standalone smelters face input cost pressure.
Scenario 2: Gradual Normalisation
Al Taweelah reaches full capacity within one to two quarters, Hormuz shipping partially recovers as diplomatic conditions stabilise, and Chinese downstream operating rates stabilise around current levels. LME stocks recover into the 280,000 to 320,000-tonne range, backwardation compresses to USD 30 to 50/tonne, and aluminum prices consolidate in the USD 2,900 to 3,100/tonne range.
Scenario 3: Rapid Supply Recovery (Bear Case)
Hormuz shipping fully normalises, multiple alumina facilities restart simultaneously, and off-warrant inventory re-enters the LME system. Stocks recover above 350,000 tonnes, backwardation collapses, and aluminum prices retrace toward USD 2,700 to 2,800/tonne, reversing a significant portion of the year-on-year gain.
The Structural Demand Backdrop That Underpins All Three Scenarios
Regardless of which scenario materialises on the supply side, the demand picture for aluminum contains structural elements that did not exist in prior cycles. However, aluminium tariff impacts add a further layer of complexity to how these structural demand signals translate into price outcomes across different regions:
- Energy transition infrastructure, including solar panel frames, wind turbine components, and electrical grid upgrades, creates aluminum demand that is not sensitive to short-term price fluctuations
- EV production growth establishes a structural demand floor measured in millions of additional tonnes annually as fleet electrification accelerates
- Packaging and construction demand provides baseline consumption stability that limits the severity of any demand-led downturn
These structural demand factors do not prevent price corrections when supply recovers, but they do establish a higher long-term demand baseline than existed in previous aluminum cycles, which affects the price level at which new supply investment becomes economically rational.
Frequently Asked Questions: Aluminum Inventories and LME Stock Tightness
What does it mean when LME aluminum stocks fall to multi-year lows?
When LME-registered aluminum stocks reach their lowest level since September 2022, physical buyers are withdrawing metal from exchange warehouses faster than producers and traders are depositing new supply. This typically reflects genuine near-term scarcity and supports higher spot prices through backwardation, where cash prices trade above forward prices to compensate holders for delivering immediately.
Why are cancelled warrants an important indicator for aluminum supply?
Cancelled warrants represent aluminum earmarked for physical removal from LME warehouses. Once cancelled, this metal is no longer available to other market participants through the exchange, even though it still appears in total inventory figures. A rising cancelled-warrant share of total inventory signals accelerating physical offtake and reduces the effective supply available to new buyers more sharply than the total stock figure alone suggests.
How does China's 45 million-tonne production cap affect global aluminum supply?
China produces approximately half of global primary aluminum. Its statutory production ceiling prevents output from expanding beyond 45 million tonnes annually regardless of price incentives, removing the market's most significant potential supply response mechanism during periods of global tightness and making price increases more sustained than they would otherwise be.
What is the significance of USD 111/tonne backwardation in aluminum?
A USD 111/tonne premium for immediate delivery over the December 2027 forward price is a strong market signal that near-term physical aluminum inventories and LME stocks are critically short. Buyers are willing to pay a substantial premium to secure metal now rather than wait for future delivery, reflecting genuine scarcity rather than speculative positioning.
What price level would signal the aluminum rally is reversing?
A sustained close below USD 3,085/tonne in LME cash aluminum, accompanied by cancelled warrants recovering above 22,450 tonnes and warehouse stocks rising above 300,000 tonnes, would constitute evidence that physical supply is recovering. This combination of data points, not any single indicator, provides the most reliable reversal confirmation.
Disclaimer: This article is provided for informational and educational purposes only. It does not constitute financial advice or a recommendation to buy or sell any security or commodity. Forward-looking statements, scenario projections, and price forecasts involve inherent uncertainty and should not be relied upon as predictions of future outcomes. Readers should conduct their own due diligence and consult a licensed financial adviser before making investment decisions.
Want to Stay Ahead of the Next Major Mineral Discovery on the ASX?
While inventory structures and commodity price signals reveal where markets are heading, Discovery Alert's proprietary Discovery IQ model delivers real-time notifications the moment significant ASX mineral discoveries are announced — converting complex data into clear, actionable opportunities for both traders and long-term investors. Explore historic discoveries and their extraordinary returns, then begin your 14-day free trial to ensure you're positioned before the broader market moves.