August 3, 2026
When Gold Prices Surge, Operational Leverage Becomes the Real Differentiator
In any commodity supercycle, the gap between companies that merely benefit from rising prices and those that systematically convert price gains into accelerating cash returns tends to widen dramatically. The gold mining industry in 2026 has become a particularly sharp illustration of this principle. While elevated bullion prices have lifted financial results across the sector, only a handful of large-cap producers have managed to grow earnings at a rate that meaningfully outpaces the gold price itself. The mechanics behind that outperformance, and what it means for investors tracking AngloGold Ashanti half-year dividends and share buyback activity, deserve careful examination. Understanding how gold price movement affects mining equities provides essential context for interpreting these results.
When big ASX news breaks, our subscribers know first
The Compounding Effect: Why EBITDA Growth Outpaced Gold Price Appreciation in H1 2026
Understanding why some gold miners deliver disproportionate financial leverage to bullion prices requires grasping a fundamental concept in mining economics: operational leverage. When a producer operates with a relatively fixed cost base, each incremental dollar of revenue flows almost entirely into earnings. The higher the gold price climbs above the all-in sustaining cost threshold, the more pronounced this effect becomes.
AngloGold Ashanti's H1 2026 results are a textbook demonstration of this dynamic in action. With gold prices elevated well above prior-year levels, the company's cost structure, while facing external pressures, remained sufficiently disciplined to generate an earnings expansion that comfortably outstripped the percentage increase in the gold price itself.
Key H1 2026 Financial Metrics at a Glance
| Financial Metric | H1 2026 Result | Year-on-Year Change |
|---|---|---|
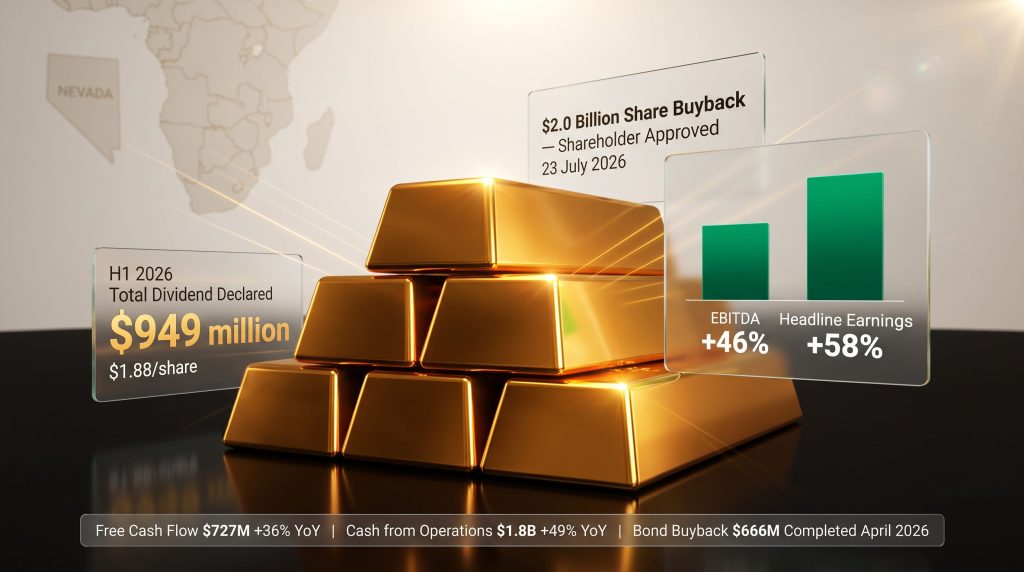
| EBITDA | $2.0 billion | +46% |
| Headline Earnings | $1.0 billion | +58% |
| Cash Generated from Operations | $1.8 billion | +49% |
| Free Cash Flow | $727 million | +36% |
| Cash Tax Paid | $542 million | More than doubled YoY |
| Total Dividend Declared (H1) | $949 million ($1.88/share) | ~102% increase vs H1 2025 |
Key Insight: AngloGold Ashanti's H1 2026 cash generation grew nearly 50% year-on-year, a rate that significantly outpaced both gold price appreciation and peer-group averages among major gold producers. Management described this as likely the strongest EBITDA growth year-on-year of any large-cap gold company during the period.
The headline earnings improvement of 58% to $1.0 billion is particularly telling. Headline earnings strip out non-recurring items, making them a cleaner measure of repeatable operational performance. A 58% earnings gain relative to a gold price increase that was itself substantial signals that cost management, portfolio quality, and capital discipline are all functioning as intended. Furthermore, the gold price outlook for miners in 2025 and beyond suggests this disciplined approach will remain critical.
Full Details of the AngloGold Ashanti H1 2026 Dividend Declaration
Breaking Down the $949 Million Payout
The AngloGold Ashanti half-year dividends and share buyback story begins with a combined H1 2026 dividend declaration of US$1.88 per share, totalling approximately US$949 million. This is structured across two quarterly instalments:
- Q1 2026 Interim Dividend: US$1.16 per share
- Q2 2026 Interim Dividend: US$0.72 per share
- Scheduled Q2 Payment Date: 4 September 2026
Year-on-Year Dividend Comparison
| Dividend Metric | H1 2026 | H1 2025 | Change |
|---|---|---|---|
| Total Dividend Per Share | US$1.88 | US$0.925 | +103% |
| Total Dividend Value | US$949 million | US$469 million | +102% |
The near-doubling of total dividend value in a single half-year period is exceptional even within the context of gold's strong price performance. It reflects not just higher revenues but the company's structural commitment to transmitting operational cash gains directly to shareholders without delay. For further detail on AngloGold Ashanti's dividend history, historical payout data provides useful comparative context.
How AngloGold's Dividend Framework Is Structured
Unlike flat-rate dividend policies common in other sectors, AngloGold's payout framework is mechanically linked to free cash flow generation. This means distributions scale in real time with the company's ability to convert gold sales into distributable cash after sustaining capital requirements are met. For investors, this creates a form of embedded commodity price exposure within the income stream itself, a feature that distinguishes AngloGold from producers with fixed or formulaic dividend floors.
Investor Consideration: A free-cash-flow-linked dividend policy means payouts will compress during gold price downturns just as they expand during upswings. Investors seeking income stability should model AngloGold's dividend at a range of gold price assumptions rather than extrapolating current levels forward.
The $2 Billion Share Buyback: Mechanics, Approval Status, and Strategic Logic
Shareholder Approval and Regulatory Status
On 23 July 2026, AngloGold Ashanti shareholders formally approved a share repurchase programme covering up to US$2.0 billion of the company's ordinary shares. The programme is currently awaiting approval from the South African Reserve Bank (SARB) before execution can commence. This regulatory requirement is standard for South African-incorporated companies seeking to deploy significant capital in share repurchases involving foreign currency flows. The WSJ has reported on how AngloGold's shareholder payouts have soared alongside rising gold prices.
Why the Buyback Matters Beyond the Headline Number
The strategic significance of the buyback extends well beyond its face value:
- Complementary mechanism: It operates alongside, not in replacement of, the dividend framework, preserving appeal for income-focused investors while introducing capital appreciation optionality through share count reduction.
- Management confidence signal: A $2 billion buyback commitment signals that leadership views the current share price as offering attractive value relative to projected cash generation, a form of implicit valuation guidance.
- Cycle positioning: By simultaneously retiring debt, distributing dividends, and repurchasing shares, AngloGold is demonstrating multi-channel capital return discipline that positions the company as a sophisticated allocator of capital rather than a passive beneficiary of gold price movements.
- EPS accretion potential: Reducing the share count increases earnings per share mathematically, creating a compounding effect on per-share metrics that benefits long-term holders even if absolute earnings growth moderates.
Capital Allocation in Context: A Multi-Layered Approach
AngloGold's capital return activity in 2026 spans three distinct instruments, each serving a different purpose:
| Capital Action | Details | Timing |
|---|---|---|
| Bond Buyback | $666 million principal repurchased | Completed April 16, 2026 |
| H1 Dividend | $949 million total ($1.88/share) | Q2 payment date: Sep 4, 2026 |
| Share Buyback | Up to $2.0 billion approved | Pending SARB approval |
The April 2026 bond repurchase is particularly noteworthy from a risk management perspective. By eliminating portions of 2028 and 2030 debt maturities, AngloGold has reduced its refinancing risk during a period when credit market conditions remain uncertain. Lower gross debt also reduces interest obligations, incrementally improving the free cash flow available for future shareholder returns.
Q2 2026 Operations: What Drove the Production Decline and Why It Didn't Derail the Financials
Q2 2026 Production and Cost Summary
| Operational Metric | Q2 2026 Result | Year-on-Year Change |
|---|---|---|
| Gold Production | 744,000 oz | -7% |
| Total Cash Costs | $1,480/oz | +21% |
| All-In Sustaining Costs (AISC) | $2,039/oz | Higher YoY |
| Sustaining Capital Expenditure | $332 million | Higher YoY |
| Non-Sustaining Capex | $217 million | Doubled YoY |
Two Specific Factors Behind Lower Q2 Output
Production fell 7% to 744,000 oz in Q2 2026, driven by two distinct events rather than any broad operational deterioration:
- Serra Grande divestment: The sale of this Brazilian operation permanently removed its contribution from the consolidated production base. Portfolio rationalisation of this kind typically reflects a deliberate choice to concentrate capital in higher-return assets rather than an operational shortfall.
- Obuasi safety suspension: Following a contractor fatality on 24 April 2026, a temporary safety suspension was implemented at the Obuasi mine in Ghana. The investigation has since been completed and corrective actions are being implemented. The total recordable injury frequency rate at managed operations improved to 0.79 injuries per million hours worked during Q2, indicating broader safety performance remains on an improving trajectory.
Offsetting these constraints were strong operational performances at Tropicana in Australia and Cuiabá in Brazil, both of which exceeded expectations during the quarter.
Decoding the Cost Inflation: External vs Internal Drivers
One of the more analytically important distinctions in AngloGold's Q2 cost profile is the separation of externally driven inflation from controllable operational factors. The breakdown reveals a company whose internal cost discipline is largely intact despite headline cost figures that appear elevated.
| Cost Pressure Factor | Impact on Q2 Cash Costs |
|---|---|
| General CPI Inflation (Labour & Contractors) | +$71/oz |
| Gold-Price-Linked Royalties | +$67/oz |
| Elevated Fuel Prices (Brent crude +45%) | +$43/oz |
| Foreign Exchange Headwinds | +$35/oz |
| Operational Factors | +$29/oz |
| Total Macroeconomic Impact | +$216/oz |
Critical Context: Of the total cost increase in Q2 2026, macroeconomic factors contributed $216/oz while operational factors contributed just $29/oz. The 45% rise in average Brent crude prices was partially linked to disruptions associated with the ongoing US-Iran geopolitical conflict, which prompted the company to prioritise fuel supply security. This distinction matters enormously for investors assessing whether cost inflation reflects structural deterioration or transient external pressures.
Currency Appreciation: The Hidden Cost Multiplier
A less commonly discussed driver of mining cost inflation is the impact of local currency appreciation against the US dollar on operations reporting in foreign currencies. When producer-country currencies strengthen, the cost of local labour, energy, and supplies rises in dollar terms even if no real wage increase or price change occurs locally.
In Q2 2026, AngloGold faced headwinds across three major operating jurisdictions:
- Australian Dollar: +10% appreciation vs USD, affecting Tropicana's cost base
- Brazilian Real: +11% appreciation vs USD, impacting Cuiabá and AGA Mineração
- Ghanaian Cedi: +9% appreciation vs USD, adding pressure at Obuasi and Iduapriem
Collectively, these currency movements added $35/oz to Q2 costs. For a globally diversified producer like AngloGold, currency diversification cuts both ways: it reduces dependence on any single economy but creates aggregate exposure to broad-based emerging market currency strength, a scenario that tends to coincide with risk-on environments and, often, with elevated gold prices. In addition, gold's safe-haven appeal during geopolitical turbulence further reinforces demand dynamics that underpin the company's revenue base.
The Full Asset Potential Programme: Brownfield Value Creation in Practice
What Is the Full Asset Potential Strategy?
AngloGold's Full Asset Potential (FAP) programme represents a systematic methodology for extracting additional value from existing operations without the lead times, capital intensity, or permitting complexity associated with greenfield development. The programme involves:
- Comprehensive asset-level reviews identifying underperforming processing circuits, sub-optimal mine sequencing, and recovery improvement opportunities
- Capital-efficient modifications to existing infrastructure
- Benchmark-driven operational comparisons across the portfolio to transfer best practices between sites
In H1 2026, the FAP programme delivered a $20/oz reduction in underlying controllable costs, a meaningful contribution that partially offset the external cost pressures described above.
Brownfield Expansion Pipeline: Five Key Sites
The in-depth portfolio review completed by AngloGold identified high-return expansion opportunities at the following operations, all targeted to increase production capacity from 2029 onwards:
- Obuasi (Ghana) – underground mining optimisation and processing enhancement
- Geita (Tanzania) – open pit and underground integration opportunities
- Sukari (Egypt) – processing throughput and recovery improvements
- Siguiri (Guinea) – leach circuit and ore blending optimisation
- Cuiabá (Brazil) – underground resource conversion and processing upgrades
The brownfield approach is strategically significant because it targets ounces within already-permitted, infrastructure-equipped environments. This compresses the time from investment decision to first gold, reduces capital risk, and avoids the community and regulatory complexity inherent in building new mines in new locations. Consequently, different types of gold mining investments carry meaningfully different risk and return profiles depending on their development stage.
The next major ASX story will hit our subscribers first
Nevada: The Tier-1 Greenfield Platform for Long-Term Growth
While the brownfield programme addresses near-to-medium-term production growth, AngloGold's longer-term production expansion thesis is anchored in southern Nevada. The North Bullfrog and Arthur Gold projects are being advanced concurrently, with the objective of establishing a new production centre in one of the world's most established mining jurisdictions.
Nevada's appeal as a mining address is well understood in the industry: stable rule of law, established mining codes, experienced labour markets, and infrastructure proximity. For AngloGold, establishing a Tier-1 operation in North America would meaningfully diversify its geographic production mix away from sub-Saharan Africa, where political risk premiums periodically affect investor sentiment toward the stock.
Speculative Consideration: If Nevada production comes online at scale in the early 2030s, it could meaningfully shift AngloGold's jurisdictional production weighting, potentially compressing the political risk discount applied to its equity valuation by institutional investors who weight country risk heavily in mining company assessments. This remains speculative and is contingent on project development timelines, permitting outcomes, and capital allocation decisions that have not yet been finalised.
H2 2026 Outlook and What Investors Should Monitor
Production and Cost Trajectory
AngloGold's full-year 2026 guidance, issued in February 2026, remains unchanged, confirming management confidence in the underlying production plan despite the Q2 disruptions. Key forward indicators include:
- Gold production is expected to be significantly weighted toward H2 2026, meaning Q3 and Q4 should deliver materially higher volumes than Q2's 744,000 oz
- As production volumes recover and fixed costs are spread across a larger ounce base, unit costs are projected to trend lower through the second half
- Remaining 2026 cash tax payments are expected in equal quarterly instalments of $230-$250 million, providing predictable cash flow modelling inputs for analysts
Key Metrics to Watch Through the Remainder of 2026
- SARB approval timeline for the $2 billion buyback and initial execution pace once cleared
- Obuasi production ramp-up following the completion of safety corrective actions
- Quarterly cash tax payments and their impact on free cash flow available for shareholder returns
- Gold price trajectory and its direct influence on royalty costs and dividend quantum under the FCF-linked policy
- Nevada project development updates, particularly any capital commitment decisions for North Bullfrog
Furthermore, the gold market outlook for 2025 and beyond continues to shape investor expectations around the sustainability of current payout levels.
Frequently Asked Questions: AngloGold Ashanti Dividends and Share Buyback 2026
What Is the Total AngloGold Ashanti Dividend for the First Half of 2026?
AngloGold Ashanti declared a total H1 2026 dividend of US$1.88 per share, comprising US$1.16 for Q1 and US$0.72 for Q2, representing a combined payout of approximately US$949 million.
When Is the AngloGold Ashanti Q2 2026 Dividend Payment Date?
The Q2 2026 dividend of US$0.72 per share is scheduled for payment on 4 September 2026.
Has the AngloGold Ashanti $2 Billion Share Buyback Been Approved?
Shareholders approved the US$2.0 billion share repurchase programme on 23 July 2026. The programme is pending final approval from the South African Reserve Bank before execution can commence.
How Does AngloGold Ashanti Determine Its Dividend Amount?
The company's dividend framework is linked to free cash flow generation, meaning dividend levels scale with the company's ability to convert operational performance into distributable cash.
What Was AngloGold Ashanti's Free Cash Flow in H1 2026?
Free cash flow reached $727 million in H1 2026, representing a 36% increase year-on-year.
Why Did AngloGold Ashanti's Production Fall in Q2 2026?
Q2 production declined 7% to 744,000 oz, primarily due to the divestment of the Serra Grande mine and a temporary safety-related suspension at the Obuasi operation in Ghana.
Key Takeaways: AngloGold Ashanti's Capital Return Story in 2026
- ~$949 million in dividends declared across H1 2026, representing the largest half-year payout in recent company history
- US$2.0 billion share buyback approved by shareholders on 23 July 2026, awaiting SARB regulatory clearance
- $666 million in bond principal repurchased in April 2026, reducing debt maturity risk across 2028 and 2030 maturities
- 46% EBITDA growth and 58% headline earnings improvement underpin the accelerated shareholder return framework
- Cost inflation is overwhelmingly externally driven, with macroeconomic factors contributing $216/oz versus just $29/oz from operational sources in Q2
- The Full Asset Potential programme delivered $20/oz in controllable cost reductions in H1 2026
- Production growth is expected to accelerate materially in H2 2026, with brownfield expansion at five key sites targeting further production upside from 2029
This article is informational in nature and does not constitute financial advice. Past financial performance, dividend declarations, and capital return programmes do not guarantee future outcomes. Investors should conduct independent due diligence and consult a qualified financial adviser before making investment decisions. All figures referenced are sourced from publicly available company disclosures and reporting by Mining Weekly.
Want to Identify the Next Major Mineral Discovery Before the Broader Market Does?
While large-cap producers like AngloGold Ashanti demonstrate the compounding power of operational leverage at scale, the most explosive returns in the gold sector have historically come from early-stage discoveries — and Discovery Alert's proprietary Discovery IQ model delivers real-time alerts the moment significant ASX mineral discoveries are announced, transforming complex data into actionable opportunities. Explore historic discovery returns on Discovery Alert's dedicated discoveries page and begin a 14-day free trial to position ahead of the market.