July 24, 2026
When Index Headlines Lie: Reading the ASX 200's Longest Losing Streak Since 2018
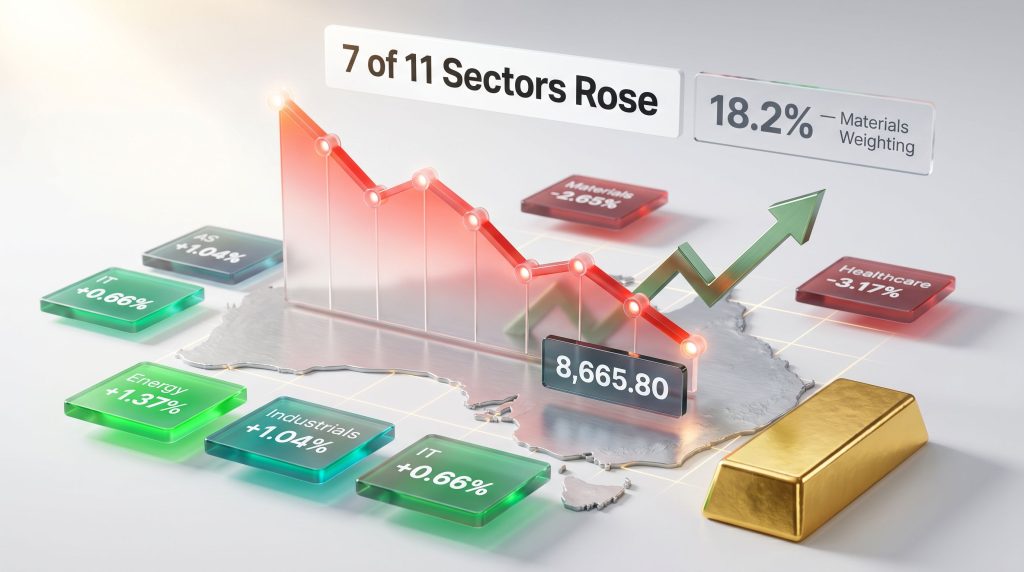
Most investors instinctively treat a falling index as a falling market. When the ASX 200 (ASX: XJO) closed lower for eight consecutive sessions, settling at 8,665.80 points in what became the ASX 200 longest losing streak sectors to buy and avoid analysis period since 2018, the instinct for many was to interpret the headline as a broad market crisis. That instinct, while understandable, misread the signal almost entirely. Understanding why it misread it is arguably the most valuable lesson this particular losing streak has to offer.
The mechanics of index construction mean that a small number of heavily weighted sectors can drag a benchmark lower even when the majority of its components are rising. That is precisely what happened during this eight-session drawdown. Seven of the eleven ASX 200 sectors recorded positive performance across the streak. The index fell anyway, because the sectors that were selling off carried disproportionate structural weight.
For investors who understand how to look past the headline number, the ASX market under commodity pressure did not signal a market in freefall. It signalled something far more useful: a repricing event that was simultaneously punishing certain sectors and creating genuine entry points in others.
When big ASX news breaks, our subscribers know first
Why the ASX 200 Fell for Eight Days Straight, and What Actually Drove It
The catalyst for the drawdown was not a single domestic event but a convergence of external pressures arriving simultaneously. Brent crude trading above US$110 per barrel, representing roughly a 50% increase since Middle East conflict escalation disrupted regional supply flows, created a cost-of-capital shock that rippled through rate-sensitive sectors. The Strait of Hormuz, through which a significant share of global seaborne oil transits, faced meaningful supply disruption, giving the oil price move genuine fundamental support rather than speculative framing.
Layered over this was the Reserve Bank of Australia's anticipated rate decision, which added a domestic policy dimension to an already stressed global macro backdrop. A weakening Australian dollar compounded the pressure on import-dependent industries, amplifying inflationary dynamics that were already making life difficult for margin-sensitive businesses. According to recent market reporting, the eight-day streak wiped $106 billion from portfolios, underscoring the scale of the repricing event.
The Index Weighting Problem Investors Often Miss
Here is the less-discussed structural reality that explains much of the confusion. The materials sector carries approximately 18.2% of the ASX 200 by portfolio weighting, making it the single largest sectoral influence on the index's daily direction. When major iron ore producers including BHP and Rio Tinto sold off, with both falling roughly 1.98% to $53.86 and $167.42 respectively during the streak, the mathematical drag on the headline index was substantial regardless of what was happening across the other ten sectors.
High-beta miners fell by 8 to 9% across the period, mechanically pulling the XJO lower even as energy stocks, industrials, financials, and technology names were all advancing. This is sometimes called the index weighting distortion effect, and it matters enormously for investors who make allocation decisions based on index-level performance rather than underlying sector breadth.
By contrast, information technology carries only a 2.1% weighting in the ASX 200 despite delivering returns of approximately 52% in 2024, the strongest sector performance by a wide margin. Its gains are structurally underrepresented in the headline index, which creates a persistent opportunity gap for investors willing to look past the benchmark number.
Sector Performance During the Eight-Day Streak at a Glance
| Sector | Performance During Streak | Year-to-Date Context | Signal |
|---|---|---|---|
| Energy | +1.37% | Recovering from -21% in 2024 | Bullish |
| Industrials | +1.04% | +1.69% YTD | Bullish |
| Financials | +0.96% | -7.80% YTD | Selective |
| Information Technology | +0.66% | +52% in 2024 | Accumulate |
| Materials | -2.65% | Largest weighting at 18.2% | Cautious |
| Healthcare | -3.17% | -24.91% in 2025 | Avoid Near-Term |
| Consumer Staples | Significant decline | Margin compression accelerating | Avoid |
When the majority of sectors rise during an index-level losing streak, the signal is rotation rather than recession. Investors repositioning away from overvalued rate-sensitive names and into commodity-linked and industrial stocks drove the apparent contradiction between sector breadth and index performance.
The Three ASX Sectors Building the Strongest Buy Case
Energy: Structural Supply Constraints and a Low Starting Base
The energy sector's recovery during the losing streak deserves particular attention because it occurred against a backdrop of genuine fundamental support rather than speculative positioning. Brent crude above US$110 per barrel reflects real supply constraints, not momentum trading, with regional conflict removing meaningful export capacity from global markets.
Santos and Stanmore Resources each gained approximately 3.0% during a period when the broader index was declining, a divergence that points toward institutional accumulation rather than retail opportunism. When large capital flows move into a sector during a broad market selloff, it typically reflects conviction-based positioning, not panic buying.
Why energy's current starting point matters:
- Energy was among the worst-performing ASX sectors in 2024, falling roughly 21% over the year
- That decline created a low valuation base from which the current recovery is building
- Sector analysis from Morningstar has identified energy as carrying the widest discount to fair value estimates among ASX sectors heading into 2026
- Dividend yields from major energy producers provide income support that softens volatility for long-term holders
Key names in this space include Woodside, Santos, and Beach Energy, though individual stock selection requires independent research and due diligence aligned with personal risk tolerance.
The primary risk is straightforward: any diplomatic resolution to Middle East tensions could rapidly deflate the geopolitical premium currently embedded in oil prices, triggering a sharp reversal in energy equities. Investors should, therefore, size positions with that scenario in mind rather than treating current oil prices as a permanent floor.
Industrials: The Quiet Outperformer With a Secular Growth Driver
The industrials sector gained 1.04% across the losing streak and has delivered modest but consistent outperformance year-to-date. It tends to attract less attention than energy or technology, partly because its gains are steadier and less dramatic, but that characteristic is precisely what makes it valuable in an uncertain macro environment.
Global defence spending is running at its highest levels in decades, with multiple NATO-aligned nations committing to sustained increases in military procurement following years of underinvestment. Furthermore, Australian-listed industrial and defence-adjacent companies have been active participants in this cycle, winning contracts across domestic and international markets.
Key names include Austal, EOS (Electric Optic Systems), and DroneShield, each representing a different risk profile within the defence sub-theme:
| Sub-Sector | Characteristics | Risk Level |
|---|---|---|
| Established defence contractors (e.g. Austal) | Diversified order books, recurring government revenue | Medium |
| Precision weapons and autonomous systems (e.g. EOS) | Higher growth potential, contract-dependent revenue | High |
| Drone and counter-drone technology (e.g. DroneShield) | Significant upside, but extreme single-session volatility | Very High |
DroneShield experienced a 22% single-session decline at one point during the broader market stress period, a reminder that high-growth defence technology names require disciplined position sizing. Treat the defence theme as a multi-year structural opportunity, not a short-term trade.
The industrials sector's relative insulation from commodity cycle volatility and direct rate sensitivity gives it a lower correlation profile compared to materials or financials, making it a useful portfolio diversifier in addition to a growth opportunity.
Information Technology: Structurally Underweighted, Consistently Outperforming
The persistent outperformance of ASX technology stocks relative to their index weighting creates an unusual opportunity for investors willing to look beyond benchmark exposure. WiseTech Global rallied approximately 3.41% to $42.72 during the losing streak, demonstrating the kind of relative resilience that characterises businesses with recurring, software-based revenue streams.
SaaS and logistics technology businesses generate revenue that is largely insulated from the forces driving the current market stress. Commodity prices, RBA rate cycles, and consumer spending patterns have limited direct impact on subscription-based revenue models, which is why institutional buyers continued to accumulate technology names even as the headline index fell.
Why ASX tech tends to outperform during broad market stress:
- Subscription and licensing revenue provides earnings visibility that commodity-linked businesses cannot match
- Low physical asset bases reduce exposure to energy cost inflation
- Revenue derived from global customers reduces reliance on the domestic RBA rate cycle
- Scalability characteristics mean margin improvement can occur even in subdued demand environments
At just 2.1% of the ASX 200 by weighting, the IT sector's returns are dramatically underrepresented in index performance. Investors who confine their exposure to index weighting will structurally underallocate to the benchmark's strongest-performing sector over the past two years.
Two ASX Sectors Where the Risk-Reward Has Deteriorated
Consumer Staples: The Defensive Label No Longer Holds
Woolworths Group fell approximately 7.54% to $34.48 during the losing streak period, which is a strikingly large move for a business traditionally associated with earnings stability and low price volatility. Coles Group declined roughly 3.97% to $22.03, confirming that the pressure is not company-specific but reflects a sector-wide structural problem.
The mechanism driving this deterioration is worth understanding in detail:
- Wholesale food, packaging, and logistics costs rise alongside energy price inflation and supply chain disruption
- Consumer price sensitivity limits the extent to which major retailers can pass these costs through to shoppers
- Operating margins compress even when top-line revenue continues growing
- Earnings estimates are revised downward, stripping out the premium valuation investors historically paid for sector stability
- The stock re-rates lower even though the defensive classification technically still applies
The fundamental problem is that the defensive premium attached to consumer staples is only justified when the sector's earnings are genuinely stable. When input cost inflation grows faster than pricing power, that stability breaks down. Until inflationary pressures demonstrably cool, this dynamic is unlikely to reverse.
REITs and Property Trusts: Rate Sensitivity in a Higher-for-Longer World
Real estate investment trusts occupy a structurally difficult position in the current environment. Their business models depend on affordable debt financing to acquire and manage income-producing assets, and both the cost and availability of that financing are moving in the wrong direction.
The RBA's anticipated rate decision adds a near-term policy overlay to a medium-term structural challenge. Rising rates increase the discount rate applied to REIT cash flows in valuation models, mechanically reducing net asset values independent of any change in the underlying property assets. Names that appeared attractively priced under lower rate assumptions may, however, continue to re-rate downward as the rate path becomes clearer.
Investors drawn to REITs by apparent value on historical metrics should stress-test their assumptions against a scenario where the RBA holds rates elevated considerably longer than consensus currently expects. In rate-hiking cycles, assets that look cheap on yesterday's discount rate assumptions frequently become cheaper before conditions turn.
Gold and Resources: How to Separate the Iron Ore Risk From the Commodity Opportunity
The materials sector's aggregate -2.65% decline across the streak obscures dramatically different dynamics operating within it. The iron ore oversupply outlook faces a structurally difficult 2026 environment, with expectations of widening oversupply and subdued Chinese steel demand creating earnings headwinds for pure-play iron ore producers. That weakness dominated the sector's index-level performance.
However, materials is not a monolithic category, and the commodity differentiation happening beneath the surface is where the real investment story lies.
| Commodity | Primary Demand Driver | Supply Outlook | Investment Signal |
|---|---|---|---|
| Iron Ore | Chinese construction and steel production | Oversupply widening through 2026 | Underweight |
| Copper | Energy transition infrastructure buildout | Supply constrained, new projects scarce | Overweight |
| Gold | Inflation hedge, currency weakness, geopolitical risk | Stable production growth | Overweight |
| Rare Earths | EV battery technology, defence applications | Geopolitically complex supply chains | Selective |
Gold's Multi-Factor Alignment in the Current Environment
Gold performs most powerfully when three conditions converge: elevated domestic inflation, a weakening local currency, and rising geopolitical uncertainty. All three conditions are present in the current Australian macro environment simultaneously, which is a relatively rare alignment historically.
The gold miners outlook was reinforced by the behavioural signal at the end of the losing streak. Major gold producers on the ASX led the index rebound on the final session, which market analysts interpreted as institutional investors confirming a genuine inflation hedge mandate rather than speculative positioning. When large capital pools buy gold producers during a recovery session following a prolonged selloff, it reflects portfolio construction logic rather than momentum chasing.
Furthermore, gold safe haven demand has strengthened considerably given the simultaneous presence of inflation, currency weakness, and geopolitical risk. Preferred gold exposures cited in current market research include Evolution Mining (EVN) and Northern Star Resources (NST) as part of a precious metals overweight thesis within a broader resources allocation.
How the RBA Decision Functions as a Sector Allocation Accelerant
The Reserve Bank of Australia's upcoming rate decision does not change the fundamental direction of each sector's investment thesis. What it does is sharpen the magnitude of divergence between rate-sensitive sectors and those insulated from domestic monetary policy cycles.
Rate-sensitive sectors facing amplified pressure from RBA hikes:
- Property and REITs: direct cost-of-capital impact on asset valuations and distribution yields
- Consumer staples: reduced consumer spending capacity compounds existing margin pressure
- Financials: net interest margin dynamics become more complex; CommBank's dominant market position is expected to face increasing valuation headwinds through 2026, with ANZ and Westpac representing more selective opportunities
Sectors largely insulated from or benefiting from rate uncertainty:
- Energy: commodity prices driven by geopolitical supply dynamics, not domestic rates
- Gold and precious metals: real rate uncertainty typically supports gold's store-of-value demand
- Industrials: government contract revenue operates largely independently of the RBA rate cycle
The next major ASX story will hit our subscribers first
Scenario Framework: Three Macro Paths and Their Sector Implications
| Scenario | Macro Conditions | Sectors to Overweight | Sectors to Underweight |
|---|---|---|---|
| Geopolitical escalation continues | Oil above US$110, RBA hikes, AUD weak | Energy, Gold, Industrials | REITs, Consumer Staples, Healthcare |
| Diplomatic resolution plus rate pause | Oil falls sharply, RBA holds | Financials, IT, Consumer Discretionary | Energy (near-term), Materials |
| Stagflation persistence | Inflation sticky, growth slows | Gold, Energy, Industrials | REITs, Consumer Staples, Financials |
Important disclaimer: Scenario modelling involves forecasts, assumptions, and projections that may not eventuate. The scenarios above are analytical frameworks for thinking about sector positioning under different conditions, not predictions of future market outcomes. All investment decisions should be made in consultation with a licensed financial adviser and based on individual circumstances.
Frequently Asked Questions About the ASX 200 Losing Streak and Sector Strategy
What is the significance of the ASX 200's longest losing streak since 2018?
Extended losing streaks of eight or more consecutive sessions are statistically uncommon in the ASX 200's history. When they do occur, they have historically tended to precede consolidation phases rather than accelerating bear markets, though this pattern is not a guarantee of future outcomes. The more analytically significant aspect of this particular streak is the sector breadth data: seven of eleven sectors advanced, indicating rotation rather than broad capitulation. For a deeper look at how analysts are framing this downturn, coverage from Motley Fool Australia provides useful additional context on the oil price dynamics driving the move.
Does an index losing streak mean all ASX sectors are falling?
Not necessarily, and this case demonstrates the point clearly. Index-level performance can be dominated by a small number of heavily weighted sectors even when the majority of the market's components are rising. The materials sector's 18.2% weight in the ASX 200 means weakness in major miners can push the benchmark lower even when most other sectors are posting gains.
Which ASX sectors benefit most when oil prices are elevated?
Energy sector stocks are the most direct beneficiaries, as higher commodity prices translate directly into improved revenue and margins for producers. Gold miners also tend to benefit indirectly, because elevated oil prices frequently correlate with broader inflationary conditions that support gold demand. Consumer staples and REITs are among the most negatively affected, facing input cost inflation and rising energy operating expenses respectively.
Are ASX REITs worth buying during a rate-hiking cycle?
Generally, REITs face structural headwinds during rate-hiking cycles because their debt-dependent business models and discounted cash flow valuations are directly affected by higher interest rates. Some names may appear attractively valued on historical metrics, but investors should model scenarios where rates remain elevated beyond consensus expectations before committing capital.
A Prioritised Framework for ASX Sector Positioning
The eight-day losing streak is best understood not as a market-wide warning signal but as a repricing mechanism that has simultaneously created genuine entry opportunities in some areas while extending risk in others. A well-considered asset allocation strategy is, consequently, more important now than at any point in recent years.
Highest conviction on current data:
- Energy: geopolitical supply constraint supports elevated oil prices; sector trading at wide discount to fair value estimates following 2024 underperformance
- Gold and precious metals: multi-factor tailwind from inflation, AUD weakness, and global uncertainty; institutional buying confirmed by post-streak rebound leadership
- Industrials: consistent outperformer with defence spending as a structural multi-year growth driver
Selective exposure requiring active monitoring:
- Information technology: structurally underweighted in the index relative to performance contribution; accumulate quality names with recurring revenue models on weakness
- Financials: selective opportunities within the sector, with ANZ and Westpac preferred over CommBank given valuation concerns around the latter's market leadership position
Reduce or avoid until conditions change:
- Consumer staples: margin compression thesis remains intact until inflation demonstrably and sustainably cools
- REITs and property trusts: rate sensitivity creates ongoing downside risk in a higher-for-longer monetary environment
- Broad iron ore exposure: oversupply dynamics through 2026 create structural earnings headwinds for pure-play producers
The investors most likely to benefit from this environment are those who use the headline fear generated by the ASX 200 longest losing streak since 2018 to execute disciplined, sector-specific positioning, rather than reacting to index-level noise with undifferentiated buying or selling. The opportunity is real. It is just not located where the headlines suggest.
This article is general information only and does not constitute financial advice. Past performance is not indicative of future results. Always conduct your own research and consult a licensed financial adviser before making investment decisions.
Want to Know Which ASX Discoveries Could Deliver the Next Major Return?
While sector rotation and index-level noise dominate the headlines, Discovery Alert's proprietary Discovery IQ model cuts through the complexity by delivering real-time alerts on significant ASX mineral discoveries — instantly identifying actionable opportunities across energy, gold, copper, and beyond before the broader market reacts. Explore Discovery Alert's dedicated discoveries page to understand how historic finds have generated substantial returns, and begin your 14-day free trial today to position yourself ahead of the next major discovery.