May 15, 2026
The Quiet Reordering Beneath the ASX Surface
Capital markets rarely shift direction with fanfare. Instead, the most consequential rotations tend to begin beneath the surface, accumulating momentum through individual decisions made by thousands of investors simultaneously recalibrating their positioning. What is unfolding across the ASX in 2025 is precisely this kind of structural reordering — the ASX banks to commodities rotation — driven not by a single catalyst but by a convergence of valuation stress, policy disruption, and fundamental commodity dynamics that reinforce one another.
Understanding this rotation requires stepping back from the daily noise and examining the forces that have been building for months, if not years.
When big ASX news breaks, our subscribers know first
Why Australian Bank Stocks Are Under Pressure
The Valuation Overhang That Built Through 2024
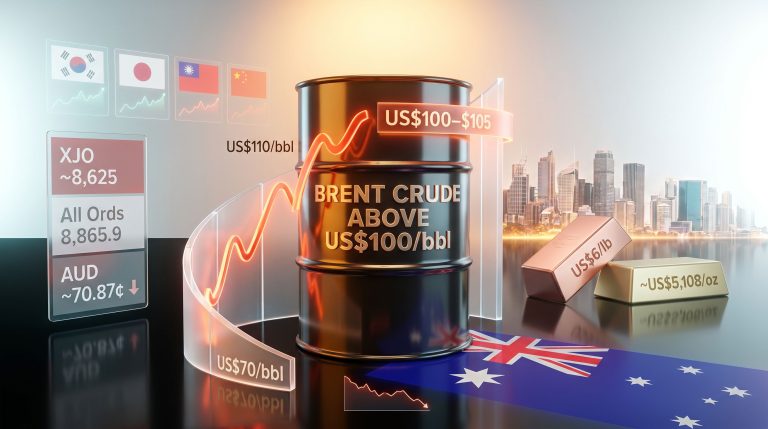
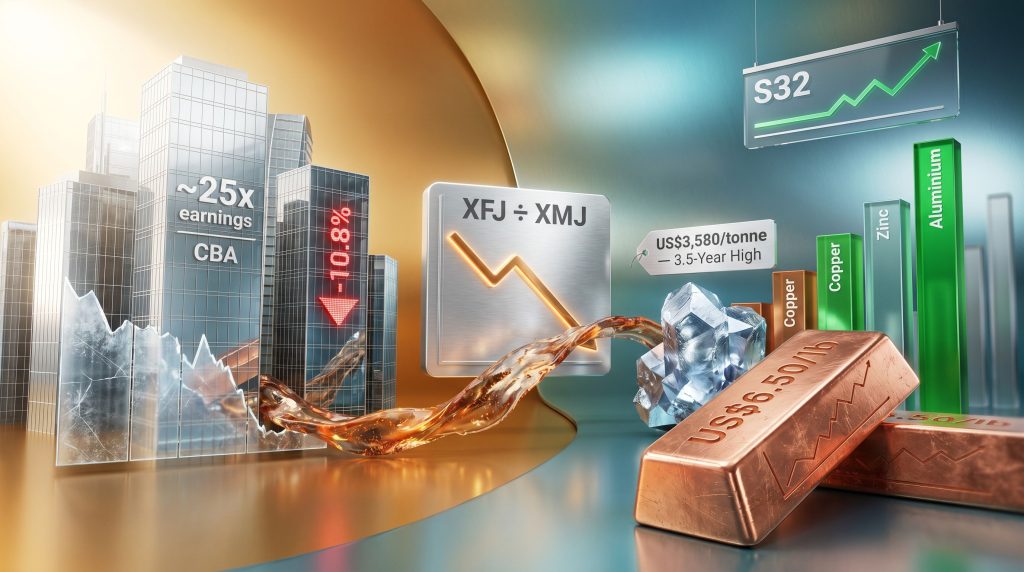
Australian major banks delivered approximately 40% gains through 2024, a performance that compressed future return expectations significantly. Commonwealth Bank traded at roughly 25 times earnings, placing it among the most expensively valued banking institutions globally by conventional metrics. Dividend yields fell to levels well below historical norms, a clear signal that price had run well ahead of underlying fundamentals.
Passive index mechanics amplified this dynamic considerably. As bank share prices rose, their weighting within the index expanded, compelling index-tracking funds to allocate proportionally more capital into those positions. This created a self-reinforcing feedback loop where price gains generated further mechanical buying. The critical insight is that this same mechanism operates symmetrically in reverse — when bank weightings contract, index funds reduce exposure proportionally, adding selling pressure to an already weakening price structure.
CBA's Historic Single-Session Decline
Commonwealth Bank recorded what is being described as its largest single-day percentage fall in decades, dropping approximately 10.8% following a quarterly result that was essentially flat, with early indications of net interest margin softening. The scale of that reaction is instructive: a flat result should not ordinarily produce a double-digit decline in a major financial institution.
The market was not reacting to the earnings themselves but rather repricing the multiple that had been assigned to the stock. When perfection is priced in and anything short of perfection is delivered, the correction is structural, not temporary. Furthermore, as ASX market performance data confirms, this sector-wide pressure has been building for some time.
"Residential mortgages represent approximately 45 to 50% of the major banks' combined balance sheets, creating concentrated exposure to property market conditions that are themselves now shifting."
NAB also broke below a technically significant multi-year resistance level during the same period, reinforcing the interpretation that this is a sector-wide trend reversal rather than isolated weakness in a single institution.
Policy Changes Reshaping the Investment Landscape
Capital Gains Tax Reform and Property Market Implications
Proposed changes to capital gains tax treatment, scheduled to take effect from July 1, 2027, would reduce the 50% CGT discount for assets acquired after July 1, 2026. For property investors managing large residential portfolios, this fundamentally alters the incentive structure underpinning their investment thesis, since the capital growth expectations that justified accepting negative cash flow are now materially diminished.
The grandfathering of negative gearing for existing properties appears protective at first glance but contains a structural weakness. An investor holding a negatively geared property can retain that treatment indefinitely, but when the property is eventually sold, the next buyer cannot apply negative gearing because it is no longer a new property. The forward bid for existing stock weakens accordingly.
Clearance rates in major capital cities were already trending toward 50% ahead of these announcements. The combination of reduced capital growth expectations and diminished buyer incentives for established properties could apply further downward pressure on transaction volumes, which flows directly into reduced mortgage origination activity at the major banks.
The SMSF Arbitrage Window and Tactical Positioning
For investors facing marginal income tax rates approaching 47 cents in the dollar, the contrast with superannuation taxation creates a compelling incentive to shift capital inside self-managed superannuation structures. The arithmetic has become stark enough that setup costs, administrative complexity, and liquidity constraints are increasingly justified by the after-tax differential.
Critically, assets acquired before July 1, 2026 and held for a minimum of 12 months retain eligibility for the existing 50% CGT discount framework. This creates a defined tactical window with a clear expiry date. Investors willing to take positions in quality growth assets currently experiencing sentiment-driven selling, and hold through the qualification period, stand to benefit from both potential price recovery and the legacy discount treatment on resulting gains.
"Assets purchased before July 1, 2026 and held for 12 months retain access to the 50% CGT discount under the existing rules. This window has a hard expiry and represents a meaningful structural advantage in an increasingly high-tax investment environment."
Growth-oriented technology stocks, which have been subjected to significant selling pressure following the CGT announcement, may represent some of the highest-conviction opportunities within this framework, particularly where the underlying business quality remains intact despite the share price dislocation.
Reading the Financials-to-Materials Ratio
The XFJ-to-XMJ ratio, constructed by dividing the ASX financials index by the materials index, functions as a real-time barometer of capital flow between Australia's two dominant sector groups. This ratio has registered a confirmed long-term trend shift downward, meaning materials are outperforming financials on a sustained basis for the first time in several years.
What makes this signal particularly significant is its historical context. When this ratio breaks its long-term trend, the great resources rotation typically persists for multiple months or years rather than weeks. The prior trend shifts visible on a monthly chart align closely with major commodity bull phases and extended periods of bank underperformance.
| Indicator | ASX Banks | ASX Materials |
|---|---|---|
| 2024 Performance | Approximately +40% | Lagging broadly |
| Current Valuation | Stretched (CBA at ~25x earnings) | Lower multiples, improving yields |
| Earnings Momentum | Deteriorating (margin compression risk) | Improving (commodity price tailwinds) |
| Policy Sensitivity | High (CGT, property reform) | Moderate |
| Passive Flow Direction | Outflows as index weight contracts | Inflows as index weight expands |
| Relative Trend Signal | Long-term trend shift downward | Long-term trend shift upward |
Copper: A Multi-Decade Breakout With Structural Foundations
The Technical Confirmation That Changes Everything
Copper held below approximately US$4.55 per pound for most of the prior decade, repeatedly rejected at that ceiling despite multiple attempted breakouts. In 2025, copper broke above US$6.50 per pound and has sustained that level, with price now trading in territory that was effectively inaccessible for an extended period.
The price action leading into this breakout followed a classic technical confirmation sequence: an initial rally toward the US$6.00 level, a failure and retest of the key breakout zone, followed by a decisive move higher. The prior rejection zone has transformed into a support base, which technical analysts regard as a high-conviction structural shift. A sustained hold above the former resistance level opens a pathway toward US$7 to US$8 per pound on a medium-term basis, and the copper supply crunch is expected to intensify further.
Demand Drivers That Did Not Exist in Previous Cycles
The most significant development in copper demand analysis is the emergence of AI infrastructure as a major consumption driver. AI data centres require approximately 10 times more copper than traditional data centres, driven by the density of GPU installations and the associated wiring requirements. Trillions of dollars in committed global AI infrastructure investment are translating directly into copper demand that has no precedent in prior commodity cycles.
The supply side provides an equally compelling dynamic. The lead time from discovery to production for a major copper mine typically spans 10 to 20 years. The CEO of Ivanhoe Mines has publicly articulated a view that the next decade may require humanity to mine more copper than was extracted across all of prior recorded history, a statement that reflects the scale of the supply-demand imbalance being contemplated by major industry participants.
During the 2022-to-2024 metals downturn, copper maintained relative price strength while zinc, nickel, and other base metals were severely discounted. This divergence is a meaningful signal of structural demand support rather than purely cyclical buying.
"When a commodity holds its value during a broad sector downturn while its peers decline sharply, the inference is that demand is structural rather than cyclical. Copper's relative outperformance during the metals bear phase makes its current breakout considerably more credible."
How Rising Copper Prices Redefine Junior Miner Economics
One underappreciated dimension of higher copper prices is the effect on resource economics at the project level. Mining operations carry substantial fixed costs, and the cut-off grade economics for extracting ore shifts materially as commodity prices change.
| Copper Price (US$/lb) | Economic Implications |
|---|---|
| Below $4.00 | Marginal deposits uneconomic; high cutoff grades |
| $4.00 to $5.50 | Established producers profitable; junior developers marginal |
| $5.50 to $7.00 | Deposit economics improve; lower-grade ore becomes extractable; resource sizes effectively increase |
| Above $7.00 | Previously uneconomic deposits become viable; exponential margin expansion for fixed-cost operators |
At copper prices above US$7 per pound, the stated resource size of many junior producers effectively grows because previously uneconomic lower-grade material becomes extractable at a profit. This is not a linear relationship: the margin expansion is non-linear and can be exponential for operations with high fixed costs relative to variable costs.
Regarding substitution risk, some observers note that extremely high copper prices have historically triggered material substitution responses. Aluminium is one candidate for certain wiring applications. Optical fibre is also being actively explored for data centre interconnects, with companies including Nvidia investing in early-stage fibre optic businesses. However, substitution at scale would take considerable time to implement across industries already committed to copper-intensive infrastructure designs.
Zinc: Supply Disruption Driving a Multi-Year Technical Breakout
The Supply Shocks Creating the Current Rally
Zinc on the London Metal Exchange reached approximately US$3,580 per tonne in 2025, representing a 3.5-year high. In addition, the global zinc supply shifts currently underway have been driven by a series of significant disruptions:
- A major explosion at the Kazzinc facility in Kazakhstan, which operates as the single largest zinc-producing mine globally, reduced output materially and complicated a planned divestment of a 70% stake in the operation
- The closure of Glencore's Lady Loretta mine in Australia contributed additional supply reduction
- Broader production cutbacks across lower-grade operations globally have tightened the physical market
These are supply-side events, meaning the price response reflects genuine market tightening rather than speculative positioning alone. Consequently, the global zinc supply shifts are likely to persist well into the medium term.
Technical Structure: A High-Conviction Pattern
The zinc chart presents a textbook multi-year double-bottom formation, a pattern that technical analysts regard as carrying significantly more weight than shorter-term reversal signals. The extended time between the two lows indicates genuine supply and demand rebalancing rather than a temporary sentiment-driven bounce.
Price has broken above the midpoint resistance zone and is trading in the upper structural range. The pattern of two prior waves pulling back to established buying zones before launching higher is consistent with a third wave advance that typically carries further than the preceding moves. Sustained trading above US$4,000 per tonne would represent the next significant technical milestone.
The next major ASX story will hit our subscribers first
South32: Diversified Exposure to the Rotation Theme
South32 (ASX: S32) offers simultaneous exposure to zinc, copper, aluminium, and manganese within a single ASX-listed vehicle, making it a natural vehicle for investors seeking diversified participation in the commodities rotation without concentrating in a single metal.
The stock has registered a confirmed long-term trend shift upward, supported by a strong key reversal bar off a 10-month moving average. The structural chart pattern mirrors the behaviour observed in zinc: extended base-building followed by a decisive breakout, with prior pullbacks finding support precisely at the buying zones identified through volume analysis.
Aluminium is an additional tailwind for S32, with significant government investment programmes in both Australia and the United States targeting domestic production capacity as part of broader industrial and energy transition strategies.
Rare Earths: Structurally Compelling, Near-Term Caution Warranted
Why the Long-Term Investment Thesis Remains Intact
Australia has been positioned as a meaningful alternative to Chinese rare earth supply chains, particularly as policy frameworks in the United States and allied nations prioritise diversification away from single-source dependencies. Brazil, which holds the world's second-largest rare earth reserves, is also accelerating development activity through legislative frameworks and attracting substantial capital inflows.
Several ASX-listed companies hold exploration or development positions in Brazil, providing dual exposure to the rare earth supply diversification theme. The long-term demand case, anchored in electric vehicle production, defence applications, and clean energy infrastructure, remains fundamentally supported regardless of short-term price movements.
Near-Term Technical Warning Signs
Despite the structural strength of the long-term thesis, the current technical configuration for rare earth equities warrants caution. Price has moved into a major sell zone on both monthly and weekly timeframes simultaneously, and a weekly sell pivot has formed suggesting short-term downside risk. The 25% to 61.8% Fibonacci retracement zone below current levels represents a likely consolidation target.
Geopolitical context adds complexity: discussions around US-China trade negotiations, including potential extensions of rare earth export ban reprieves, could temporarily reduce the urgency premium embedded in non-Chinese supply alternatives.
"Being structurally bullish on a sector's long-term outlook does not require holding through every short-term technical correction. When monthly and weekly sell signals align simultaneously, reducing exposure and waiting for a confirmed re-entry at support is a disciplined response to risk management rather than an abandonment of the thesis."
ASX 200 Broader Market Structure
A Range-Bound Index With a Directional Tilt
The ASX 200 has oscillated within a defined price range for approximately 12 months, delivering a net return of approximately negative 0.85% over that period. The index has produced multiple false breakouts at both the upper and lower boundaries of this range, each of which eventually resolved back toward the centre.
Current price action has moved into the lower portion of the range, historically a zone of higher buyer density. The critical question is whether buyers absorb the selling pressure and push price back toward the midpoint, or whether a sustained break below the range triggers a cascade from sellers positioned at higher levels. For broader context on how this dynamic is playing out, shifting focus from banks to mining stocks has become a defining theme of 2025 market commentary.
| Zone | Characteristics | Likely Outcome |
|---|---|---|
| Upper Sell Zone | High seller density; reduced buyer interest | Price stalls or reverses |
| Point of Control | Highest traded volume; contested territory | Price oscillates around this level |
| Lower Buy Zone | High buyer density; reduced seller interest | Price stabilises or reverses |
| Range Breakout Upward | Sellers above capitulate; momentum builds | Rapid advance becomes possible |
| Range Breakdown Downward | Buyers below exhausted; sellers accelerate | Sharp declines of 150+ points in a single session become possible |
Within this range-bound broader market, sector selection rather than market timing becomes the primary driver of portfolio returns. The ASX banks to commodities rotation can and is producing meaningful relative performance even while the headline index remains essentially flat.
Positioning Framework for the Rotation
The ASX banks to commodities rotation is not a single-catalyst trade but a multi-layered structural shift supported by converging signals across valuation, policy, technicals, and commodity fundamentals.
Key considerations for investors monitoring this theme:
- The CGT discount window closing on July 1, 2026 for new acquisitions creates a defined tactical opportunity for acquiring quality growth assets during sentiment-driven selling
- Copper's breakout above a decade-long resistance ceiling, combined with structural AI infrastructure demand and constrained supply response timelines, presents a compelling medium-term thesis
- Zinc's supply disruptions and multi-year double-bottom technical confirmation support near-term upside, with the next major resistance level above US$4,000 per tonne
- South32 provides diversified commodity exposure across multiple metals benefiting from the rotation, reducing single-commodity concentration risk
- Rare earths retain a strong structural long-term case but present a near-term consolidation risk that warrants patience before adding exposure
- The Financials-to-Materials ratio having registered a confirmed long-term trend shift suggests this rotation has the potential to persist for years rather than weeks
This article is intended for informational and educational purposes only and does not constitute financial advice. All investments carry risk, including the potential loss of capital. Past performance is not indicative of future results. Readers should seek independent financial advice before making any investment decisions. Commodity price forecasts and technical analysis projections are speculative in nature and subject to material uncertainty.
Want to Catch the Next Major ASX Mineral Discovery Before the Market Moves?
Discovery Alert's proprietary Discovery IQ model delivers real-time alerts on significant ASX mineral discoveries, instantly transforming complex mineral data into actionable investment insights — perfectly suited for investors positioning ahead of the ongoing ASX banks-to-commodities rotation. Explore how historic mineral discoveries have generated substantial returns and begin your 14-day free trial at Discovery Alert to secure your edge as capital continues flowing from financials into resources.