May 15, 2026
When Commodity Exposure Becomes a Structural Liability
Every economy carries embedded vulnerabilities that only become visible under sufficient pressure. For resource-heavy, energy-import-dependent markets, sustained crude oil pricing above major psychological thresholds does not merely represent a cost increase. It triggers a cascade of compounding headwinds that can suppress equity performance across entire index compositions simultaneously. The ASX finds itself in precisely this position heading into the back half of May 2026.
The question worth exploring is not simply why the ASX falls as Brent crude stays above $100 a barrel, but rather why Australia feels this pressure more acutely than comparable economies, and what the convergence of oil, inflation, monetary policy, and technology sector gaps means for investors navigating this environment. Furthermore, understanding crude oil price trends helps contextualise just how dramatically conditions have shifted.
When big ASX news breaks, our subscribers know first
Australia's Structural Oil Dependency and Why It Matters More Here
The Refining Gap That Amplifies Every Oil Shock
Most developed economies maintain a buffer between global crude price movements and domestic cost transmission. Domestic refining capacity, strategic petroleum reserves, and long-term supply contracts create friction in the price mechanism, slowing the rate at which international oil shocks translate into local operating costs. Australia has progressively dismantled much of this buffer over the past two decades, closing the majority of its domestic petroleum refining capacity and transitioning to a net importer of refined petroleum products.
The practical consequence is straightforward but underappreciated by many retail investors: when Brent crude spikes, Australian businesses feel it faster and more completely than their OECD counterparts. There is no domestic refining margin to absorb the shock. The price move passes directly through to fuel costs, freight costs, and industrial input costs, spreading across transport-dependent sectors including mining, retail logistics, manufacturing, and agriculture.
This structural characteristic means the ASX is disproportionately sensitive to Middle East energy disruptions relative to indices with stronger domestic energy infrastructure. When geopolitical conflict targets oil production and transport corridors in the Persian Gulf region, the resulting price increases land harder on Australian corporate earnings than equivalent moves would in economies such as the United States, Canada, or Norway, all of which retain substantial domestic energy production and refining operations.
How Brent Crude Got to Where It Is
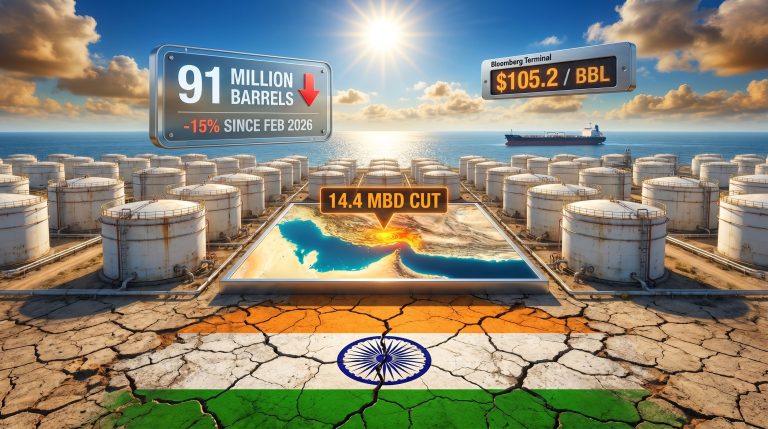
Brent crude entered 2026 trading near US$70 per barrel, a level that reflected cautious market positioning ahead of a geopolitical environment that was already tense but not yet escalatory. The Iran War crisis changed that calculus rapidly. As military activity began targeting energy refinery and transport infrastructure across the region, supply disruption fears drove an approximate 38% surge, pushing Brent above US$110 per barrel at peak before prices settled into the US$100 to US$105 per barrel range that persists today.
There was a brief window of relief. A five-day pause in planned US strikes on Iranian energy infrastructure temporarily pulled Brent toward the US$89 to US$100 range, giving equity markets a moment to stabilise. However, sustained geopolitical uncertainty reasserted the elevated floor, and the Trump-Xi diplomatic meeting during Week 20 produced no resolution that markets could anchor to. According to analysis from Brent crude market specialists, tight supply conditions and limited relief options are expected to persist.
The $100 per barrel level functions as more than a round number. It historically marks the threshold above which mining cost structures, consumer discretionary margins, and freight-intensive businesses begin to experience material earnings pressure across Australian equity markets.
XJO Performance: Seven Weeks of Sustained Pressure
Reading the Index Data From Week 20
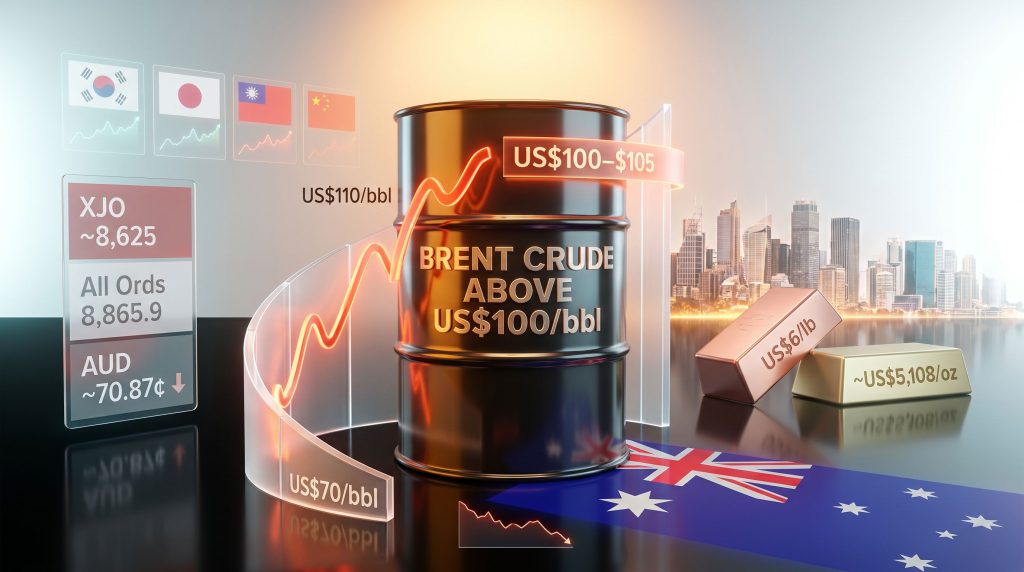
The S&P/ASX 200 closed the week at approximately 8,625 points, having tested intraday lows just above the 8,600 point level before partial dip-buying support emerged. The broader All Ordinaries tracked at 8,865.9 points, posting a modest +0.21% gain that reflects a modest divergence between large-cap heavyweight performance and smaller company dynamics. Small caps, tracked by the S&P/ASX Small Ordinaries, gained +0.39%, while the S&P/ASX 100 edged +0.16% higher.
| Index / Metric | Level | Weekly Direction |
|---|---|---|
| S&P/ASX 200 (XJO) | ~8,625 pts | Negative |
| All Ordinaries | 8,865.9 pts | Marginally positive |
| S&P/ASX Small Ordinaries | 3,452.7 pts | +0.39% |
| S&P/ASX 100 | 7,215.0 pts | +0.16% |
| Australian Dollar | ~70.87 US cents | Weakening trend |
| Brent Crude | Above US$100/bbl | Elevated |
| Gold (USD/oz) | ~US$5,108 | Sideways |
The intraday shape of Friday's session is revealing in its own right. Thursday had delivered a green close that suggested the market might shake off its week-long hesitancy, and Friday's open carried that optimism forward. Approximately 45 minutes into the session, a meaningful sell-off began. The intraday low was reached roughly 90 minutes into trade before dip-buyers stepped in above the 8,600 level.
This pattern is not random noise. It reflects a market caught between two competing forces that are characteristic of elevated geopolitical risk environments: macro pessimism driven by genuine economic headwinds, and tactical opportunism from investors who recognise that recent index levels represent fundamentally reasonable valuations for the underlying businesses. Consequently, ASX market performance under commodity pressure continues to draw close attention from analysts.
The CBA Effect: When a Heavyweight Drags the Index
One dynamic that shaped weekly XJO performance was the behaviour of Commonwealth Bank of Australia shares. CBA had experienced a significant intraweek decline, and the scale of that move was sufficient to drag the broader index with it given CBA's substantial weighting in the S&P/ASX 200 composition. By Friday, however, CBA shares had recovered to approximately A$160 per share, providing a partial tailwind for the index recovery attempt.
This concentration dynamic is a lesser-discussed structural feature of the ASX. Because the index is heavily weighted toward a small number of large financial and resources companies, significant moves in single stocks can generate index-level effects that appear disconnected from broader sectoral or economic trends. When the largest financial stock on the exchange moves by double-digit percentages within a single week, the mathematical impact on the index is substantial regardless of what is happening to the other 199 components.
Sector Anatomy: Who Bears the Brunt of $100 Oil
Mining Stocks: The Copper Disconnect
The mining sector declined approximately 1.4% on Friday and accumulated losses exceeding 4% across the week, a performance that appears puzzling in isolation. Copper, the metal that has become central to the revenue profile of Australia's largest diversified miners, remained firmly above US$6 per pound on both the London Metal Exchange and COMEX markets throughout the period.
BHP (ASX: BHP) retreated approximately 2.5% at the time of writing, while Rio Tinto (ASX: RIO) fell approximately 2.1%, despite both stocks having reached recent all-time highs earlier in the week. The divergence between firm commodity pricing and declining equity valuations points to profit-taking behaviour following peak levels, compounded by broad risk-off positioning across the market rather than any commodity-specific deterioration.
When major resource stocks decline despite supportive underlying commodity prices, the analytical framework shifts. The driver is macro sentiment, not sector fundamentals. For patient investors, this distinction can represent a more favourable entry point than headline equity moves suggest.
The copper market supply crunch that has circulated among commodity analysts for several years continues to find price validation. The structural demand case rests on three converging forces:
- Electrification of transport: Electric vehicles require approximately three to four times the copper of internal combustion engine equivalents.
- Grid infrastructure expansion: Both developed and emerging market grid upgrades require substantial copper for transmission and distribution infrastructure.
- Renewable energy systems: Wind and solar installations are copper-intensive per megawatt of installed capacity relative to conventional generation.
Whether the broader commodities supercycle thesis holds remains contested, but the copper-specific demand story has become difficult to argue against given sustained pricing above US$6 per pound across multiple exchanges.
Gold Miners: Caught Between Flat Prices and Rising Costs
The gold mining sector faces a compounding challenge at present. Gold itself is trading sideways around US$5,108 per ounce, having shed the volatile safe-haven premium that characterised earlier periods of geopolitical stress. Northern Star Resources (ASX: NST), the largest gold producer listed on the ASX, flagged production downgrades and declined approximately 15% as a result, adding sector-specific pressure to the already challenging macro backdrop.
The mechanism suppressing gold is worth understanding clearly. When expectations for US interest rate increases rise, capital flows toward USD-denominated assets. A stronger US dollar reduces the relative purchasing power appeal of gold, which is priced in dollars and pays no yield. The opportunity cost of holding gold versus USD-denominated short-duration assets rises when real yields turn positive, compressing institutional demand for gold as a portfolio component.
This creates a structural margin squeeze for ASX-listed gold producers: revenue per ounce is capped by flat gold pricing while operational costs continue rising alongside elevated diesel, explosives, and equipment costs driven by persistent crude oil price pressure. In addition, understanding gold's safe-haven dynamics in 2025 provides useful context for how this current suppression compares to prior cycles.
Energy Stocks: Divergence Within the Sector
Not all energy exposure is created equal during sustained crude oil price inflation, and Week 20 illustrated the divergence clearly.
| Company | Weekly Movement | Driver |
|---|---|---|
| Ampol | -0.8% | Crude input cost compression on refining margins |
| Viva Energy Group | +2.3% | Retail fuel price pass-through to consumers |
| Broader energy sector | Mixed | Upstream vs. downstream structural difference |
Upstream producers with direct oil revenue benefit from higher realised prices per barrel, while downstream refiners and distributors face the complex calculation of whether retail price increases can be passed through quickly enough to preserve margins. The divergence between Ampol and Viva Energy this week reflects this structural difference playing out in real time. As reported by the ABC's markets live coverage, these intra-sector splits have become a defining feature of the current trading environment.
US Inflation and the Federal Reserve: The Global Transmission Channel
What the April PPI Data Actually Signals
US wholesale inflation reached +6% for the twelve months to April 2026, driven by a Consumer Price Index reading that came in above consensus and a Producer Price Index result described by Reuters as the biggest four-year gain in the series. The PPI matters analytically because it measures cost pressures at the production and distribution level before they reach consumers, functioning as a leading indicator for CPI movements approximately one to two months ahead.
What made the April PPI reading particularly significant was the broadening of inflationary pressure into services. Goods inflation carries a plausible narrative around supply chain disruption and tariff-related cost increases. Services inflation is structurally stickier because it reflects wages, rents, and productivity constraints rather than supply-side commodity shocks. Once services inflation becomes embedded, conventional monetary tools face a harder task in containing it without producing meaningful economic slowdown.
The tariff transmission sequence playing out appears to follow a predictable path. Furthermore, the impact of tariffs on investment markets has been well-documented and helps explain the compounding nature of these inflationary pressures:
- Import tariffs raise input costs for US manufacturers and service providers.
- PPI rises as these costs work through production chains.
- CPI follows with a lag of approximately one to two months.
- Consumer purchasing power erodes as real wages fail to keep pace.
- Retail spending growth compresses, reducing corporate earnings expectations.
- Equity markets begin pricing in slower growth alongside higher inflation, creating stagflationary dynamics.
This sequence matters for Australian equity investors because the Federal Reserve's response to domestic US inflation conditions drives global capital flow patterns that directly affect the ASX.
Kevin Warsh, the Fed, and What Rate Hike Probability Means for Australia
Markets are now pricing a higher probability of a Federal Reserve rate increase following the appointment of Kevin Warsh as Fed Chair under the Trump administration. Higher US rates strengthen the USD by increasing the relative yield differential that attracts international capital. A stronger USD exerts downward pressure on the Australian dollar, which has already weakened to approximately 70.87 US cents, reflecting this dynamic in real time.
The downstream consequences for Australian markets are threefold:
- Commodity price compression: Most globally traded commodities are priced in USD. A stronger dollar reduces the effective purchasing power of buyers transacting in other currencies, historically dampening demand and price levels.
- AUD earnings translation losses: Australian companies with USD revenue streams see reduced AUD-equivalent earnings when the currency weakens.
- Capital flow redirection: Higher US yields attract global capital toward USD assets, reducing marginal investment flows into emerging and commodity-driven markets including Australia.
Australia's Missing Piece: The AI Technology Gap
Why the ASX Is Sitting Out the Rally
Across Asia-Pacific markets, a renewed artificial intelligence thematic rally is lifting indices that have meaningful exposure to the semiconductor and AI hardware ecosystem. South Korea's KOSPI, Japan's Nikkei, Taiwan's TWSE, and Chinese mainland indices are all participating in the momentum that continues to drive Wall Street to fresh record highs, even as US macroeconomic data deteriorates.
Australia has no material participation in this rally because the ASX carries no significant exposure to the technology sub-sectors driving it. The companies generating the valuation re-ratings that are lifting index levels in comparable markets are AI chip designers, semiconductor fabricators, and advanced materials suppliers. These businesses are concentrated in:
- United States: NVIDIA, AMD, Broadcom and related supply chains.
- Taiwan: TSMC and its foundry ecosystem.
- South Korea: Samsung and SK Hynix in advanced memory.
- Japan: Semiconductor equipment manufacturers and specialty chemicals suppliers.
Australia's technology sector is dominated by data centre operators and business software companies. These are legitimate businesses with defensible revenue models, but they do not participate in the multiple expansion that AI hardware thematic momentum delivers. Without a domestic AI hardware ecosystem, the ASX is systematically excluded from the re-rating cycle that is lifting technology-weighted indices globally.
This structural gap is not a cyclical problem that resolves as market conditions normalise. It reflects Australia's underlying economic specialisation in resources extraction, financial services, and domestic consumer businesses. The ASX performs well during commodity supercycles and inflationary periods with strong terms-of-trade effects. It does not perform well during technology-driven growth rallies that bypass its core sector composition entirely.
The next major ASX story will hit our subscribers first
Scenario Mapping: Three Pathways for the ASX From Here
| Scenario | Brent Crude Range | ASX 200 Direction | Probability |
|---|---|---|---|
| De-escalation / Diplomatic breakthrough | Below US$90/bbl | Strong relief rally | Low near-term |
| Status quo / Diplomatic stalemate (base case) | US$100 to US$110/bbl | Range-bound, sector divergence | Moderate to high |
| Escalation / Further infrastructure targeting | Above US$115/bbl | Broad-based decline | Low but non-negligible |
Scenario One: Brent retreats below US$90 per barrel. This requires a meaningful de-escalation of Middle East conflict, a credible diplomatic resolution affecting Iranian energy infrastructure, or a coordinated supply response from OPEC+ that more than offsets current disruptions. Given the current geopolitical trajectory, this outcome appears unlikely in the near term, though it cannot be excluded over a longer horizon if diplomatic engagement accelerates.
Scenario Two: Base case, sustained $100 to $110 range. The most probable outcome given current signals. Diplomatic stalemate persists, Brent trades within its current band, and the ASX falls as Brent crude stays above $100 a barrel in range-bound territory with significant sector divergence. Copper-exposed miners outperform gold producers. Consumer discretionary and transport-dependent businesses face continued margin compression. The AUD remains under pressure near the 70 cent level.
Scenario Three: Escalation above US$115 per barrel. Renewed military activity targeting additional energy infrastructure or a significant supply disruption event not currently priced by markets. This scenario creates the most challenging policy environment for Australian authorities, forcing a difficult trade-off between addressing imported inflation and supporting slowing domestic growth.
Frequently Asked Questions
Why does high oil specifically hurt the ASX more than other markets?
Australia's progressive exit from domestic petroleum refining over the past two decades leaves the country as a net importer of refined petroleum products. When global crude prices rise, the cost increase passes directly and rapidly into Australian fuel, freight, and industrial input costs with limited domestic buffering capacity. This creates faster and more complete transmission of oil price shocks into corporate earnings across mining, retail, and transport-dependent sectors.
Can the ASX recover while Brent crude stays above $100?
Isolated sector recovery is possible, particularly for upstream energy producers and well-hedged copper miners. However, broad index gains are structurally constrained when energy costs remain at these levels. The consumer, financial services, and transport sectors collectively represent a large share of ASX index weighting, and all face meaningful margin pressure when fuel and energy costs stay elevated.
Why is gold not protecting investors during this period of geopolitical stress?
Gold's traditional safe-haven function is being suppressed by rising US rate hike expectations, which strengthen the dollar and reduce gold's relative appeal compared to yield-bearing USD assets. Capital is rotating toward US treasuries and USD cash positions rather than gold, keeping the gold price range-bound despite elevated geopolitical risk. Gold responds to real USD yields more than to geopolitical headlines when the two forces conflict.
What sectors historically outperform when oil sustains above $100?
Upstream energy producers with direct oil revenue exposure, copper miners with strong commodity price tailwinds, and currency-hedged exporters tend to outperform. Domestic consumer, retail, and transport-dependent businesses typically underperform as fuel cost inflation compresses margins and reduces discretionary consumer spending.
This article is for informational purposes only and does not constitute financial advice. Past market performance does not guarantee future outcomes. Readers should conduct independent research and consult a licensed financial advisor before making any investment decisions. Forecasts and scenario projections represent analytical frameworks, not predictions.
Want to Identify ASX Mineral Discoveries Before the Broader Market Does?
While macro headwinds from elevated oil prices and inflation continue to weigh on the ASX, significant mineral discoveries can still generate substantial returns regardless of broader index conditions — Discovery Alert's proprietary Discovery IQ model delivers real-time alerts on significant ASX discoveries the moment they are announced, turning complex data across 30+ commodities into clear, actionable opportunities. Explore historic discovery returns on Discovery Alert's dedicated discoveries page and begin a 14-day free trial to position ahead of the market.