
June 22, 2026
When Gold Loses Its Shine: Understanding the Mechanics Behind a 25% Drawdown
Commodity markets have a long history of confusing short-term noise with long-term signal. During the 2013 gold selloff, retail investors panicked as gold dropped more than 28% in a matter of months — only for the metal to re-establish its role as a critical reserve asset over the following decade. Today's environment carries recognisable echoes of that period. A surging US dollar, a Federal Reserve leaning hawkish, and a gold price in visible retreat have combined to shake confidence in ASX gold miners buy the dip narratives. Yet the underlying demand architecture for gold has not cracked. Understanding why requires separating the mechanics of monetary policy transmission from the fundamentals of gold's safe-haven role in global portfolios.
When big ASX news breaks, our subscribers know first
The Real Reason Gold Is Falling Right Now
Gold's recent decline has very little to do with waning investor appetite for the metal and everything to do with the macroeconomic conditions that govern how it is priced. Gold is a non-yielding asset, meaning it generates no interest, dividend, or coupon income. In a world where interest rates are rising and the US dollar is strengthening, gold faces a mechanical valuation headwind that is almost entirely independent of physical demand.
The transmission mechanism works like this:
- The Federal Reserve signals tighter monetary policy or holds rates at restrictive levels with a hawkish bias.
- US Treasury yields rise in response, increasing the opportunity cost of holding gold versus interest-bearing assets.
- The US dollar strengthens as global capital flows toward higher-yielding American assets.
- Because gold is priced in USD, a stronger dollar means gold becomes more expensive in every other currency, compressing international demand and triggering institutional selling.
- Gold miners, whose revenues are directly tied to the gold price but whose cost bases are largely fixed, experience amplified earnings pressure — often declining two to four times as fast as the underlying metal.
"The inverse relationship between gold and the US dollar is one of the most durable correlations in modern financial markets. When the dollar rises and real interest rates follow, gold faces systematic selling pressure that reflects monetary arithmetic, not a collapse in demand fundamentals."
The current Fed posture encapsulates this dynamic precisely. Under the leadership of new Chair Kevin Warsh, the Federal Reserve held rates steady at its most recent meeting but delivered markedly hawkish forward guidance. A notable 9 of 19 FOMC officials now project at least one additional rate increase before the end of 2026. Futures markets have priced in approximately a 70% probability of a rate hike by September 2026 — a shift in expectations that alone is sufficient to trigger institutional repositioning out of gold and gold-adjacent equities. ASX gold stocks have plunged following the Fed hold, reinforcing just how sensitive mining equities are to central bank signalling.
How the US Dollar Creates a Double Compression Effect
For investors outside the United States, a rising USD creates a particularly damaging dynamic that is often underappreciated. When the dollar strengthens, non-US gold investors suffer a dual hit: the spot price of gold falls in USD terms, and simultaneously their local currency weakens against the dollar, meaning their effective loss in local currency terms is compounded.
For Australian investors holding ASX gold miners, this matters considerably. The AUD/USD exchange rate acts as a multiplier on gold price movements. A falling gold price combined with a weakening Australian dollar against a stronger USD can produce a scenario where Australian dollar gold prices fall faster than the headline USD gold price suggests.
This is one reason ASX gold miner share prices sometimes overshoot to the downside relative to what the spot gold price decline alone would imply. The USD Index reaching a 13-month high in the current environment is therefore not merely a footnote — it is a primary catalyst for the scale of the recent gold price correction.
Gold Price Correction: Putting the Numbers in Context
The speed and magnitude of gold's retreat from its January 2026 peak has caught many investors off guard. The following data snapshot captures the key dimensions of the current selloff:
| Metric | Data Point |
|---|---|
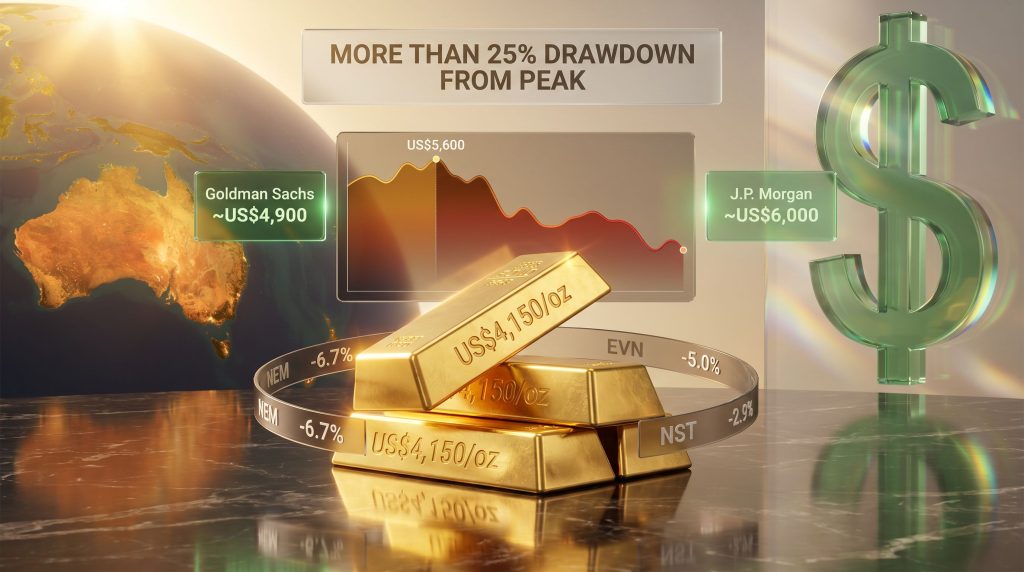
| Current gold price (approx.) | ~US$4,150/oz |
| January 2026 record high | ~US$5,600/oz |
| Drawdown from peak | >25% |
| Consecutive weeks of decline | 3 weeks |
| USD Index movement | 13-month high |
| FOMC members projecting a rate hike | 9 of 19 |
| Market-implied probability of September hike | ~70% |
A drawdown exceeding 25% sounds alarming in isolation. However, historical precedent puts it in perspective. During the 2016 post-election gold correction, the metal fell roughly 15% in two months before resuming its upward trajectory. The 2018 Fed tightening cycle produced a ~15% decline.
A 25%+ correction from a record high, while painful, is not structurally unusual during periods of aggressive monetary policy repricing — particularly when the preceding rally was as steep as gold's move from under US$2,000 in early 2024 to above US$5,600 by January 2026. Furthermore, the current gold price forecast from major institutions continues to suggest meaningful recovery potential from these levels.
Asset management firms focused on precious metals, including VanEck, have publicly characterised the current drawdown as consistent with a normal correction within a continuing bull market rather than evidence of a trend reversal. Historically, gold bull markets have regularly absorbed corrections of 20–30% before resuming their primary uptrend.
Why ASX Gold Miners Fall Harder Than the Metal
The Operating Leverage Dynamic Explained
One concept that many retail investors underestimate when entering the gold mining sector is operating leverage. Unlike owning physical gold or a gold ETF, gold mining companies carry substantial fixed cost bases: labour, energy, mine infrastructure, environmental compliance, and capital equipment maintenance. These costs do not move in proportion to the gold price.
This structure creates a lever effect. When the gold price rises by 10%, a miner with fixed costs absorbing a large share of revenue might see its profit margin expand by 30–40%. But the same mechanism works ruthlessly in reverse. A 10% fall in gold can translate to a 20–40% decline in profitability, depending on where a miner sits on the cost curve. This is precisely how gold prices affect mining equities so dramatically during volatile periods.
The critical metric for evaluating resilience in this environment is All-In Sustaining Cost (AISC) — the comprehensive measure of what it costs a miner to produce one ounce of gold, including sustaining capital expenditure. Miners with AISC well below the prevailing gold price maintain meaningful margin buffers even during extended price corrections. High-cost producers with AISC approaching or exceeding current prices face genuine financial distress.
Recent ASX Gold Miner Performance
The recent selloff hit across the board, with some of the largest ASX-listed producers posting significant single-session declines:
| ASX Gold Miner | Ticker | Single-Day Decline | Operational Notes |
|---|---|---|---|
| Newmont Corporation | ASX: NEM | -6.7% | World's largest gold producer by output; global cost base |
| Evolution Mining | ASX: EVN | -5.0% | Recovered strongly from mid-period lows; institutional buyer support evident |
| Northern Star Resources | ASX: NST | -2.9% | Facing output reductions and ongoing cost pressures ahead of selloff |
Despite these single-day moves, the majority of major ASX gold miners remain considerably above their 12-month lows, which is an important structural signal. The fact that Evolution Mining demonstrated a meaningful recovery from its intra-period trough suggests that institutional capital is viewing lower prices as an accumulation opportunity rather than a reason for wholesale sector abandonment.
Northern Star's more contained single-day fall is somewhat misleading in isolation — the company had already been under pressure from operational challenges including earlier production guidance downgrades and persistent cost inflation, meaning some of its valuation risk had already been partially discounted before the broader selloff began.
The Bull and Bear Case for ASX Gold Miners: A Balanced Framework
Structural Supports That Remain Intact
The case for remaining constructive on ASX gold miners rests on a set of demand drivers that operate independently of short-term interest rate cycles:
- Central bank gold accumulation: Central bank gold demand has reached a record pace for three consecutive years. Approximately 70% of surveyed central banks have indicated plans to increase their gold reserve holdings further in 2026, according to the World Gold Council's annual survey. This represents a structural shift in reserve asset allocation that has very little sensitivity to Fed policy.
- Sovereign debt dynamics: Government debt-to-GDP ratios across major economies remain at historically elevated levels. In environments where fiscal sustainability is questioned, gold's role as a sovereign-risk-free reserve asset becomes more pronounced, not less.
- Geopolitical risk premium: Persistent geopolitical tensions across multiple theatres continue to support gold's safe-haven bid. Unlike monetary policy-driven demand, geopolitical risk appetite does not diminish when interest rates rise.
- Analyst price consensus remains well above current levels:
| Institution | End-2026 Gold Price Target | Premium to ~US$4,150/oz |
|---|---|---|
| Goldman Sachs | ~US$4,900/oz | ~+18% |
| J.P. Morgan | ~US$6,000/oz | ~+45% |
"Even after revising targets downward to reflect the impact of dollar strength and Fed hawkishness, major institutional forecasters continue to project gold prices materially above current levels by end-2026. This sustained analyst conviction suggests the current selloff may reflect a timing dislocation rather than a fundamental repricing of gold's long-run value."
Why Caution Is Also Warranted
The bear case is not trivial and should not be dismissed by investors considering whether to act on the current ASX gold miners buy the dip opportunity:
- If the Federal Reserve follows through on the rate hike trajectory currently projected by 9 of its 19 officials, real yields will continue rising, sustaining downward pressure on gold.
- Technical analysis of major gold miner charts, including Newmont, has flagged bearish pattern formations that certain analysts interpret as signals of further near-term downside before any recovery.
- High-cost producers carrying leveraged balance sheets face disproportionate earnings risk in a sustained price downturn, including potential dividend cuts and dilutive equity raises.
- Broader risk-off conditions in global equity markets could drag gold equities lower even in an environment where the spot gold price stabilises, because mining equities trade as risk assets rather than defensive positions during broad market selloffs.
The next major ASX story will hit our subscribers first
How to Screen ASX Gold Miners During a Price Correction
The Five-Factor Operational Assessment
For investors approaching the question of whether to buy ASX gold miners during the current dip, the following screening framework helps separate resilient operators from vulnerable ones:
- All-In Sustaining Cost (AISC): Miners with AISC materially below US$2,000/oz maintain profitability even if gold retreats further from current levels. AISC above US$2,500/oz creates genuine margin vulnerability.
- Balance Sheet Strength: Net debt levels and cash reserve positions determine which miners can sustain dividends, fund operations, and avoid dilutive capital raises during prolonged price weakness. Low net debt is a critical safety buffer.
- Production Trajectory: Miners with growing or stable production profiles are structurally better positioned than those managing reserve depletion, ore grade decline, or operational disruptions. Grade decline is a particularly underappreciated risk in mature mining operations.
- Hedging Policy: Some ASX gold miners use forward sales contracts to lock in a portion of future production at a set gold price. This hedging provides earnings protection in a falling price environment but caps the upside leverage that makes gold miners attractive in a recovery.
- Cost Inflation Exposure: Labour, diesel, and consumable costs across the Australian mining sector continue to rise structurally. Miners operating in lower-cost jurisdictions or with access to renewable energy infrastructure are better insulated from ongoing cost inflation pressures.
ETF Alternatives for Diversified Exposure
Investors who prefer sector-level exposure without the single-stock risk of individual miner selection can access the sector through several vehicles. In addition, understanding the distinction between physical gold vs ETFs is essential before committing capital in either direction.
| ETF | ASX Ticker | Exposure Type |
|---|---|---|
| VanEck Gold Bullion ETF | NUGG | Physical gold bullion |
| VanEck Vectors Gold Miners ETF | GDX | Global gold mining equities |
| Global X Physical Gold | GOLD | Physical gold bullion |
GDX in particular provides exposure to a basket of global gold producers, including major ASX-listed names, reducing idiosyncratic operational risk while retaining the core gold price cycle thesis. Analysts at Macquarie have similarly pointed to buying the dip in ASX gold stocks as a compelling strategy for those with a medium-term investment horizon.
Three Scenarios for the Second Half of 2026
Scenario 1: Dollar Peaks, Fed Signals a Pause (Bull Case)
US economic data softens sufficiently to prompt the Fed to signal a halt to the tightening cycle. The dollar retreats, real yields compress, and gold recovers toward the US$4,800–5,000 range. ASX gold miners with strong balance sheets and low AISC deliver disproportionate earnings upside. Entry at current levels proves rewarding for investors with a six to twelve month horizon.
Scenario 2: Sideways Consolidation (Base Case)
The Fed delivers one rate hike, the dollar stabilises, and gold trades in a US$3,900–4,400 band through the second half of 2026. Gold miner earnings remain solid at these price levels for low-cost producers. However, high volatility and wide stock dispersion make individual company selection the critical variable.
Scenario 3: Extended USD Strength (Bear Case)
Multiple rate hikes materialise, the USD index extends its rally, and gold tests the US$3,500–3,800 range. High-cost and leveraged ASX gold miners face earnings pressure sufficient to trigger dividend cuts and equity raises. A sector-wide de-rating becomes possible for the weakest operators, even as low-cost miners with strong cash positions remain financially stable.
Frequently Asked Questions: ASX Gold Miners Buy the Dip
Why are ASX gold miners selling off if gold demand is structurally strong?
The current selloff is driven by the mechanics of monetary policy — US dollar strength and hawkish Federal Reserve signalling — rather than any deterioration in gold's fundamental demand picture. At approximately US$4,150/oz, gold remains at historically elevated levels. The correction reflects a repricing of near-term rate expectations, not a reassessment of gold's long-term investment case.
What separates a safe gold miner from a vulnerable one during a correction?
The primary differentiators are AISC relative to the current gold price, balance sheet quality, and production stability. Miners with low costs, minimal debt, and consistent output profiles are best positioned to sustain profitability and dividends even if the gold price falls further from here.
Is the ASX gold miners buy the dip thesis worth acting on for long-term investors?
For investors with conviction in gold's multi-year structural bull case and a tolerance for near-term volatility, current price levels may represent an attractive entry point. However, investors should be aware that further downside is possible if the dollar continues to strengthen or additional Fed rate hikes materialise. Prioritising quality over high-beta speculation is the most defensible approach in the current environment.
How do gold ETFs compare to individual ASX gold miner stocks during selloffs?
Gold ETFs provide diversification across multiple operators, reducing exposure to company-specific risks such as operational failures or management missteps. They typically exhibit lower volatility than individual small and mid-cap gold miners during sharp selloffs. The tradeoff is a dilution of the upside that high-performing individual names can generate in a recovery.
What are major bank gold price forecasts for end-2026?
Goldman Sachs is targeting approximately US$4,900/oz while J.P. Morgan carries a more bullish forecast of around US$6,000/oz. Both targets sit materially above the current price of approximately US$4,150/oz, suggesting significant analyst conviction in a recovery — though these represent forecasts, not guarantees, and are subject to revision as the macro environment evolves.
Quality Over Speculation: The Guiding Principle for This Market
The weight of evidence points to a correction driven by monetary mechanics rather than a structural breakdown in gold's investment thesis. Central bank demand remains robust, sovereign debt concerns continue to underpin gold's reserve asset status, and major institutional forecasters maintain price targets well above current levels for the remainder of 2026.
At the same time, the bear case carries enough credibility to warrant discipline. Investors chasing the highest-beta ASX gold miners in search of maximum recovery leverage are accepting meaningful downside risk if the dollar strengthens further or the Fed tightens more aggressively than markets currently expect.
The more resilient approach focuses on miners with proven cost discipline, clean balance sheets, and stable production trajectories. These companies will generate strong free cash flow across a wide range of gold price outcomes, maintain their dividends in a downturn, and deliver disproportionate earnings upside when the macro headwinds inevitably abate.
The question of whether to treat the ASX gold miners buy the dip thesis as actionable ultimately depends on time horizon, risk tolerance, and a clear-eyed assessment of where specific miners sit on the cost curve. Those criteria, rather than short-term price momentum, should drive the decision.
"Risk Disclosure: This article is general in nature and does not constitute financial advice. All investment decisions should be made in consultation with a licensed financial adviser and based on individual circumstances and risk tolerance. Past performance is not indicative of future results. Forecasts and price targets cited represent analyst estimates and are subject to revision."
Want to Stay Ahead of the Next Major ASX Mineral Discovery?
While understanding gold price mechanics is essential for investors, timing the market on individual miners remains challenging — Discovery Alert's proprietary Discovery IQ model instantly scans ASX announcements across 30+ commodities, delivering real-time alerts on significant mineral discoveries directly to subscribers. Explore historic discovery returns on Discovery Alert's discoveries page and begin a 14-day free trial to position yourself ahead of the broader market.