July 28, 2026
The Structural Forces Rewriting the Rules of Monetary Value
Every generation or so, the global financial system reaches an inflection point where the accumulated weight of monetary expansion becomes impossible to ignore. Asset prices begin to behave less like reflections of underlying economic activity and more like pressure gauges measuring the deterioration of fiat currency purchasing power. That inflection point has arrived. Precious metals, long regarded as relics of a pre-digital monetary era by some analysts, are now printing silver and gold all-time highs that demand serious structural explanation, not dismissal as speculative noise.
Understanding why these records are being set, and whether they represent a ceiling or a floor, requires going deeper than headline price data. The real story lives in monetary mechanics, central bank behaviour, industrial supply dynamics, and the growing consensus among institutional allocators that the post-2008 monetary experiment has permanently altered the risk profile of sovereign debt.
When big ASX news breaks, our subscribers know first
How High Have Silver and Gold Actually Gone?
The scale of the moves in both metals over 2025 and into early 2026 is historically significant. The following table captures the key price milestones:
| Metal | All-Time High Price | Date Achieved | Approximate YTD Gain at Peak |
|---|---|---|---|
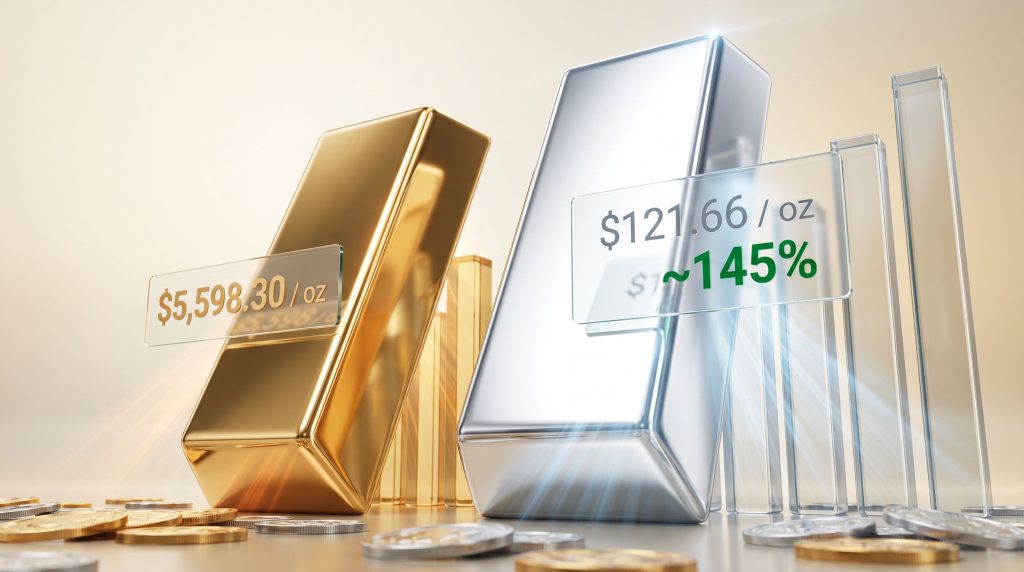
| Gold | $5,598.30 / oz | January 29, 2026 | ~70% |
| Silver | $121.66 / oz | January 29, 2026 | ~145%+ |
| Gold (Prior Record) | $4,497.55 / oz | December 23, 2025 | – |
| Silver (Prior Record) | $71.06 / oz | December 23, 2025 | – |
Silver's approximate 145% gain from the start of 2025 to its January 2026 record makes it one of the strongest-performing major commodities across modern financial history. Gold's roughly 70% gain over the same period is itself exceptional, but silver's outperformance reveals something structurally distinct about its demand profile, a point explored in detail further below.
To contextualise these figures properly, inflation-adjusted analysis matters. Gold's 1980 peak of around $850 per ounce translates to well over $3,000 in today's purchasing power terms. The fact that gold has now surpassed $5,500 in nominal terms reflects both genuine monetary repricing and the compounding effect of decades of currency debasement. For further context on current pricing, live gold and silver price charts provide a useful real-time reference. These are not merely speculative bubble prices; they represent the market's running verdict on fiat currency stewardship.
The Four Primary Drivers Behind Silver and Gold All-Time Highs
Central Bank Accumulation Creating a Structural Demand Floor
One of the most consequential but underreported developments in the precious metals market is the acceleration of central bank gold demand. China's sovereign gold buying has shown a steep increase in recent periods, contributing to a broader trend of emerging market central banks rotating away from US dollar-denominated reserve assets.
This matters for a specific reason that retail investors often overlook: when central banks accumulate gold, that supply is effectively removed from the open market and placed into long-duration, largely illiquid holdings. Unlike speculative positions that can be unwound quickly, sovereign gold reserves tend to be held across political cycles and economic downturns. This creates a structural demand floor beneath the price that is qualitatively different from fund inflows or retail buying.
The broader rotation away from US Treasuries as the world's primary reserve asset is a slow-moving but powerful force. As more sovereign institutions treat precious metals as a genuine monetary reserve rather than a legacy holdover, the addressable demand base for gold expands structurally, not cyclically.
Dollar Weakness and the Self-Reinforcing Feedback Loop
Precious metals are priced primarily in US dollars, which creates an important dynamic: when the dollar weakens, the USD price of gold and silver rises even if the metal's value in other currency terms remains relatively stable. This relationship has been a significant contributor to recent price gains.
The inverse correlation between dollar strength and precious metals valuations is well established, but its current intensity reflects something deeper. A weakening reserve currency signals reduced global confidence in US fiscal and monetary management, which simultaneously drives investors toward hard assets and amplifies the USD-denominated price of those assets. The feedback loop is self-reinforcing: dollar weakness begets metals appreciation, which attracts further capital rotation away from dollar assets.
Geopolitical Risk Rotation: The Counterintuitive Dynamic
Conventional wisdom holds that gold rises during periods of geopolitical stress as investors seek safe havens. However, what is less widely appreciated is the dynamic that occurs when geopolitical tensions begin to ease. As risk-off positioning unwinds, traders reduce their exposure to dollar-denominated safe haven instruments. Rather than rotating back into equities or bonds, a significant portion of that capital has been moving directly into precious metals as a hedge against monetary risk rather than geopolitical risk.
This counterintuitive behaviour, where gold and silver can rise in both risk-on and risk-off environments depending on the underlying monetary backdrop, reflects a maturation in how sophisticated allocators think about the metals. Furthermore, understanding gold's safe-haven role is increasingly essential for positioning a resilient portfolio. They are no longer purely crisis instruments; they are monetary instruments responding to the long-term erosion of fiat purchasing power.
Silver's Industrial Demand: An Asymmetric Advantage
Silver occupies a structurally unique position in the commodities universe. It functions simultaneously as a monetary metal, responding to the same macro forces as gold, and as an industrial commodity with expanding physical demand from renewable energy infrastructure, electronics manufacturing, and electrification supply chains. Solar panel production alone consumes an enormous and growing volume of silver annually, with estimates suggesting that the solar industry accounts for a significant and rising share of total industrial silver demand.
Silver's dual demand profile creates what analysts describe as an asymmetric upside structure. During monetary bull markets, silver benefits from the same forces driving gold. During periods of industrial expansion, its demand floor is independently supported. The combination produces larger percentage moves than gold, with the 145% gain versus gold's 70% being a live demonstration of this dynamic.
Silver Versus Gold: Comparing the Two Metals
| Factor | Gold | Silver |
|---|---|---|
| Primary Demand Driver | Monetary / Central Bank | Industrial + Monetary |
| Approximate YTD Gain (2025) | ~70% | ~145% |
| All-Time High (January 2026) | $5,598.30 / oz | $121.66 / oz |
| Central Bank Buying | Strong | Minimal |
| Price Volatility | Lower | Higher |
| Store of Value Role | Dominant | Secondary |
One of the most useful analytical tools for assessing the relative value between the two metals is the gold-silver ratio analysis. Historically, this ratio has averaged somewhere between 40:1 and 70:1 across long cycles. When the ratio stretches significantly above this range, it has tended to signal that silver is undervalued relative to gold and that a mean reversion phase, characterised by silver outperformance, is likely approaching. Silver's recent 145% gain reflects exactly this kind of late-stage bull market catch-up, a pattern that has repeated across multiple precious metals cycles.
What the Interest Rate Environment Means for Precious Metals
Reading the Policy Signals Beyond the Headlines
Interest rate decisions carry enormous weight for precious metals pricing because real yields, the return on bonds after inflation, represent the opportunity cost of holding non-yielding assets like gold and silver. When real yields are low or negative, the cost of holding precious metals diminishes and their relative attractiveness increases.
The case for rates remaining unchanged in the current environment rests on a careful reading of multiple data inputs simultaneously: core inflation trends, employment figures, and money supply growth collectively point toward a posture that is prudent but not aggressively restrictive. An overcorrection toward hawkishness at this stage of the cycle carries significant policy error risk.
A useful cautionary reference point is the European Central Bank's decision to raise rates by 25 basis points during a period when commodity prices were already declining. That decision has been widely criticised as a policy error, tightening conditions into a softening demand environment rather than allowing the disinflationary signal from commodity markets to work through the system. A similar mistake from the Federal Reserve would likely create unnecessary economic damage without meaningfully addressing the monetary conditions driving precious metals appreciation.
The Goldilocks Inflation Scenario
The distinction between persistent inflation and accelerating inflation is critical for precious metals investors. A sustained but moderate inflationary backdrop provides the most historically favourable conditions for long-term appreciation in gold and silver, more so than either a deflationary collapse or a hyperinflationary spiral.
This is because hyperinflation typically triggers aggressive policy responses that can disrupt markets broadly, while deflation collapses the nominal price of most assets. It is the persistent middle zone, where purchasing power erodes steadily but without triggering crisis-mode policy responses, that historically produces the most durable precious metals bull markets. The gold and bond dynamics at play across economic cycles further illustrate why this inflationary middle ground tends to be so favourable for hard assets.
Portfolio Positioning in a High Money Supply Environment
Structural Allocation Principles
The framework for building a portfolio suited to an environment of persistent monetary expansion involves rethinking the traditional role of sovereign bonds. With real yields suppressed and government debt levels at historic highs across developed economies, the risk-adjusted return profile of sovereign bonds has deteriorated significantly. A portfolio that remains heavily weighted toward these instruments is structurally exposed to ongoing purchasing power erosion.
Key allocation principles for this environment include:
- Reducing sovereign bond weighting as real yields remain suppressed relative to inflation
- Increasing gold and silver allocation as a percentage of total portfolio value
- Maintaining exposure to calculated risk assets including small and mid-cap equities
- Selectively evaluating beaten-down bonds with strong underlying cash flow and solid solvency metrics, which can provide portfolio cushioning
- Considering emerging market equity exposure in economies that have been disproportionately discounted during periods of geopolitical risk
The Russell 2000 index of smaller US companies represents one area identified by macro-focused analysts as having continued momentum potential. Similarly, certain emerging market equities that were heavily sold during periods of elevated geopolitical tension may now offer recovery value as that risk premium unwinds.
The Silent Danger of Excessive Conservatism
One of the most counterintuitive but important insights for younger investors is that excessive conservatism in an inflationary environment is not a safe position. It is a guaranteed slow erosion of real wealth. Holding excess cash or short-duration bonds when money supply growth is structurally elevated means accepting negative real returns year after year, compounding across a lifetime of savings.
The generational wealth argument for precious metals exposure is not about speculation. It rests on the straightforward arithmetic that currencies are losing purchasing power at an accelerating rate driven by government spending trajectories that show no credible path to reversal. Young investors in particular face the longest exposure window to this erosion and therefore have the most to gain from adjusting their portfolio framework accordingly.
One important warning for investors currently considering commodity exposure: oil markets are showing signs of extreme leverage concentration. Heavily levered long positions have been building, and margin call pressure is mounting. This creates a high-risk environment for new long positions in oil at current price levels, and macro analysts are treating the sector with significant caution.
The next major ASX story will hit our subscribers first
Long-Term Scenarios for Precious Metals Prices
| Scenario | Macro Conditions | Gold Trajectory | Silver Trajectory |
|---|---|---|---|
| Base Case | Persistent inflation, stable rates | Continued measured appreciation | Outperforms gold |
| Bull Case | Dollar collapse, accelerating money supply | Parabolic upside potential | Extreme outperformance |
| Bear Case | Deflationary shock, aggressive rate spike | Short-term correction likely | Deeper pullback, but faster recovery |
The base case rests on the assumption that global money supply growth continues at its current trajectory, that central banks maintain a cautious but not aggressively restrictive posture, and that dollar weakness persists without tipping into outright crisis. Under these conditions, both metals continue to appreciate, with silver likely maintaining its outperformance due to ongoing industrial demand growth.
The bull case requires a more dramatic deterioration in confidence in US fiscal management, potentially accelerated by a loss of reserve currency status at the margin. This scenario would see capital flight into hard assets at a scale that could produce price moves significantly beyond current levels.
The bear case, while possible, is historically the least durable for precious metals. Even during deflationary episodes like 2008, gold's drawdown was relatively shallow and its recovery rapid, because the policy response to deflation, aggressive monetary expansion, is itself a long-term tailwind for hard assets. Consequently, the structural argument for holding precious metals remains compelling across all three scenarios.
Frequently Asked Questions: Silver and Gold All-Time Highs
Will Silver Hit New All-Time Highs Again After January 2026?
Based on the structural drivers currently in place, including money supply growth, industrial demand expansion, and the ongoing monetary reserve rotation, the macro framework supporting further appreciation remains intact. Forecasts of this nature are inherently speculative and no investment outcome is guaranteed. For additional perspective, this analysis of silver's record surge offers useful context on what drove the most recent milestones.
Why Is Silver Rising Faster Than Gold Right Now?
Silver's dual role as both a monetary metal and an industrial commodity means it benefits from two independent demand streams simultaneously. Its historically wide gold-to-silver ratio also made it a candidate for catch-up appreciation as the precious metals bull market matured. These dynamics combine to produce larger percentage moves than gold in late-stage bull market environments.
What Happens to Precious Metals If the Fed Cuts Rates?
Rate cuts reduce the opportunity cost of holding non-yielding assets like gold and silver, which is generally supportive of higher prices. More importantly, rate cuts signal that monetary conditions are loosening, which aligns with the broader money supply growth thesis driving the current silver and gold all-time highs cycle.
Should I Buy Gold or Silver in the Current Market Environment?
Both metals serve different portfolio functions. Gold offers lower volatility and stronger institutional support through central bank buying. Silver offers higher potential upside with correspondingly higher volatility. A balanced allocation to both, sized appropriately within a diversified portfolio, reflects the most prudent approach for most investors. This article does not constitute financial advice and readers should consult a qualified financial professional before making investment decisions.
Five Forces Sustaining the Silver and Gold All-Time High Rally
-
Global money supply expansion is repricing all hard assets upward in fiat-denominated terms, and this structural force shows no credible reversal pathway
-
Central bank accumulation, particularly from China and other emerging market sovereign institutions, is removing physical supply from open markets and creating a durable demand floor
-
Dollar weakness amplifies USD-denominated precious metals prices and creates a self-reinforcing capital rotation feedback loop away from dollar assets
-
Silver's industrial demand from renewable energy, electrification, and electronics provides an independent demand foundation that pure monetary metals lack, supporting asymmetric upside
-
Investor repositioning away from overvalued risk assets, leveraged commodity plays, and real-yield-negative sovereign bonds is channeling sustained capital flows into precious metals as a monetary hedge
The silver and gold all-time highs recorded in early 2026 are not anomalies to be explained away. They are the market's most honest signal about the long-term consequences of monetary policy conducted across decades of expansionary fiscal management. Whether these price levels prove to be a staging point for further appreciation or a temporary peak will depend on policy decisions that remain genuinely uncertain. What is not uncertain is the structural logic that brought prices here.
Want to Capitalise on the Next Major ASX Mineral Discovery Before the Broader Market?
Discovery Alert's proprietary Discovery IQ model delivers real-time alerts on significant ASX mineral discoveries, transforming complex geological and commodity data into actionable investment insights for both short-term traders and long-term investors. Explore Discovery Alert's dedicated discoveries page to understand how historic finds have generated substantial returns, and begin your 14-day free trial today to position yourself ahead of the market.