
August 25, 2026
When Execution Fails: Reading Austin Engineering's FY26 Through an Operational Lens
Manufacturing businesses operating in capital-intensive sectors carry a structural vulnerability that is easy to overlook during periods of growth: their cost bases are largely fixed, meaning that when revenue falls, profitability does not decline proportionally. It collapses. This is not a flaw unique to any single company. It is an inherent characteristic of businesses that run fabrication facilities, maintain specialist workforces, and hold long-duration contracts with pricing assumptions embedded months or years before costs are incurred.
Understanding this dynamic is essential before examining Austin Engineering tough FY26 results, because the numbers alone risk being misread without that operational context. What unfolded across the 2025-26 financial year was not simply a revenue story. It was a case study in how execution risk accumulates silently inside a manufacturing business until it surfaces all at once in a single reporting period.
When big ASX news breaks, our subscribers know first
The Financial Architecture of a Difficult Year
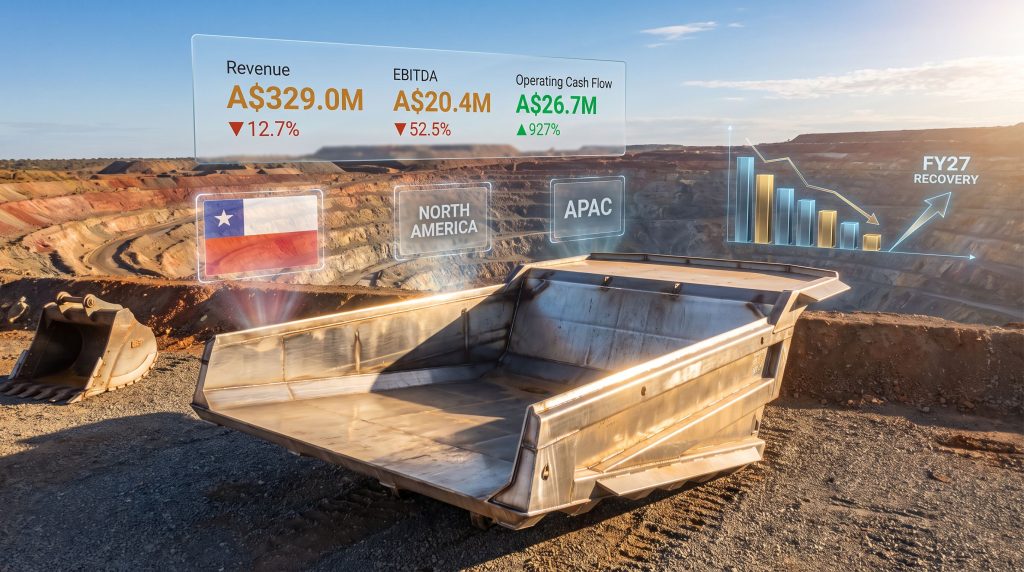
The headline figures from Austin Engineering's FY26 result carry significant weight. Revenue came in at A$329.0 million, down 12.7% from approximately A$376.9 million in the prior year. That contraction alone would have been manageable for most industrial businesses with flexible cost structures. However, the earnings impact was far from proportional.
| Financial Metric | FY26 Result | FY25 Result | Year-on-Year Change |
|---|---|---|---|
| Revenue | A$329.0M | ~A$376.9M | -12.7% |
| EBITDA | A$20.4M | ~A$43.0M | -52.5% |
| EBITDA Margin | 6.2% | 11.4% | -520 basis points |
| EBIT | A$10.8M | ~A$33.2M | -67.5% |
| NPAT | A$7.6M | ~A$27.8M | -72.7% |
| Operating Cash Flow | A$26.7M | A$2.6M | +927% |
| Free Cash Flow | A$19.9M | Negative | Positive |
A 12.7% revenue decline producing a 72.7% collapse in net profit after tax is not a normal operating leverage outcome. It signals that the business was simultaneously absorbing revenue loss and carrying the weight of specific cost events that compounded the underlying volume pressure. The EBITDA margin compression from 11.4% to 6.2% tells the same story. When a margin roughly halves on a revenue base that also shrank, the arithmetic points toward discrete, identifiable cost problems rather than a broad-based demand deterioration. Furthermore, industry consolidation trends across the mining equipment sector have added additional competitive pressure on suppliers already navigating thin margins.
The Chile Situation: Negative Margin Contracts and Their Hidden Costs
The most consequential single factor in FY26 was a loss-making legacy OEM contract in Chile, executed through Austin's La Negra manufacturing facility. The contract generated A$21.0 million in revenue while producing a negative A$5.7 million EBITDA contribution. That translates to an effective EBITDA margin of approximately -27%.
According to Austin Engineering's ASX announcements, the La Negra contract represented one of the most significant single-contract drags on group profitability in the company's recent history.
In contract manufacturing, a negative-margin contract is not simply unprofitable. It actively transfers value away from the business with every unit delivered. The more volume executed, the more value destroyed.
The nature of OEM contracts in the mining equipment sector makes these situations particularly difficult to exit. Original equipment manufacturer supply arrangements typically involve volume commitments, delivery schedules, and penalty clauses that create significant exit friction. A company facing a loss-making OEM agreement often cannot simply walk away without incurring termination costs that may exceed the projected ongoing losses.
This creates a compounding problem: management must weigh the cost of continuation against the cost of exit, while simultaneously defending the contract's existence to investors and analysts. Several important questions emerge from the Chile experience that extend beyond the immediate financial damage:
- Were input cost escalation clauses built into the original contract terms, or was pricing fixed at inception?
- Did the pricing environment shift materially between the contract award date and the execution phase, eroding the original margin assumptions?
- What internal review processes exist to flag a contract transitioning from marginal to loss-making before the losses become material?
- Was the La Negra facility's cost structure competitive with regional alternatives at the time of contract award?
These are not rhetorical questions. The answers would reveal whether the Chile problem was a one-time pricing misjudgement or a symptom of inadequate contract governance architecture. The distinction matters considerably for assessing whether Austin Engineering tough FY26 represents a contained episode or a repeatable risk.
North America: The Cost of Manufacturing Capacity Misalignment
Separately from the Chile issue, Austin Engineering's North American operations encountered a distinct set of operational headwinds. Internal productivity fell short of requirements, and the business responded by increasing reliance on external outsourcing to meet delivery commitments.
This is a pattern that carries a well-understood cost penalty in manufacturing. When a company outsources production that it would normally perform in-house, it typically pays a 15% to 30% cost premium over its own internal manufacturing cost base, depending on the product complexity and the availability of qualified subcontractors. That premium is captured entirely in cost of goods sold, compressing gross margin without any corresponding revenue offset.
The underlying cause of North America's outsourcing dependency could reflect several structural factors:
- Workforce capacity constraints driven by skilled labour availability in the region's fabrication sector
- Order intake growth outpacing facility throughput capacity during the preceding growth phase
- Equipment utilisation bottlenecks within owned facilities creating production timing mismatches
- Geographic misalignment between order origin and nearest manufacturing capacity
Each of these causes has a different remediation pathway and timeline. Labour constraints respond to recruitment and training investment over 12 to 18 months. Capacity constraints require capital allocation decisions with longer lead times. Geographic misalignment may require facility investment or strategic reconfiguration.
The Cash Flow Paradox: What the Numbers Beneath the Numbers Reveal
Perhaps the most analytically striking feature of Austin Engineering's FY26 result is the dramatic divergence between profitability and cash generation. Operating cash flow surged from A$2.6 million to A$26.7 million, a gain of more than 900%, even as NPAT fell by nearly three-quarters. Free cash flow turned positive at A$19.9 million after being negative in FY25.
In financial analysis, a profitability-cash flow divergence of this magnitude almost always reflects one or more of the following dynamics:
- Significant working capital release through inventory reduction, faster receivables collection, or slower payables outflow
- Reduced capital expenditure below the prior period's investment rate
- Improved billing and progress payment collection on long-duration contracts
- Deferred investment decisions freeing up cash that would otherwise have been deployed
The improvement in cash generation is a genuine positive signal. It demonstrates that the underlying business retains the capacity to convert revenue into cash effectively when working capital is actively managed. That capability is a prerequisite for funding any operational turnaround without resorting to external capital raising.
However, investors should be careful about over-extrapolating from a single period of strong cash generation. If the cash improvement was driven partly by inventory drawdowns, future periods may require restocking investment. If it reflected deferred capex, necessary equipment replacement or facility investment may create cash outflows in FY27 and beyond. In addition, data-driven mining operations are increasingly informing how equipment suppliers forecast working capital requirements across multi-year contract cycles.
Benchmarking FY26 Against Mining Equipment Sector Norms
Austin Engineering operates in a segment of the mining supply chain where margin expectations are well established. Truck trays, buckets, and related ground-engaging components are capital goods with meaningful fabrication complexity, but they are not high-precision engineered systems commanding premium margins. The sector's historical EBITDA margin benchmarks reflect that positioning.
| Performance Tier | EBITDA Margin Range | Operational Descriptor |
|---|---|---|
| Sector Leaders | 18-25% | Optimised, scalable platforms |
| Mid-Tier Performers | 10-17% | Stable, competitive operations |
| Under Pressure | 6-9% | Margin compression, execution risk elevated |
| Distressed Operations | Below 6% | Structural or contractual failure |
Austin Engineering's 6.2% EBITDA margin places it at the lower boundary of the "under pressure" tier. It has not yet entered distressed territory, but the buffer is thin. A further adverse contract outcome, a regional demand slowdown, or an input cost spike — particularly given current commodity price exposure across global mining supply chains — would be sufficient to push margins below 6% without any additional internal execution failures.
The Contract Governance Question: A Less-Discussed Industry Risk
One aspect of Austin Engineering's FY26 experience that deserves broader attention is what it reveals about contract risk governance in the mining equipment manufacturing sector. This is an area where industry-specific knowledge is valuable but not widely understood outside of sector specialists.
Mining equipment OEM supply contracts are typically awarded through competitive tender processes where pricing is locked for defined volumes over defined periods. The challenge is that steel input costs, labour rates, freight, and manufacturing overhead can shift materially between contract award and delivery. Unlike commodity-linked contracts in mining production, equipment supply agreements rarely include automatic cost escalation provisions.
This creates a structural risk that sits largely off the balance sheet until it crystallises. A contract awarded with a 12% gross margin assumption can become loss-making if steel prices rise 20% over an 18-month manufacturing cycle. That is not a hypothetical scenario. It is a risk that has materialised across multiple equipment manufacturers globally during periods of input cost volatility.
The appropriate risk management in mining environments includes several mechanisms that are standard in more sophisticated contract environments:
- Material cost pass-through provisions allowing price adjustment if input costs move beyond defined thresholds
- Stage-gate profitability reviews at defined contract milestones before volume escalation
- Margin floor triggers that elevate contracts to senior management review when projected margins deteriorate below a defined level
- Force majeure and contract renegotiation provisions that create a pathway for early commercial resolution when economics deteriorate significantly
Whether these mechanisms were absent, inadequately structured, or failed in practice is a question that Austin Engineering's management has an obligation to address clearly in the context of its FY27 guidance and operational commentary.
Scenario Pathways for FY27 and Beyond
The range of plausible outcomes for Austin Engineering over the next 12 to 36 months is genuinely wide, reflecting the combination of controllable operational factors and external market conditions.
Scenario A: Rapid Recovery (12-18 months)
- Chile legacy contract fully wound down with no further negative contribution
- North American productivity normalised through targeted restructuring
- EBITDA margin recovers toward 9-10% on a stable revenue base
- Free cash flow sustained above A$15 million annually
Scenario B: Gradual Stabilisation (18-36 months)
- Chile contract exits without additional losses but North American costs remain somewhat elevated
- Revenue growth resumes at a modest 3-5% annually
- EBITDA margin recovers to approximately 8% by the end of FY28
- Cash generation remains positive but constrained by reinvestment requirements
Scenario C: Prolonged Underperformance (36+ months)
- Additional contract or regional execution failures emerge before the Chile exit is completed
- Revenue growth stalls or contracts further
- Margin recovery is materially delayed and a capital structure review becomes necessary
The next major ASX story will hit our subscribers first
Key Metrics to Monitor in FY27
For investors, analysts, and industry observers tracking Austin Engineering's recovery trajectory, the following leading indicators will provide the clearest signal of whether operational improvement is genuine:
- Formal confirmation of the Chile contract exit with no residual financial liability
- North American segment EBITDA returning to positive territory on a sustained basis
- Group EBITDA margin crossing and holding above 8% as a recovery milestone
- Revenue stabilisation halting the multi-period decline before growth resumes
- Evidence of enhanced contract governance through disclosure of new risk management frameworks
- Working capital discipline maintaining the improved cash conversion achieved in FY26
- Capital expenditure trends revealing whether deferred investment is being addressed responsibly
The mining equipment replacement cycle provides a constructive external backdrop. Global mining capital expenditure is broadly expected to remain elevated through 2026 and 2027, particularly across copper, iron ore, and thermal coal production, as major producers invest in both fleet expansion and scheduled equipment replacement. This demand environment would assist Austin Engineering's revenue recovery if internal execution improves concurrently.
The Broader Lesson for Mining Equipment Investors
Austin Engineering tough FY26 experience offers a case study that extends beyond a single company's results. It illustrates several dynamics that are relevant to anyone assessing investment in the mining equipment and services sector. Consequently, understanding these dynamics has become increasingly important as mining industry trends point toward greater scrutiny of operational efficiency and contract governance across the supply chain.
Fixed-cost manufacturing businesses in the mining supply chain carry significant operational leverage, and that leverage accelerates losses as readily as it amplifies profits during growth phases. Contract risk governance is not a back-office function. It is a core strategic capability that determines whether growth in order intake translates into earnings growth or earnings destruction.
The divergence between cash flow and profitability in FY26 demonstrates that earnings quality and cash generation quality can move in opposite directions during operational transitions. Understanding which metric is more informative in a given period requires a granular understanding of working capital movements, not just headline financial metrics.
Finally, the APAC segment's experience — where lower tray volumes were partially offset by stronger bucket sales — illustrates the value of product portfolio breadth within a regional operation. Businesses with single-product exposure face the full force of demand volatility, while diversified product lines can provide meaningful natural hedging within the same customer base and geography. For further detail on the company's revised outlook, Austin Engineering's FY26 guidance update outlines the specific operational actions being taken to address the issues identified throughout this difficult year.
Want to Identify the Next Major ASX Mining Opportunity Before the Market Does?
While Austin Engineering's FY26 results highlight the complexities of operational risk in the mining supply chain, Discovery Alert's proprietary Discovery IQ model cuts through the noise by delivering real-time alerts on significant ASX mineral discoveries — explore the historic returns major discoveries have generated and begin your 14-day free trial to position yourself ahead of the broader market.