August 3, 2026
The Quiet Reorientation Reshaping How Australia Finds Its Minerals
Every decade or so, the mineral exploration industry undergoes a quiet but consequential reorientation. Not always driven by a single event, these shifts tend to emerge from the convergence of price signals, geological opportunity, and the evolving priorities of capital allocators. What is unfolding in Australia right now fits this pattern precisely, and Australia gold exploration spend tells the story with unusual clarity.
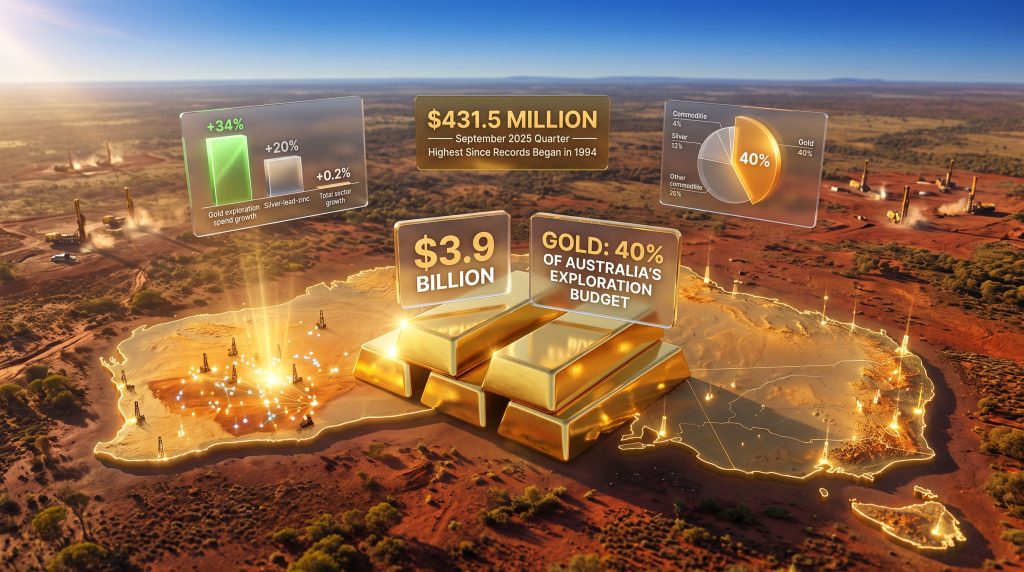
When a single commodity commands 40% of an entire nation's exploration budget, that is not a trend. It is a structural reorganisation of exploration priorities. Australia's $3.9 billion mineral exploration sector arrived at exactly this point in 2025, with gold absorbing a larger share of national drilling capital than at any point in recent recorded history, while the total budget itself barely moved.
Understanding what is driving this rotation, where the money is actually going, and what it means for Australia's resource production pipeline over the next two decades requires looking well beneath the headline figures.
When big ASX news breaks, our subscribers know first
Australia's Exploration Budget in 2025: Stability on the Surface, Rotation Underneath
National mineral exploration expenditure held at $3.9 billion in 2025, representing a marginal 0.2% increase on the prior year, according to the Australian Mineral Exploration Review (AMER), published annually by Geoscience Australia since 2009. The review draws on Australian Bureau of Statistics survey data and company-level reporting to construct a comprehensive picture of physical and financial exploration activity across the country.
On its face, flat total spend might suggest a sector treading water. The reality underneath is considerably more dynamic.
| Metric | 2025 Figure | Change vs. Prior Year |
|---|---|---|
| Total mineral exploration expenditure | $3.9 billion | +0.2% |
| Gold's share of total exploration | 40% | Up from ~29% in 2023 |
| Gold exploration spend growth | +34% | Year-on-year |
| Silver-lead-zinc exploration growth | +20% | Year-on-year |
| Maiden mineral resources identified | 69 | Across 50 projects |
| Critical mineral discoveries | 32 of 69 | Nearly 50% of new resources |
The divergence between gold's +34% annual spend growth and the sector's +0.2% total growth confirms what capital rotation looks like in practice. Exploration budgets are not expanding in aggregate; they are being redistributed, with gold capturing funds that would previously have been spread across a wider commodity universe.
Capital rotation within a constrained total budget is analytically distinct from sector-wide expansion. When gold grows 34% while total expenditure barely moves, every dollar flowing into gold is, in effect, a dollar being withdrawn from somewhere else.
Why Australia Gold Exploration Spend Is at a Multi-Year High
The Price Mechanism: How Spot Gold Redirects Drilling Capital
Exploration capital is among the most price-sensitive forms of investment in the resources sector. Unlike production capital, which is committed years in advance and difficult to redirect, exploration budgets can be reallocated between commodities within a single planning cycle. The gold price outlook for 2025 improved the internal rate of return on greenfield discovery materially, and junior operators, who make up a disproportionate share of exploration activity, responded quickly.
Gold's share of total Australian exploration expenditure was approximately 29% in 2023, equating to roughly $1.25 billion, itself a decline from $1.525 billion in 2022. The 2025 rebound to 40% of a $3.9 billion total therefore implies absolute gold exploration spending of approximately $1.56 billion, a multi-year high in both proportional and absolute terms.
The Australian Dollar Amplification Effect
A factor that receives insufficient attention in mainstream analysis is the role of currency dynamics in amplifying Australian gold exploration margins. Because gold is priced globally in US dollars, a relatively weaker Australian dollar increases the AUD-denominated gold price received by Australian operators, even when the USD spot price is unchanged. This currency translation effect materially improves operating margins for Australian-domiciled gold producers, freeing cash flow for reinvestment into exploration programs that might otherwise be deferred.
This dynamic helps explain why Australia gold exploration spend can surge even when global gold price movements appear modest in USD terms.
Reserve Depletion as a Structural Forcing Function
Beyond price, a deeper structural force is driving the surge in exploration activity. Major gold producers operating across the Yilgarn and other established districts face a well-documented challenge: ore grades at mature deposits are declining as the highest-quality material is progressively mined out. This grade deterioration compresses unit economics over time, creating an imperative to identify and develop replacement resources before production capacity falls.
For institutional investors, reserve life is a critical valuation metric. Producers that demonstrate credible reserve replacement through active exploration programs command higher market multiples than those that do not, creating a financial incentive that reinforces the operational necessity.
- Declining average ore grades at established operations increase the urgency of greenfield discovery programs.
- Reserve life extension is a key determinant of major gold producer equity valuations.
- Exploration spend functions as a capital allocation signal to institutional shareholders.
- The Australian dollar's movements versus USD gold price create variable but sometimes significant margin amplification.
Quarterly Data: The Acceleration Beneath the Annual Average
Annual figures capture the magnitude of Australia's gold exploration surge, but the quarterly trajectory reveals something more significant: the momentum was still building as the year progressed.
| Quarter | Gold Exploration Spend | Significance |
|---|---|---|
| September 2025 | $431.5 million | Highest single quarter since ABS records began in 1994 |
| December 2025 | Data pending | +49.3% year-on-year nationally |
| March 2026 | Data pending | +53.4% year-on-year (gold component) |
The September 2025 quarter's $431.5 million in gold-specific exploration expenditure represents a genuine historical milestone. ABS tracking of this metric dates to 1994, meaning the September 2025 result is the highest quarterly gold exploration spend across more than three decades of recorded data. Furthermore, the subsequent quarters showing year-on-year growth rates above 49% suggest the structural factors driving this allocation are not dissipating rapidly.
Where the Capital Is Concentrated: Geography and Geology
The Yilgarn Craton: Why This Ancient Rock Formation Keeps Delivering
The Yilgarn region of Western Australia is not simply an exploration address. It is an Archaean-age greenstone belt, meaning its rocks formed approximately 2.5 to 3.5 billion years ago during a period of intense volcanic and hydrothermal activity that created conditions highly favourable for gold mineralisation. The geological architecture of greenstone belts, characterised by the juxtaposition of mafic volcanic sequences with sedimentary units and intrusive granites, creates the structural traps and fluid conduits that concentrate gold into economically viable deposits.
What makes the Yilgarn particularly compelling from an exploration perspective is the growing evidence that the region remains underexplored at depth. Decades of near-surface and shallow drilling have produced some of the world's most significant gold districts, including Kalgoorlie, Leonora, and Laverton, yet deep crustal imaging and advances in downhole geophysical techniques suggest that significant mineralisation systems extend well below previously tested depths.
The 2025 AMER data confirmed the Yilgarn as the primary geographic concentration for the 69 maiden mineral resources identified across 50 projects during the year.
Northern Australia: The Emerging Discovery Corridor
While the Yilgarn dominates current exploration intensity, northern Australia is increasingly attracting first-pass exploration capital. The geological terrains of the Northern Territory, the North Queensland fold belt, and the Kimberley region of Western Australia host significant geological prospectivity for both gold and critical minerals. However, these regions have historically been underexplored relative to their southern counterparts due to infrastructure constraints, remoteness, and a relative scarcity of pre-competitive geoscience data.
Geoscience Australia's 35-year Resourcing Australia's Prosperity program is directly addressing this data deficit by funding early-stage geoscience acquisition in frontier terrains, reducing the information asymmetry that has historically discouraged exploration investment in these regions.
| State/Territory | Primary Exploration Role | Key Commodity Focus |
|---|---|---|
| Western Australia | Dominant, Yilgarn and Pilbara | Gold, critical minerals, lithium |
| Northern Territory | Emerging frontier | Gold, rare earths, copper |
| Queensland | Secondary market | Gold, copper, silver-lead-zinc |
| South Australia | Niche | Copper, uranium, critical minerals |
| New South Wales | Mature | Gold, silver-lead-zinc (Broken Hill corridor) |
The Critical Mineral Discovery Wave Running Alongside Gold
32 of 69 New Resources Include Critical Minerals
One of the less-discussed dimensions of Australia's 2025 exploration outcomes is the near-50% critical mineral discovery rate within the maiden resource cohort. Of the 69 new mineral resources confirmed during the year, 32 incorporated critical minerals, indicating that exploration programs are increasingly being designed with dual-commodity or multi-commodity optionality in mind. Australia's critical minerals discovery rate at this scale underscores a deliberate strategic shift in how targets are being selected and drilled.
This is geologically logical in many cases. Several of Australia's most productive gold-bearing terrains also host mineralisation systems enriched in critical minerals, meaning that a drill program targeting gold may simultaneously encounter gallium, antimony, or rare earth element mineralisation within the same geological corridor.
The Standout Critical Mineral Growth Figures
| Critical Mineral | Resource Growth Rate (2025) | Key Applications |
|---|---|---|
| Gallium | +467% | Semiconductor manufacturing, defence electronics, 5G infrastructure |
| Antimony | +40% | Flame retardants, next-generation battery technology, military applications |
| Rare Earth Elements | +8% | EV motors, wind turbine generators, defence guidance systems |
The 467% expansion in known Australian gallium resources is a figure that warrants careful contextualisation. Gallium is not a primary mining product; it is typically recovered as a by-product of bauxite processing and zinc smelting. Its extreme rarity as a standalone ore target means that even a modest new discovery can produce a very large percentage increase against a small base. Nevertheless, the directional signal is clear: Australian explorers are actively identifying gallium-bearing systems, and the resource inventory is growing rapidly from a low base.
Antimony's 40% resource growth carries different significance. Antimony has re-emerged as a strategically critical material due to its applications in both flame retardant chemistry and emerging battery technologies, particularly sodium-antimony battery chemistries being evaluated as alternatives to lithium-ion systems in grid-scale storage applications. Australia's antimony resource expansion consequently positions the country more favourably in a global supply chain that has historically been dominated by China.
The simultaneous expansion of gallium, antimony, and rare earth element resources within a single exploration reporting period suggests Australian discovery programs are being designed with strategic supply-chain considerations embedded at the project targeting stage, not retrofitted after the fact.
The next major ASX story will hit our subscribers first
Open Data and the Democratisation of Exploration Intelligence
What Changed in the 2025 AMER Edition
The 2025 edition of the Australian Mineral Exploration Review introduced a significant methodological enhancement that has received comparatively little analytical attention. For the first time in the publication's history since 2009, the complete report and all underlying datasets were made available as downloadable digital products.
This change enables users to conduct independent spatial analysis by integrating AMER datasets into proprietary GIS workflows, including via the Digital Atlas of Australia platform. Geoscience Australia's Resource Insights Branch described the shift as one oriented around making data more accessible and usable for governments, industry participants, investors, and research institutions seeking to apply exploration trend insights to their own analytical priorities.
Why This Matters for Smaller Operators
Previously, the ability to conduct sophisticated spatial analysis of national exploration trends was largely the domain of well-resourced majors and specialist consultancies with dedicated geoscience teams. The open-data model changes this dynamic, and furthermore, the downstream effects on junior exploration investment are considerable:
- Junior exploration companies can now integrate national trend data into prospect generation workflows at effectively zero incremental cost.
- State government geological surveys can cross-reference AMER data against their own datasets to identify underexplored corridors.
- Academic geoscience institutions gain access to a longitudinal national dataset suitable for structural analysis of discovery cycles.
- Investors and analysts can conduct independent verification of industry trend claims without relying solely on company-produced materials.
The downstream effect of this accessibility enhancement may be to accelerate the pace of prospect identification in underexplored terrains, particularly in frontier regions where pre-competitive data has historically been the binding constraint on junior exploration investment.
Silver-Lead-Zinc: The Secondary Growth Story
While gold dominated the Australia gold exploration spend narrative in 2025, the 20% growth in silver-lead-zinc exploration expenditure represents the second most significant commodity-level movement in the year's data and deserves independent analysis.
| Commodity | Exploration Spend Growth (2025) |
|---|---|
| Gold | +34% |
| Silver-Lead-Zinc | +20% |
| Total Mineral Exploration | +0.2% |
The silver-lead-zinc category is geographically anchored in part by activity around the Broken Hill district of New South Wales, one of the world's most historically significant sediment-hosted base metal provinces and the site of more than a century of continuous polymetallic production. Recent production improvements at operations including the Rasp mine, alongside discoveries of new ore sources within the broader district, have reinforced investor interest in this mature but still productive province.
Silver's specific demand profile adds a further dimension. Unlike lead and zinc, which are industrial metals with demand closely tied to construction and manufacturing cycles, silver occupies a dual role as both a monetary metal and a critical industrial input. Silver's use in photovoltaic cells for solar panel manufacturing creates a structural demand growth pathway linked directly to global renewable energy deployment, providing a demand narrative that resonates with both commodity investors and ESG-oriented capital.
Strategic Implications for Investors, Operators, and Policymakers
Reading the Long-Lead Signal Correctly
Exploration expenditure data functions as a leading indicator for future production capacity, but the lag between discovery and commercial production in the gold sector typically spans 7 to 15 years, incorporating resource definition drilling, prefeasibility and feasibility studies, environmental approvals, construction, and ramp-up phases.
The 2025 surge in Australia gold exploration spend therefore carries direct implications for Australia's gold production profile in the 2032 to 2040 period. Discoveries made today, particularly in the Yilgarn and northern Australian frontier regions, may not enter production until the middle of the next decade. This creates a structural case for sustained exploration investment even if near-term gold prices moderate, because the production gap that would result from an exploration hiatus cannot be quickly reversed.
For Exploration-Stage Investors: Key Positioning Considerations
- Companies holding granted exploration tenure in the Yilgarn, particularly those with access to established infrastructure corridors, are most directly exposed to the current capital cycle.
- Multi-commodity tenements, where gold and critical mineral prospectivity overlaps within a single licence area, carry optionality value that single-commodity assets do not.
- The open-data AMER enhancement lowers the informational advantage historically enjoyed by well-resourced operators, potentially compressing the information arbitrage available to early movers in frontier regions.
- Investors should note that year-on-year exploration spend growth rates above 30% in a single commodity category historically correlate with periods of elevated junior equity valuations, which can create entry-point risk for late-cycle participants.
In addition, understanding the broader gold exploration trends across Australia provides important context for interpreting these positioning signals accurately.
For Mining Services Operators
Elevated and accelerating exploration activity translates directly into demand for contract drilling services, downhole geophysical survey providers, airborne survey operators, assay laboratories, and remote camp infrastructure. The geographic concentration of activity in Western Australia and emerging northern Australian regions creates potential capacity constraints in localised markets, which may present pricing power opportunities for well-positioned service providers with established presence in these corridors.
The Production Pipeline Gap: A Policymaker's Perspective
The 7 to 15 year exploration-to-production timeline means that sustained government support for pre-competitive geoscience, including frontier data acquisition programs, is not simply a near-term exploration stimulus measure. It is an investment in sovereign resource security for the 2035 to 2045 decade. Gaps in exploration investment today translate into gaps in production capacity tomorrow, with limited ability to accelerate the timeline through downstream investment alone. Consequently, the mineral exploration importance of continuous public funding in frontier regions cannot be overstated.
Australia's Position in the Global Exploration Hierarchy
Australia consistently ranks among the top three global destinations for mineral exploration capital, alongside Canada and the United States, due to its combination of geological diversity, established regulatory frameworks, political stability, and a deep ecosystem of junior exploration companies listed on the ASX.
| Country | Approximate Gold Share of Exploration Budget | Notes |
|---|---|---|
| Australia | ~40% (2025) | Record high proportional share |
| Canada | ~35-40% | Consistently gold-dominant market |
| United States | ~25-30% | More diversified commodity base |
| West Africa (regional) | ~60-70% | Gold-dominant frontier markets |
Note: International figures are approximate, based on publicly available industry estimates, and should be treated as indicative rather than definitive.
Gold's dominance within Australia's exploration envelope mirrors a global trend. According to Australian mining exploration data, worldwide gold exploration budgets have expanded as producers respond to a combination of elevated spot prices, reserve depletion pressure at established operations, and investor mandates that reward reserve growth as a proxy for long-term value creation.
Three Structural Forces Sustaining the Shift
The concentration of Australia gold exploration spend at 40% of total sector expenditure is not adequately explained by any single factor. Three distinct structural forces are operating simultaneously:
- Price-driven capital allocation creates compelling internal rates of return on greenfield gold discovery at current spot price levels, drawing exploration capital away from lower-returning commodity alternatives.
- Reserve replacement urgency at established major operations forces systematic reinvestment in greenfield and brownfield exploration programs, with the Yilgarn and frontier northern Australian regions absorbing the majority of this capital.
- Open geoscience data access is progressively lowering the analytical barriers to entry for smaller operators, potentially broadening the base of active exploration participants and sustaining activity levels even as large-operator budgets fluctuate.
These three forces interact with and reinforce each other, creating conditions for a structural rather than purely cyclical reorientation of Australian exploration priorities.
Australia's $3.9 billion exploration market is not simply growing in a single direction. It is being reorganised from the inside, with gold asserting a dominance not seen in proportional terms for at least a decade, while critical mineral discovery rates suggest the sector is simultaneously building a second structural pillar that will become increasingly important as the decade progresses.
Readers seeking additional context on Australian mineral exploration data and trends can access the full Australian Mineral Exploration Review through Geoscience Australia. This article is intended for informational purposes and does not constitute financial advice. Exploration expenditure trends and discovery rates involve forward-looking elements subject to change based on market conditions, commodity prices, and regulatory environments.
Want to Capitalise on the Next Major Australian Gold Discovery Before the Broader Market Does?
Discovery Alert's proprietary Discovery IQ model delivers real-time alerts the moment significant ASX mineral discoveries are announced, transforming complex exploration data into clear, actionable opportunities across gold, critical minerals, and beyond. Explore how historic discoveries have generated substantial returns and begin your 14-day free trial today to position yourself ahead of the market.