July 19, 2026
The Commodity Cycle That Rewarded Patient Investors
Mining investment returns are rarely linear. They tend to compress during periods of macro anxiety, then release sharply when the underlying fundamentals reassert themselves. The mechanics behind this dynamic are well understood by experienced resources investors, yet the emotional discipline required to act on them during periods of peak uncertainty remains one of the most persistently undervalued edges in equity markets.
That tension between fear-driven mispricing and eventual fundamental repricing sits at the heart of how BHP shares up 55% in a year has become one of the defining equity stories on the Australian Securities Exchange heading into 2026. Understanding why this happened, and whether the conditions that drove it still apply, requires looking beneath the headline return figure to the forces that were actually at work.
When big ASX news breaks, our subscribers know first
Setting the Performance Benchmark: BHP vs. the Broader Market
How Does a 55% Return Stack Up Against ASX 200 Norms?
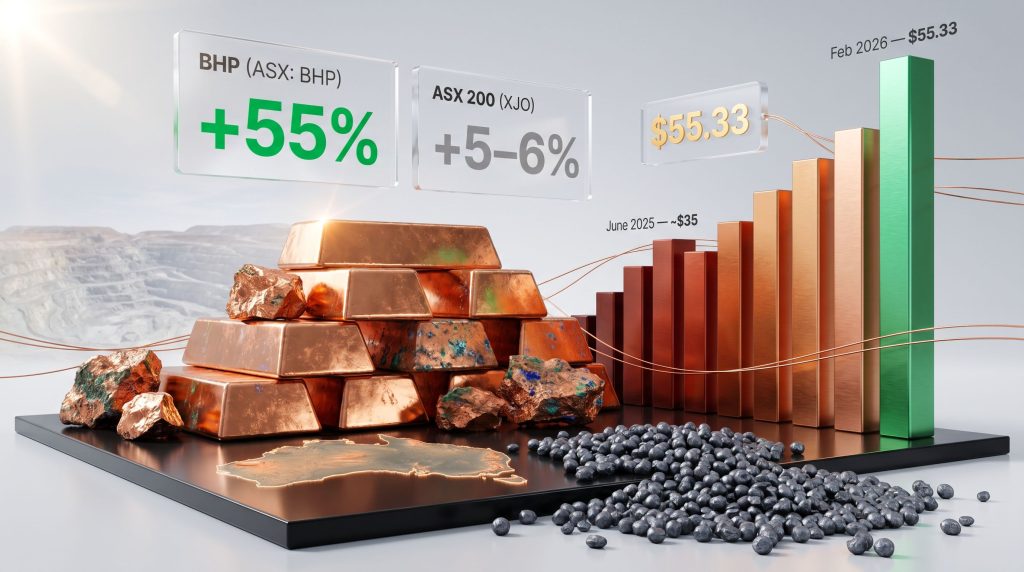
Over the 12-month period ending May 2026, BHP Group Ltd (ASX: BHP) delivered a return of approximately 55% against a backdrop where the ASX 200 benchmark managed only 5–6%. That gap is not merely impressive in relative terms; it represents a fundamental divergence in the drivers of value creation between a commodity-leveraged business operating near peak conditions and a broad index reflecting average economic outcomes.
An investor who allocated $10,000 to BHP shares 12 months ago would now hold a position worth approximately $15,500, and that figure excludes any dividend income received during the holding period, which would push total returns higher still.
| Metric | BHP (ASX: BHP) | ASX 200 (XJO) |
|---|---|---|
| 12-Month Return | +55% | +5–6% |
| Year-to-Date 2026 | +28% | +6% |
| August 2025 Monthly Return | +10% | +2.6% |
| All-Time High (Feb 2026) | $55.33 | — |
| 12-Month Low (June 2025) | ~$35 | — |
The scale of outperformance relative to the index is particularly striking when you consider that BHP is itself a constituent of the ASX 200. Its disproportionate gains inevitably contributed to the benchmark's total return, meaning the underlying performance gap between BHP and the average index holding was even wider than the headline figures suggest.
From Cyclical Trough to Record Highs: The Price Recovery Timeline
The 55% return was not distributed evenly across the 12-month period. It unfolded in distinct phases that reflect how investor sentiment shifted as the macro risk narrative evolved:
- June 2025: Shares bottomed near $35, weighed down by US tariff concerns and fears of reduced Chinese iron ore demand
- August 2025: A +10% monthly surge as iron ore prices held firm despite earlier predictions of demand deterioration
- November 2025: Shares recovered to approximately $40, establishing a new upward momentum phase
- February 2026: Shares reached an all-time high of $55.33, coinciding with earnings results that materially exceeded analyst expectations
- May 2026: Shares continue trading above $54, with analyst price targets ranging up to $56.64
"The price recovery from trough to all-time high represented a gain of approximately 58% from the June 2025 low to the February 2026 peak, illustrating how rapidly commodity-exposed equities can reprice once macro fear dissipates and earnings upgrades begin flowing through."
This timeline reinforces a critical principle for ASX resources investors: the entry point matters as much as the quality of the business itself. BHP's fundamentals never deteriorated enough to justify the depressed valuations seen at the June 2025 low. Those prices reflected sentiment, not substance.
What Actually Drove BHP's 55% Share Price Surge?
Driver #1 — The Commodity Price Tailwind: Iron Ore, Copper, and Gold Alignment
BHP's profitability is structurally anchored to commodity prices, and the 12 months to May 2026 saw multiple major commodities move favourably in concert. This simultaneous alignment across the portfolio is an uncommon occurrence that significantly amplified the earnings outcome beyond what any single commodity move could have produced.
Iron Ore
Iron ore is currently trading at approximately US$111 per tonne, according to Trading Economics data cited by Motley Fool Australia (May 13, 2026). That represents an 11% increase year-over-year and sits comfortably above levels that generate strong margins for Pilbara-based producers operating at BHP's cost structure. Furthermore, the iron ore demand prospects for China remained more resilient than many analysts had forecast, and investors who positioned around a more constructive demand scenario were rewarded accordingly.
Copper
BHP's average realised copper price during the FY26 third quarter reached US$5.47 per pound, reflecting a 31% increase year-over-year. Globally, copper prices have approached US$13,000 per tonne, tracking near 52-week highs. The copper supply crunch has become an increasingly prominent factor in the market narrative, and from an operating leverage standpoint, this kind of price improvement on a commodity where BHP has growing exposure represents an outsized contribution to net profit.
Gold
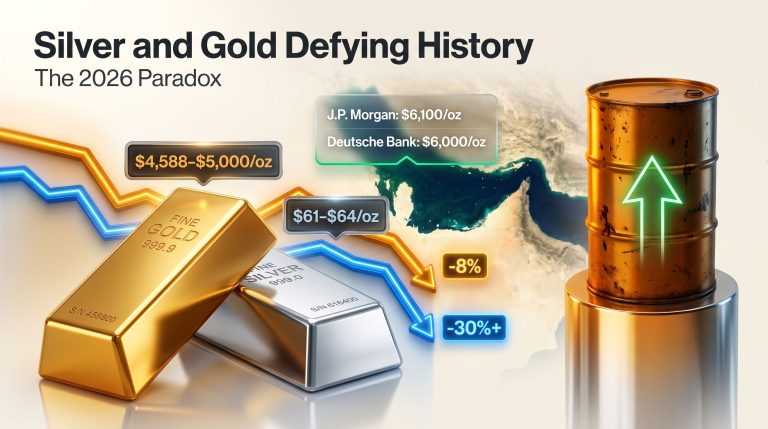
Gold surpassed US$5,250 per ounce in 2026, a level that would have seemed remarkable just a few years ago. The gold price outlook has attracted considerable investor attention, and while BHP does not have direct gold production exposure at scale, elevated gold prices lift sentiment across the entire resources sector and tend to attract capital flows into mining equities more broadly.
"A key but often overlooked aspect of commodity economics: BHP's operating costs per tonne remain relatively fixed regardless of the price it receives for its production. When commodity prices rise above that fixed cost base, the incremental revenue flows almost entirely through to net profit. This is why a modest increase in commodity prices can produce a disproportionately large increase in earnings per share."
| Commodity | Price Level (May 2026) | Year-on-Year Change | BHP Exposure |
|---|---|---|---|
| Iron Ore | US$111/tonne | +11% | Primary revenue driver |
| Copper | ~US$5.47/lb (realised) | +31% | Growing strategic exposure |
| Gold | US$5,250+/oz | Elevated | Indirect sector sentiment support |
Driver #2 — Operational Execution: Production Results That Backed the Price Story
Strong commodity prices create potential earnings uplift, but that potential only converts to actual shareholder value when a company can physically deliver the production volumes to capitalise on it. BHP's FY26 results demonstrated that operational execution matched the favourable pricing environment.
Key Production Metrics for FY26:
| Commodity | Production Volume | Year-on-Year Change |
|---|---|---|
| Iron Ore (H1 FY26) | 134 million tonnes | +2% (record WAIO shipments) |
| Iron Ore (Q3 FY26) | 62.8 million tonnes | +2% |
| Copper (Q3 FY26) | 476.8 kt | -7% |
| Steelmaking Coal (H1 FY26) | — | +2% |
| Energy Coal (H1 FY26) | — | +10% |
Iron ore shipments from the Western Australia Iron Ore (WAIO) operations in the Pilbara reached record levels during H1 FY26. The Pilbara is among the world's most cost-competitive iron ore provinces, with high-grade, low-impurity ore bodies that minimise processing costs and command price premiums in Asian steel markets. This geological and geographic advantage underpins BHP's ability to generate strong margins even in more modest commodity price environments.
Copper production declined 7% year-over-year in Q3 FY26, but the absolute output level of 476.8 kilotonnes remains substantial in the context of BHP's overall copper portfolio. Importantly, this output was achieved during a period when copper commanded its highest sustained prices in years, maximising the revenue value of every tonne produced.
BHP is simultaneously investing capital in expanding production at existing assets and progressing new development projects. This positions the company to grow output volumes in FY27 and beyond, adding a production growth component to the commodity price exposure that already underpins the current earnings base.
Driver #3 — Financial Results That Exceeded Market Expectations
BHP's H1 FY26 earnings announcement, delivered around February 2026, produced results that materially surpassed analyst consensus forecasts. The market reaction was immediate and sustained.
| Financial Metric | Result | Year-on-Year Change |
|---|---|---|
| Revenue | US$27.9 billion | +11% |
| Underlying Earnings | US$15.46 billion | +28% |
| Share Price (Day 1 post-announcement) | +4% | — |
| Share Price (9 days post-announcement) | +9% cumulative | — |
The divergence between revenue growth of +11% and earnings growth of +28% is the most important number in this table. It confirms the operating leverage thesis in practice: when commodity prices rise, revenues grow modestly, but profit margins expand much faster because the cost base is largely fixed. Every additional dollar of revenue above the cost threshold flows through to net profit with minimal deduction.
This earnings upgrade cycle is what drove the share price to an all-time high of $55.33 in February 2026, as the market repriced BHP's earnings power upward to reflect the new commodity price reality.
Driver #4 — The Macro Reset: How Tariff Fears Created the Entry Point
One of the most underappreciated contributors to BHP's total return is the starting valuation. Approximately 12 months ago, BHP shares were priced at around $35 per share, reflecting genuine investor anxiety about several overlapping macro risks:
- US tariff escalation and its potential knock-on effects for global trade volumes
- Concerns that Chinese steel demand would contract meaningfully, reducing iron ore consumption
- Broad risk-off sentiment across commodity-linked equities as investors sought perceived safety
The tariff risks for mining proved less damaging than feared, and as the months progressed, Chinese iron ore purchases remained resilient. The re-rating from a fear-driven depressed valuation back toward fair value was a significant component of the overall 55% return, separate from any contribution from rising commodity prices or earnings upgrades. This is the mechanism that experienced resources investors sometimes describe as a double re-rating: the stock first recovers to fair value from a discounted base, then continues higher as earnings upgrades justify a higher fair value itself.
Is BHP Still a Buy After a 55% Rally? Analysing the Forward Case
What the Analyst Community Is Saying in May 2026
The investment debate around BHP has shifted considerably. Twelve months ago, the question was whether the business would withstand macro pressure. Today, the question is whether further upside remains after a share price that has already delivered exceptional returns.
Current Analyst Positioning:
- Price targets extend up to approximately $56.64 at the upper end of the analyst range
- With shares trading near $54 in May 2026, the implied upside to consensus targets is positive but modest in percentage terms
- The copper growth thesis is increasingly cited as the primary long-term value driver, distinct from the iron ore earnings base that dominates current results
According to analysis from Motley Fool Australia, the bull and bear cases for BHP in 2026 remain sharply divided.
"Bull Case: Sustained Chinese iron ore demand, continued copper price strength driven by global electrification investment, and BHP's expanding production pipeline support further gains toward and potentially beyond analyst targets."
"Bear Case: A structural slowdown in Chinese construction activity, a correction in copper prices from elevated levels, or a broader commodity cycle downturn could compress earnings multiples from current highs and push the share price back toward the mid-$40s range."
The Copper Transition: BHP's Long-Term Strategic Repositioning
BHP's growing copper exposure reflects a deliberate strategic evolution that positions the company differently from a pure iron ore producer. This matters for long-term investors because it changes the duration and nature of BHP's earnings growth potential.
Why Copper Is Central to BHP's Future Value Proposition:
- The electrification of transport, industrial systems, and energy infrastructure requires substantially more copper per unit of output than conventional technologies, creating structural demand growth independent of traditional economic cycles
- BHP's copper assets span multiple geographies, providing operational diversification that reduces single-asset or single-jurisdiction concentration risk
- A 31% increase in average realised copper price in Q3 FY26 alone demonstrates the earnings sensitivity of this exposure at current production scale
- Copper supply constraints are well documented: new mine development timelines extend 15 to 20 years from discovery to production, and average ore grades at existing mines are declining globally
- BHP's investment in copper expansion positions it to capture volume growth in addition to price upside
BHP vs. ASX Mining Peers: A Comparative Framework
| Factor | BHP | Sector Peers |
|---|---|---|
| Commodity Diversification | High (iron ore, copper, coal) | Typically lower |
| Market Capitalisation | Largest ASX-listed miner | Smaller |
| Dividend Track Record | Consistent, high yield | Variable |
| Copper Growth Exposure | Significant and growing | Limited in most peers |
| Production Scale | Global tier-1 operations | Regional or single-asset |
| Operating Cost Position | Low-cost Pilbara iron ore base | Higher unit costs common |
Understanding BHP's Earnings Architecture: Why Commodity Prices Matter So Much
The Fixed-Cost Leverage Model Explained
BHP's profitability is highly sensitive to commodity prices because its operating costs per tonne of production remain relatively stable regardless of the price it receives. When iron ore or copper prices rise, the additional revenue flows almost entirely to net profit, a dynamic known as operating leverage. This is why a modest increase in commodity prices can produce a disproportionately large increase in BHP's earnings per share.
Understanding this mechanism is fundamental to interpreting BHP's financial results. Many investors focus on revenue growth as the primary metric, but for a commodity producer with a largely fixed cost base, the earnings growth rate is a more meaningful indicator of the true operating leverage being captured.
How the Operating Leverage Model Works in Practice:
- BHP mines iron ore at a relatively fixed cost per tonne that encompasses mining, processing, haulage to port, and shipping
- The selling price fluctuates continuously with global supply and demand dynamics on commodity exchanges
- When prices rise above the cost base, every incremental dollar of price improvement is captured almost entirely as net profit
- At US$111 per tonne for iron ore, BHP generates substantial margins above its cost of production across the WAIO system
- The same dynamic applies to copper at US$5.47 per pound realised in Q3 FY26, where elevated prices relative to production costs create outsized earnings contributions
- When multiple commodities strengthen simultaneously, as occurred over the past 12 months, the combined earnings leverage effect is amplified across the entire portfolio
What Happens to BHP's Earnings When Commodity Prices Move
| Commodity Price Scenario | Estimated Earnings Impact |
|---|---|
| Iron ore +10% (to ~US$122/t) | Significant uplift to underlying net profit |
| Copper +31% (as realised in Q3 FY26) | Material acceleration in copper division earnings |
| Iron ore -20% (to ~US$89/t) | Meaningful compression in overall profitability |
| Dual commodity strength (current environment) | Near-record or record profitability |
The Ore Grade and Quality Dimension: A Factor Less Discussed
An aspect of BHP's competitive position that receives less mainstream attention is the quality profile of its iron ore production. Pilbara iron ore from BHP's WAIO operations typically carries iron content grades of approximately 57–62%, and the relatively low impurity levels in terms of phosphorus and alumina content matter meaningfully in the context of Chinese steel mill procurement decisions.
Higher grade, lower impurity iron ore commands a price premium in Asian markets because it reduces the volume of flux and coke required per tonne of pig iron produced, lowering steel mill operating costs. As Chinese steel producers face ongoing pressure to improve environmental performance, demand for higher quality feedstock has structural support independent of overall steel production volume trends.
This ore quality dimension helps explain why BHP's realised iron ore prices have tracked favourably relative to benchmark prices during the recent period, contributing to the margin outcomes that underpinned the earnings beats that drove the share price higher. In addition, improving iron ore demand prospects tied to green steel transition investments in China further underpin the longer-term demand picture.
Key Risks Investors Must Weigh Before Buying BHP Shares
What Could Reverse the 55% Gain?
The same operating leverage that amplified gains during the upswing works in reverse during commodity price downturns. Prospective investors entering BHP at current levels near $54 need to weigh the following risk factors carefully:
- China demand concentration: Iron ore pricing is structurally dependent on Chinese steel production, which in turn reflects Chinese construction and manufacturing activity. Any sustained slowdown in Chinese property development or infrastructure investment would directly pressure BHP's largest revenue stream
- Commodity price cyclicality: Mining equities are inherently cyclical. The conditions that produced BHP shares up 55% in a year can reverse with similar velocity when commodity prices turn
- Currency exposure: BHP generates revenues in US dollars but its ASX-listed shares are denominated in Australian dollars. AUD/USD appreciation reduces the AUD value of reported earnings, all else being equal
- Geopolitical and trade policy risk: Renewed escalation in US-China trade tensions, or broader disruption to global commodity trade flows, could simultaneously reduce Chinese demand for iron ore and dampen investor sentiment
- Project execution risk: BHP's growth pipeline depends on delivering new production capacity on schedule and within budget. Major mining projects regularly encounter geological surprises, regulatory delays, or cost overruns
- Valuation risk: After a 55% re-rating, BHP shares no longer offer the asymmetric upside that existed at the June 2025 lows. The current risk/reward profile is materially different from the entry point that made the stock compelling 12 months ago
- Copper price correction risk: Copper's recent ascent to near US$5.47/pound realised prices has been exceptional. A reversal driven by weaker-than-expected electric vehicle adoption or supply surprises could compress the copper division's earnings contribution significantly
Furthermore, a valuation assessment from Simply Wall St highlights that BHP's copper and potash ambitions introduce additional capital allocation complexity that investors should factor into their risk assessment at current price levels.
The next major ASX story will hit our subscribers first
Frequently Asked Questions: BHP Shares in 2026
How Much Would $10,000 Invested in BHP 12 Months Ago Be Worth Today?
A $10,000 investment in BHP shares 12 months ago would be worth approximately $15,500 as of May 2026, reflecting roughly 55% price appreciation. This figure excludes dividend income received during the period, which would increase the total return further depending on the dividends paid over that timeframe.
Why Did BHP Shares Underperform Before the Rally?
Around 12 months ago, BHP shares were trading near $35, compressed by investor concerns about US tariff escalation and its potential to reduce Chinese industrial activity and iron ore demand. As Chinese purchasing volumes remained robust despite those concerns, the fear-driven discount in the share price unwound, contributing a significant portion of the eventual return before commodity price and earnings contributions added further upside.
What Is BHP's Current Iron Ore Price Environment?
Iron ore is currently trading at approximately US$111 per tonne, representing an 11% increase year-over-year. This price level comfortably exceeds the cost of production for BHP's Pilbara operations, generating substantial margins that flow disproportionately to net profit due to the fixed-cost structure of the business.
Is BHP's Copper Business as Important as Iron Ore?
Iron ore currently remains BHP's largest earnings contributor, but copper is growing in strategic and financial significance. With an average realised price of US$5.47 per pound in Q3 FY26, representing a 31% year-on-year increase, the copper division is contributing meaningfully to current profitability while also serving as BHP's primary exposure to the long-duration demand story created by global electrification trends.
What Are Analysts' Price Targets for BHP in 2026?
Analyst price targets for BHP extend up to approximately $56.64 at the upper end of the current range, with shares trading near $54 in May 2026. This implies limited but positive remaining upside to consensus targets at current prices.
Does BHP Pay Dividends?
BHP has maintained a consistent dividend payment history, and its strong FY26 earnings performance supports continued shareholder returns through dividends. Investors should consult BHP's most recent dividend announcements and their own tax circumstances when calculating total return expectations inclusive of income.
The Investment Takeaway: Framing BHP's 55% Return in Context
Three Structural Conclusions for ASX Investors
1. Starting Valuation Is as Decisive as Business Quality
BHP shares up 55% in a year was meaningfully shaped by the compressed starting point created by macro anxiety in mid-2025. Investors who looked past the tariff-related fear narrative and recognised that China's underlying iron ore demand remained structurally intact were positioned to capture the full re-rating cycle. Business quality matters, but paying the right price for it matters just as much.
2. Multi-Commodity Diversification Compounds Upside During Favourable Cycles
The simultaneous alignment of iron ore, copper, and broad commodities sentiment over the past 12 months allowed BHP's operating leverage to compound across multiple revenue streams at once. This diversification advantage is not replicable by single-commodity producers, and it represents a structural reason why BHP tends to outperform narrower mining peers during periods of broad commodity strength.
3. The Asymmetric Opportunity Has Largely Been Captured
With shares near all-time highs and analyst price targets implying single-digit percentage upside from current levels, the exceptional risk/reward asymmetry that existed 12 months ago has been substantially captured. Future returns from this point will depend more heavily on commodity price direction, production growth execution, and capital allocation decisions than on a valuation re-rating from a depressed base.
Investors considering BHP at current prices near $54 are evaluating a fundamentally different proposition to those who owned the stock at $35 a year ago. The quality of the business has not changed. What has changed is the price required to own it, and therefore the margin of safety and potential return available from the current entry point. Both dimensions belong in any serious investment assessment.
This article is intended for general educational and informational purposes only and does not constitute personalised financial advice. Past performance is not indicative of future results. Readers should consider their own financial circumstances and objectives, and consult a licensed financial adviser before making any investment decisions. Forecasts, price targets, and analyst estimates referenced in this article are subject to change and involve inherent uncertainty.
Want To Catch The Next Major ASX Mineral Discovery Before The Market Does?
Discovery Alert's proprietary Discovery IQ model delivers real-time alerts on significant ASX mineral discoveries, instantly translating complex geological data into actionable investment insights — the same kind of early-mover advantage that has historically generated extraordinary returns for well-positioned investors. Explore historic discoveries and their remarkable outcomes, then begin your 14-day free trial at Discovery Alert to ensure you're positioned ahead of the market when the next major find is announced.