
June 21, 2026
The Long Cycle Nobody Wants to Talk About: Sovereign Debt and the Future of Fixed Income
There are moments in financial history when the weight of accumulated decisions becomes visible all at once. Not through a single dramatic event, but through the slow, grinding repricing of the most foundational asset class in the global economy: government bonds. The current environment in U.S. Treasury markets is not simply a reaction to one policy announcement or one inflation print. It is the surface expression of a bond market crisis and rising Treasury yields driven by structural forces building for decades.
Understanding these forces requires stepping back far further than the last earnings cycle or central bank meeting. The bond market crisis conversation is no longer confined to academic papers or contrarian newsletters. When the chief executive of the world's largest bank by market capitalisation publicly warns that escalating sovereign debt levels are approaching a systemic inflection point, it signals that the concern has moved from the periphery to the boardroom.
JPMorgan Chase CEO Jamie Dimon stated in late April 2026 that mounting government debt obligations present a genuine risk of crisis in bond markets globally, citing the accelerating pace at which debt must be serviced as the core vulnerability. That warning deserves to be understood not as speculation but as informed institutional risk assessment from one of the most connected financial institutions on earth.
When big ASX news breaks, our subscribers know first
The Structural Debt Problem That Markets Can No Longer Ignore
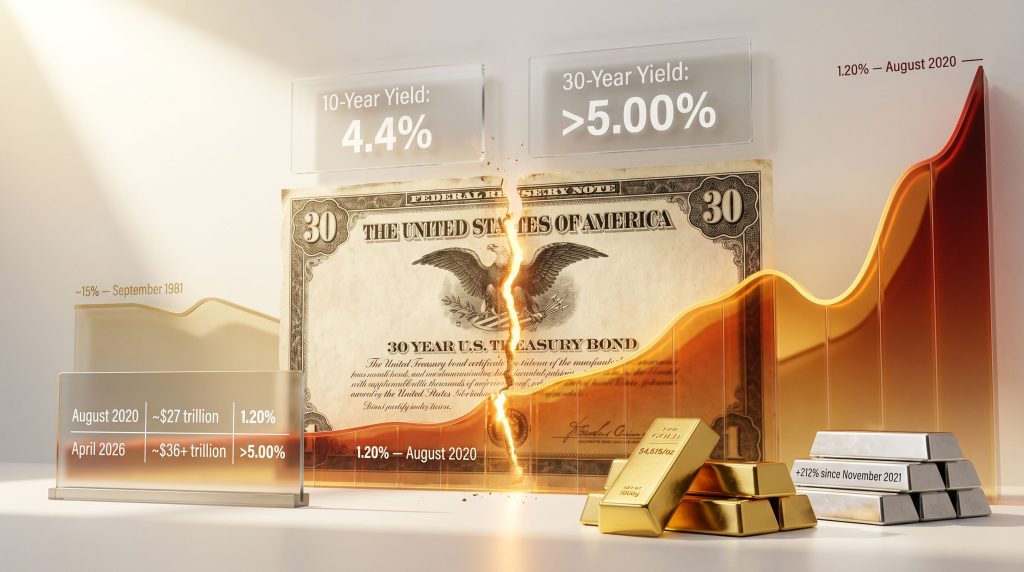
To understand why rising Treasury yields carry systemic implications, it helps to trace the trajectory of the debt itself. In December 1952, total U.S. national debt stood at approximately $262 billion, with the 30-year Treasury bond yielding 2.71%. Three decades later, in September 1981, the national debt crossed $1 trillion for the first time, an event that bond markets interpreted as a threshold breach, with the entire yield curve surging into double digits.
The 30-year Treasury peaked at approximately 15% annually. What followed was one of the most consequential long-term market dynamics in modern financial history: a nearly four-decade decline in Treasury yields, falling from that 15% peak in 1981 to a historic floor of 1.20% in August 2020. Today, the national debt stands at more than $36 trillion, representing a 39-fold increase since 1981 alone.
That compression in yields across four decades was not a neutral event. It was the single greatest engine of asset price appreciation across equities, real estate, and credit markets that the modern era has ever produced.
| Era | National Debt | 30-Year T-Bond Yield | Primary Inflation Channel |
|---|---|---|---|
| December 1952 | ~$262 billion | 2.71% | Consumer prices (moderate) |
| September 1981 | ~$1 trillion | ~15% (peak) | Consumer prices (severe) |
| August 2020 | ~$27 trillion | 1.20% (trough) | Financial assets (equities, real estate) |
| April 2026 | ~$36+ trillion | >5.00% | Mixed / fiscal risk premium building |
The headline debt figure, however, does not capture the full liability picture. Social Security reserves, for instance, are held in non-marketable instruments that do not trade on open markets. These obligations represent future payment commitments that never appear in the standard national debt calculation, creating a significant understatement of the total fiscal burden.
When long-term interest rate obligations on marketable debt are already rising, the compounding effect of servicing costs creates what analysts describe as a self-reinforcing fiscal spiral: higher yields generate higher interest costs, which widen deficits, which require more issuance, which pushes yields higher still. Understanding gold and bond dynamics in this context becomes increasingly important for long-term investors navigating these structural shifts.
What Treasury Yields Are Actually Communicating Right Now
As of late April 2026, 10-year Treasury yields were holding above 4.4%, while 2-year yields remained above 4.0%. The resulting spread of approximately 0.52 percentage points reflects a yield curve that has normalised from its deeply inverted state of 2022–2023, but with a critical distinction.
The elevation at the long end is not being driven primarily by growth expectations, but by what bond market professionals call a term premium. This is the additional yield investors require as compensation for the risk of holding long-duration U.S. debt in an environment of expanding supply and uncertain fiscal trajectory. According to RBC Global Asset Management, rising bond yields carry meaningful implications for long-term investors across all asset classes.
The MOVE Index, which measures implied volatility in U.S. Treasury markets in a manner analogous to the VIX for equities, has been tracking above its 52-week average. This pattern is consistent with prior periods of meaningful fixed income market stress. Furthermore, this elevated volatility is not incidental — it reflects genuine uncertainty among institutional market participants about the direction and sustainability of U.S. fiscal policy.
The Price Mechanics of Rising Yields: Why Duration Matters
For investors who have spent most of their adult lives in a declining yield environment, the inverse relationship between bond yields and bond prices can still feel abstract until it is translated into actual portfolio losses. Here is the core mechanism:
-
A bond's price is determined by the present value of its future cash flows, discounted at the prevailing yield.
-
When yields rise, that discount rate increases, reducing the present value of all future payments.
-
The longer the bond's maturity (duration), the greater its price sensitivity to any given yield change, because more cash flows are affected over a longer time horizon.
-
A 30-year bond purchased in February 2020 at a yield of 1.19% has experienced approximately a 50% reduction in market value as yields have climbed above 5%, according to market analysis from Gold-Eagle.com (Lundeen, May 2026). This is a loss profile historically associated with equity bear markets, not instruments sold as safe-haven government paper.
-
This bond will remain actively traded until February 2050, meaning its yield trajectory over the next 24 years will continue to influence global capital allocation decisions in real time.
The paradox of long-duration government bonds is that they can inflict equity-style losses on investors who believed they were holding a defensive asset. The 2020 vintage of 30-year Treasuries has already delivered that lesson at enormous scale.
Yield Curve Dynamics and the Recession Signal That Has Already Fired
The U.S. yield curve inverted ahead of every recession since the 1970s, a predictive track record that has made it one of the most closely watched signals in macroeconomics. That inversion has now resolved into a steepening pattern, but the resolution has taken a different form than prior cycles.
Rather than long-end yields falling as the Fed cuts short rates, the current steepening reflects long-end yields remaining persistently elevated while the front end begins to drift lower. This is a fiscal steepening, not a growth-driven one, and it carries distinct implications for global recession market risks that analysts are monitoring carefully. No credible near-term forecast currently projects 10-year Treasury yields declining below 3.75%, given the ongoing volume of Treasury issuance required to finance existing deficits.
A Century of Bond Market Cycles: The Historical Template
The 1958 to 1981 bond bear market represents the closest historical parallel to the current environment. Over roughly 23 years, Treasury yields rose continuously, compressing bond prices and destroying real returns for investors who had purchased fixed income instruments during the post-war stability of the late 1940s and early 1950s.
The drivers were cumulative: fiscal expansion through the Great Society programmes, the abandonment of the Bretton Woods gold standard in 1971, two oil price shocks, and a Federal Reserve that was repeatedly slow to tighten monetary conditions against accelerating inflation. By September 1981, when the national debt crossed $1 trillion and the 30-year Treasury yield hit its 15% peak, investor appetite for long-duration bonds was at its absolute nadir.
The sentiment was near-universally negative. And yet, as market analyst Mark J. Lundeen observed in his May 2026 commentary on Gold-Eagle.com, this exact moment represented the greatest 30-year fixed income return opportunity in modern market history. Those willing to lock in 15% annually for three decades captured returns that no subsequent generation of bond investors would ever replicate.
August 2020: The Pivot Point Still Being Absorbed
The bull market that followed, running from 1981 to August 2020, was not merely a bond story. The compression of yields from 15% to 1.20% became the financial architecture upon which every major asset class built its valuations. Equities, real estate, private equity, and leveraged credit all benefited from the tailwind of a structurally lower cost of capital.
The Federal Reserve's expansion of currency in circulation accelerated meaningfully during this period, but crucially, that inflation flowed into financial assets rather than consumer prices. This dynamic held until 2020, when the inflection point arrived. In March 2020, just months before that yield bottom, the Federal Reserve took an unprecedented step: for the first time in its history, the central bank directly purchased corporate bonds in the open market as part of its emergency stabilisation programme.
This intervention prevented what could have been a more severe spike in intermediate-grade corporate bond yields, but it also extended structural imbalances in credit markets that had been building for years. The August 2020 yield trough of 1.20% on the 30-year Treasury marks what may be recognised in retrospect as the beginning of a new multi-decade bond bear market and rising Treasury yields environment.
The Key Catalysts Compounding the Current Yield Surge
Fiscal Pressure: The Issuance Flood
The volume of Treasury debt that must be issued to finance current and projected deficits is placing structural upward pressure on yields that no single Federal Reserve policy adjustment can fully offset. Proposed fiscal legislation moving through Washington carries deficit expansion implications that, according to multiple independent budget analysis organisations, could add trillions to the federal debt over the coming decade.
The Treasury's tactical response has been to emphasise shorter-duration bill issuance over long-term bonds to limit pressure on the long end of the yield curve. However, this strategy merely defers rather than resolves the structural supply problem, and it concentrates rollover risk in shorter maturities. The term premium, measurable through frameworks such as the Adrian-Crump-Moench model, is rising — reflecting investors demanding incrementally greater compensation to absorb long-duration U.S. debt.
Geopolitical and Inflation Dynamics
Sustained geopolitical instability in energy-producing regions has shifted from a transient supply disruption narrative to a structural threat to regional production capacity. This re-anchoring of long-term energy price expectations has, in turn, kept long-term inflation expectations elevated, reducing the Federal Reserve's operational flexibility.
The result is a decoupling that experienced fixed income investors find deeply uncomfortable: long-term Treasury yields rising even as near-term economic data surprises to the downside. This simultaneous growth deceleration and yield elevation is the textbook fingerprint of a fiscal risk premium, not a conventional economic cycle.
The Fed's Constrained Position
The Federal Reserve currently faces a genuine dual constraint. Cutting rates risks re-igniting consumer price inflation at a moment when long-term inflation expectations are already elevated. Maintaining rates, however, adds to the debt servicing burden of both the federal government and the corporate sector while increasing recession risk.
The introduction of tariff measures has created an additional layer of demand compression, further complicating the already difficult monetary policy calculus. The 1970s stagflation episode remains the most studied historical precedent for this type of environment, and its lesson is clear: central banks that accommodate fiscal expansion in the face of inflationary pressure tend to face a more severe and prolonged adjustment when the correction eventually arrives.
Corporate Bond Markets: The Signal System Most Investors Overlook
One of the most valuable and least discussed analytical tools for gauging systemic financial stress is the relationship between best-grade and intermediate-grade corporate bond yields, a data series that Barron's has published weekly since 1926. This nearly century-long record provides a remarkably consistent leading indicator of market distress.
The historical pattern is clear: during periods of genuine systemic stress, intermediate-grade corporate bond yields spike sharply above best-grade yields as investors demand greater compensation for the additional default risk they perceive in lower-quality credits. The key historical episodes identified by this spread include:
-
1929 to 1932: The first leg of the Great Depression market collapse, involving the most severe intermediate-grade yield spike in the modern record.
-
1937 to 1942: The second wave of Depression-era financial distress, which most popular financial histories understate in severity.
-
2000: The unwinding of the technology sector credit bubble, triggering a meaningful intermediate-grade yield spike.
-
2009: The Global Financial Crisis, which produced an intermediate-grade yield spike exceeding even the 2000 episode in magnitude.
-
March 2020: The pandemic flash crash, which generated a spike that was partially contained by the Federal Reserve's unprecedented intervention into corporate bond markets.
A critical and underappreciated observation from this data series: the 2020 intermediate-grade yield spike would likely have exceeded the 2009 episode had the Federal Reserve not intervened directly in the corporate bond market for the first time in its institutional history. That intervention stabilised conditions in the short term, but it also means that investors lost the market signal that would otherwise have cleared at a natural stress level.
The absence of a significant intermediate-grade yield spike as of early May 2026 indicates that systemic credit stress has not yet materialised in corporate markets. However, this metric should be monitored with particular discipline as Treasury yields continue their upward trajectory.
Historically, when this spread widens dramatically, major equity market drawdowns follow with high consistency. The 2009 episode exceeded the 2000 one in magnitude, and any future episode driven by broad fiscal deterioration rather than a single-sector collapse would likely be wider in scope and more difficult to contain.
The next major ASX story will hit our subscribers first
Is This the Beginning of a Multi-Decade Bond Bear Market?
The question that serious long-term investors are now asking is not whether Treasury yields are elevated relative to recent history. They clearly are. The more consequential question is whether August 2020 marked the beginning of a structural bear market in bonds comparable in duration and severity to the 1958 to 1981 episode.
The structural similarities are considerable, but the current cycle begins from a more extreme debt baseline and a lower yield starting point than the 1958 environment. A comparison of the two periods reveals both parallels and critical divergences:
| Characteristic | 1958-1981 Bear Market | 2020-Present Cycle |
|---|---|---|
| Starting yield | ~3.0% | 1.20% (historic low) |
| Debt trajectory | Rising but from low base | Accelerating from extreme base |
| Fed policy posture | Reactive, eventually aggressive | Constrained by dual mandate |
| Inflation driver | Consumer price spiral | Mixed: fiscal and geopolitical |
| Duration of cycle | ~23 years | Potentially multi-decade |
Lundeen's analysis identifies an unknown threshold yield level above which the global financial architecture built since the early 1980s would face fundamental restructuring. Based on debt-to-GDP dynamics and interest coverage analysis, that threshold is likely somewhere above 5.25% on the 30-year Treasury, with the trigger zone potentially in the 6% to 8% range. This is not a precise prediction but a scenario boundary: the zone within which the self-reinforcing fiscal spiral described earlier could become uncontainable through conventional policy tools.
The current divergence between falling bond prices and equity markets making new all-time highs is not as unusual as it might appear. The same pattern emerged in the early stages of the 1958 to 1981 bond bear market, where equity markets continued to perform for several years before the transmission of rising real rates began to compress valuations.
What Rising Treasury Yields Mean for Gold and Precious Metals
The relationship between Treasury yields and gold prices is more nuanced than the standard inflation-hedge narrative suggests. Between February 2001 and August 2020, gold rose from approximately $253 per ounce to $2,061 per ounce while 30-year Treasury yields declined from 5.50% to 1.20%. This simultaneous bull market in both bonds and gold across two decades challenges the simplistic framing of gold as purely an inflation-driven asset.
The more accurate framework positions gold as a strategic investment: an asset with no counterparty risk, no government liability attached, and no ability to be debased through monetary policy. When confidence in the long-term sustainability of sovereign debt trajectories deteriorates, capital historically allocates toward gold not because inflation is high today but because fiscal credibility is eroding over time.
The current gold price near $4,615 per ounce (as of early May 2026) reflects a market that is already pricing in meaningful deterioration in that fiscal credibility. From a technical standpoint, gold's BEV (Bear Eye View) metric currently sits approximately 15.79% below its most recent all-time high, placing it in a corrective phase within what remains a structurally intact long-term bull market. Silver presents an even more asymmetric picture: up approximately 212% since November 2021, yet still trading 36.38% below its all-time high.
Gold Mining Equities: A Century of Valuation Context
Perhaps the most compelling data point for investors evaluating the precious metals sector is the Barron's Gold Mining Index (BGMI) to gold price ratio. Barron's has compiled weekly BGMI data since 1938, and with additional data extending the series back to 1920 using Homestake Mining records, the ratio provides more than a century of valuation context.
At the current gold price of approximately $4,615.55 per ounce, the BGMI currently requires less than half an ounce of gold to purchase, placing it at historically compressed valuation levels. The table below shows the implied BGMI value at various ratio levels:
| BGMI/Gold Ratio | Implied BGMI Value (at $4,615/oz gold) | Valuation Assessment |
|---|---|---|
| 0.5x (current) | ~$2,308 | Historically undervalued |
| 1.0x | ~$4,615 | Fair value baseline |
| 2.0x | ~$9,230 | Historical mid-range |
| 4.0x | ~$18,460 | Historical upper range (achievable in prior cycles) |
Furthermore, undervalued gold mining stocks represent a particularly compelling case when examined through this century-long BGMI lens. The XAU gold miners index is currently trading approximately 25.58% below its most recent all-time high, representing a meaningful drawdown from peak valuations.
Lundeen's long-term analysis characterises gold and silver miners as historically cheap relative to current gold prices, noting that the XAU did not reach new all-time highs until August 2025, a full decade after its devastating 80%-plus bear market bottom in January 2015. Considering gold's impact on mining equities alongside this historical BGMI data reinforces the structural case for the sector.
The leverage embedded in this ratio is significant. If the gold price continues to rise alongside a mean reversion in the BGMI-to-gold ratio, the combined effect on mining equity valuations would be substantially greater than a corresponding move in the physical metal alone.
Strategic Positioning for a Structurally Higher Yield World
Reassessing Fixed Income Allocation
New bond issuances at current yield levels offer meaningfully better income potential than anything available during the 2020 to 2021 era. A 4.4% yield on a 10-year Treasury is objectively more attractive as a current income stream than the sub-2% yields that characterised the post-financial-crisis decade.
However, existing long-duration bond holdings continue to face mark-to-market pressure if yields rise further. Duration management — the practice of reducing portfolio sensitivity to further yield increases by shortening average maturity — remains a core tactical priority. According to Australia's own fiscal trajectory, rising sovereign bond yields and escalating debt servicing costs are not exclusively a U.S. phenomenon, reinforcing the global nature of the structural challenge.
Asset Classes With Historical Precedent in Bond Bear Markets
Based on the historical record of the 1958 to 1981 bond bear market and analogous international episodes, several asset class characteristics have been associated with relative outperformance during periods of structurally rising yields:
-
Hard assets including commodities, energy infrastructure, and precious metals have historically maintained or increased real purchasing power during fiscal-stress-driven yield rises.
-
Short-duration fixed income instruments such as floating rate notes and Treasury Inflation-Protected Securities offer partial insulation from duration risk.
-
Equity sectors with genuine pricing power, companies whose products or services allow them to pass rising input costs to customers, have historically outperformed inflation-sensitive yield environments.
-
Real assets with inelastic demand, physical infrastructure, agricultural land, and energy royalties, have provided returns less correlated to long-duration bond price movements.
The Investor Psychology of Cycle Extremes
The single most instructive data point from the entire century of bond market history reviewed in this analysis may be this: in September 1981, when 30-year Treasury bonds offered 15% annual returns locked in for three decades, demand from investors was near its lowest point in the post-war period. After more than two decades of watching bond prices fall, the market had psychologically capitulated on the entire asset class, precisely at the moment when it offered its greatest prospective return.
The inverse is equally true. In August 2020, when 30-year Treasuries yielded 1.20% and offered the worst prospective real return in living memory, institutional and retail demand was at its highest in decades, with hundreds of billions flowing into long-duration bond funds. Those investors have since experienced losses approaching 50% in market value terms on those positions.
The lesson embedded in this history is not about market timing in the tactical sense. It is about the structural relationship between sentiment, valuation, and long-term returns. Entry point relative to the multi-decade cycle matters far more than short-term momentum or the prevailing consensus narrative.
The bond market crisis and rising Treasury yields debate is not a question with a clean resolution date. It is a structural process that will unfold across years and possibly decades. Understanding the mechanisms, the historical precedents, and the transmission pathways to other asset classes is not merely academic. For investors with long time horizons, it may be the most consequential framework available for thinking about capital allocation in the years ahead.
This article is intended for informational and educational purposes only and does not constitute financial advice or an investment recommendation. All financial data, yield levels, and price references reflect conditions as of early May 2026. Past performance of any asset class, including Treasury bonds, gold, and mining equities, is not indicative of future results. Investors should consult a qualified financial adviser before making any investment decisions.
Want Real-Time Alerts When Major ASX Mineral Discoveries Are Announced?
While sovereign debt cycles and rising Treasury yields reshape capital allocation globally, hard assets — particularly gold and precious metals — are attracting renewed institutional interest. Discovery Alert's proprietary Discovery IQ model scans ASX announcements in real time, instantly identifying significant mineral discoveries and delivering actionable insights to subscribers before the broader market reacts — explore historic discovery returns or start your 14-day free trial today to position yourself ahead of the next major find.