July 24, 2026
When Every Shipping Lane Counts: The Architecture of a $100 Oil Market
Global oil markets have a peculiar relationship with round numbers. The $100 per barrel threshold for Brent crude is not simply a psychological milestone embedded in trader consciousness — it is a structural inflection point that recalibrates decision-making across governments, central banks, corporate boardrooms, and household budgets simultaneously. As Brent tops $100 as Houthi attacks push oil rally into triple digits, history shows that once crude crosses this level on a sustained basis, the feedback loops become self-reinforcing in ways that no single policy intervention can easily interrupt.
What makes the current breach of the $100 level particularly significant is not the number itself, but the mechanism behind it. This is not a demand-driven oil price rally fuelled by unexpectedly strong economic growth. Nor is it a speculative positioning event driven by hedge fund momentum. It is a supply-side shock of unusual complexity, involving the simultaneous degradation of multiple independent oil export arteries across three separate geographic regions.
When big ASX news breaks, our subscribers know first
The Multi-Chokepoint Crisis Reshaping Global Oil Flows
Understanding why Brent tops $100 as Houthi attacks push the oil rally into triple digits requires mapping the geography of global crude transit. The world's oil supply chain depends critically on a small number of narrow maritime passages, and the current crisis has placed pressure on more of these simultaneously than at any point in recent memory. The complex interplay of oil and geopolitics has rarely been more visible.
The Bab el-Mandeb Strait: From Throughway to Flashpoint
The Bab el-Mandeb Strait — a waterway barely 30 kilometres wide at its narrowest point between Yemen and Djibouti — functions as the southern gateway between the Red Sea and the Gulf of Aden. Under normal conditions, approximately 6 to 7 million barrels of oil and petroleum products transit this corridor every day, moving between Middle Eastern export terminals and European and Asian refineries.
When vessels are forced to avoid this route, the only alternative is to circumnavigate the African continent via the Cape of Good Hope — adding 10 to 14 days of additional sailing time per voyage. That extension translates directly into higher freight costs, elevated war-risk insurance premiums, and reduced effective supply availability at destination markets. Houthi forces have declared a formal naval blockade targeting Saudi crude exports through this corridor, with two Saudi oil tankers reported struck in recent days, prompting immediate vessel rerouting and transit delays.
The Strait of Hormuz: The Irreplaceable Bottleneck
At the northern end of the Arabian Sea, the Strait of Hormuz carries a burden that no other waterway on earth replicates. Roughly 20% of all globally traded oil transits this passage daily, with no viable alternative route for the Persian Gulf producers who depend on it. Unlike the Bab el-Mandeb, where the Cape of Good Hope offers at least a costly detour, Hormuz has no substitute.
Iranian-linked threats to this corridor have historically generated a $5 to $15 per barrel risk premium in Brent futures even when no actual disruption occurs — the mere credibility of threat reprices the global market. The simultaneous pressure on both Hormuz and the Bab el-Mandeb creates a compounding supply-risk environment without direct modern precedent.
Comparing the Chokepoints: Risk Profiles and Market Consequences
| Chokepoint | Daily Oil Flow (Normal) | Primary Threat Actor | Alternate Route | Extra Transit Time |
|---|---|---|---|---|
| Strait of Hormuz | ~20 Mbpd | Iran-linked forces | None viable | N/A |
| Bab el-Mandeb / Red Sea | ~6–7 Mbpd | Houthi forces | Cape of Good Hope | +10–14 days |
| Black Sea (CPC Terminal) | ~1.3 Mbpd | Drone strikes | Rail/pipeline | Weeks to months |
Three Layers of Supply Shock Driving the Rally
The price acceleration that has taken Brent from roughly $80 to above $100 in approximately two weeks reflects not one supply disruption but at least three overlapping shocks occurring in parallel.
Layer 1: Houthi Naval Escalation and the Saudi Export Squeeze
The most immediate catalyst has been the Houthi declaration of a naval blockade targeting Saudi crude exports through the Red Sea. Attacks on Saudi tankers in the Bab el-Mandeb have triggered vessel rerouting and transit delays that remove the export flexibility Saudi Arabia had been counting on. This is significant because Saudi Arabia had already been managing Hormuz-related complications — losing the Red Sea alternative compounds the constraint rather than simply adding to it.
Layer 2: The Cascade of Alternative Route Failures
Beyond the Red Sea, multiple other non-OPEC export arteries have come under simultaneous pressure. Furthermore, the trade war and oil prices dynamic has added further complexity to an already fragile supply picture:
- Kazakhstan: Drone attacks on the Caspian Pipeline Consortium terminal on the Black Sea have curtailed tanker loadings, reducing a key non-OPEC export corridor that normally handles approximately 1.3 million barrels per day
- Russia: Months of Ukrainian drone strikes on refinery infrastructure have kept Russian fuel exports structurally constrained, removing what had previously served as a partial buffer for European energy markets
- Iraq: Indian state-owned refiners have suspended Iraqi crude purchases because of unacceptable shipping risk through Hormuz, eliminating a demand anchor that had been stabilising Iraqi export volumes and widening the gap between available supply and reachable buyers
Layer 3: Strategic Reserve Depletion and Disappearing Market Buffers
Perhaps the least visible but most consequential element of the current crisis is the progressive exhaustion of the shock-absorption mechanisms that allowed previous geopolitical spikes to remain temporary.
Governments globally have drawn down hundreds of millions of barrels from strategic petroleum reserves since the Middle East conflict began. Commercial inventories have fallen sharply in parallel. China, which had accumulated pre-conflict stockpiles, has been drawing on those reserves rather than purchasing at elevated spot prices. The buffers that previously allowed the market to absorb supply disruptions without sustained triple-digit pricing are now materially diminished.
When these three conditions converge — SPR drawdowns, commercial inventory declines, and the removal of import substitution options — the market loses the layered resilience that previously converted geopolitical spikes into temporary price events rather than persistent structural conditions.
Mapping the Price Trajectory: From $80 to $100 in Two Weeks
The speed of the rally carries important analytical information. A 20% appreciation in approximately two weeks is a pace of price acceleration that historically distinguishes structural supply disruptions from speculative positioning events. Momentum-driven speculative rallies tend to be faster, sharper, and less supported by physical market tightening. This move has been different.
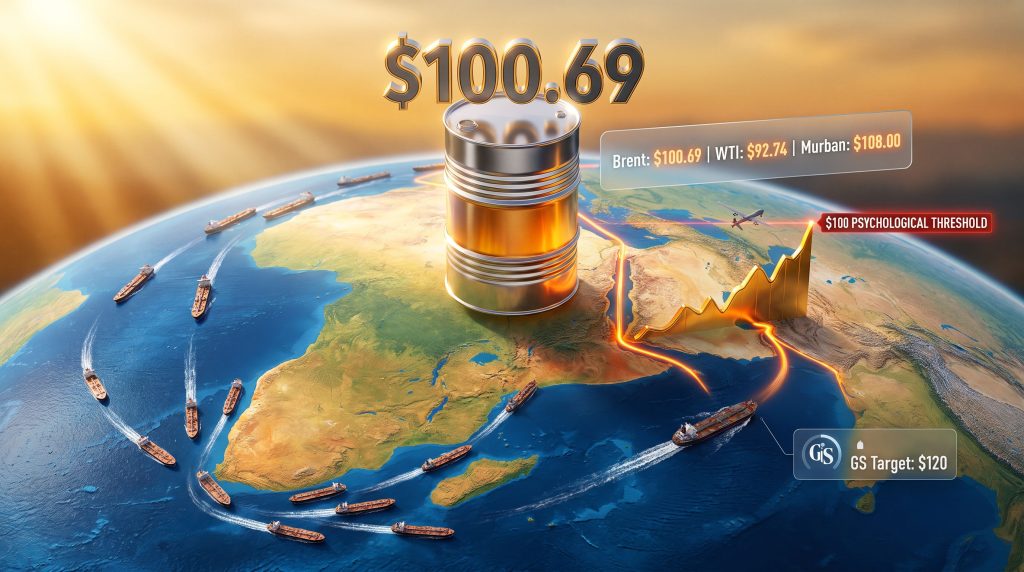
Front-month Brent for September delivery reached $100.69 per barrel, touching an intraday high of $101.01. Brent crude jumped above $100, with WTI crude surging to $92.74, up 6.81% on the session. Murban crude — a key Middle East benchmark closely watched by physical market participants — surged to $108.00 per barrel, posting a gain of more than 20% in a single session. The OPEC basket price reached $94.53, up 6.81%, reflecting broad-based tightening across Middle Eastern crude grades.
Critically, the entire Brent forward curve moved higher simultaneously — not just the front month contract. This is a defining signal. When backwardation deepens across multiple delivery periods, it means traders are not pricing in a short-term supply shock followed by normalisation. They are pricing in prolonged disruption extending across multiple future delivery windows.
Key Price Levels and Their Market Significance
| Price Level | Significance |
|---|---|
| $85–$90 | Comfortable range for most OPEC+ producers; limited urgency to respond |
| $90–$95 | Risk premium territory; shipping insurance costs surge |
| $95–$100 | Demand destruction warnings emerge; central bank inflation concerns escalate |
| $100+ | Psychological threshold breached; government intervention risk rises |
| $115–$120 | Analyst ceiling under sustained dual-chokepoint disruption scenario |
Goldman Sachs at $120: How Credible Is the Upside Case?
Goldman Sachs has publicly modelled a scenario in which Brent reaches $120 per barrel if Middle East conflict continues to expand. Bloomberg Economics has produced analysis suggesting even higher outcomes are possible under a sustained dual-chokepoint blockade. The IMF has specifically flagged elevated oil prices as a key downside risk to India's GDP growth trajectory, a signal that institutional risk assessments are now formally incorporating sustained triple-digit crude into their projections.
The counterargument centres on demand destruction. Historically, crude prices sustained above $100 trigger measurable consumption reduction in price-sensitive economies. Airlines represent one of the most exposed sectors — Ryanair reported a 36% decline in profit directly attributable to unhedged jet fuel costs doubling, illustrating the speed with which fuel cost escalation flows through to corporate earnings.
Scenario Modelling: Three Paths Forward
| Scenario | Key Condition | Brent Price Range |
|---|---|---|
| De-escalation | Ceasefire or diplomatic resolution reduces shipping risk | $80–$90 |
| Status Quo Disruption | Attacks continue but don't expand to new targets | $95–$105 |
| Full Dual-Chokepoint Blockade | Both Hormuz and Red Sea severely restricted simultaneously | $115–$130+ |
Which Economies Bear the Heaviest Burden at $100+ Crude
Asia's Structural Import Vulnerability
Asia's dependence on Middle Eastern crude makes the region disproportionately exposed to any sustained disruption of Persian Gulf and Red Sea export routes. For a comprehensive crude oil market overview, the numbers are stark:
- Japan: Power prices have surged to a 3.5-year high as import costs escalate, and the nation's overall import bill has reached unprecedented levels driven by crude price increases
- India: The IMF has specifically identified elevated oil prices as a primary downside risk to India's growth trajectory; Indian state refiners have already withdrawn from Iraqi crude purchases due to Hormuz shipping dangers, while India simultaneously became the world's top long-term LNG buyer in 2025 according to GIIGNL
- Pakistan: The country has been paying record sums for spot LNG as Qatar supply arrangements are disrupted, while simultaneously scrambling to identify alternative crude sourcing options as both Hormuz and Red Sea routes carry elevated risk
Europe Entering Winter in a Weakened Position
The energy stress is not confined to Asia. Europe is approaching the winter heating season with its weakest natural gas storage cushion in 15 years, according to Equinor's chief executive. LNG importers across the continent are actively negotiating lower-priced contracts from Qatar and the UAE as existing supply arrangements are disrupted by the broader conflict. The EU's decision to concede to Greek LNG demands in a Russian sanctions dispute illustrates the degree to which energy security pressures are fracturing European policy consensus in real time.
The next major ASX story will hit our subscribers first
Corporate Earnings: A Tale of Two Sectors
The oil price surge is producing sharply divergent outcomes across industries. However, OPEC's market influence remains a critical variable in determining how long these divergent dynamics persist.
Windfall beneficiaries:
- TotalEnergies reported a 68% surge in profit directly attributable to elevated oil prices
- Equinor posted a 93% profit increase driven by combined oil and natural gas price gains
- U.S. refinery utilisation climbed to 96.2% as processors raced to capitalise on elevated product crack spreads
Acute losers:
- Aviation: Ryanair's 36% profit decline on doubled jet fuel costs exemplifies the sector's extreme sensitivity to unhedged crude exposure; ticket prices across the industry are expected to rise as carriers absorb higher fuel costs
- Shipping: Freight rates and war-risk insurance premiums have surged for vessels transiting or rerouting away from the Red Sea, raising costs across all goods categories dependent on maritime logistics
- Heating oil: U.S. heating oil prices reached $4.368 per gallon, up more than 5% in a single session, with U.S. gasoline prices also climbing back above $4 per gallon
Why This Rally Is Structurally Different from Historical Geopolitical Spikes
Previous geopolitical oil price events — including the 2019 Abqaiq facility attack in Saudi Arabia and the 2022 Russia-Ukraine invasion — were characterised by disruption concentrated around a single supply vector. The Abqaiq attack briefly removed approximately 5% of global supply but was resolved within weeks as Saudi production recovered. The 2022 Russian supply shock was severe but unfolded gradually enough for consuming nations to activate strategic reserves and redirect trade flows.
The current situation differs in a fundamental way: simultaneous pressure is being applied to multiple independent supply arteries — Hormuz, the Red Sea, the Black Sea, and Russian export infrastructure — creating a multi-vector disruption architecture that cannot be resolved by any single diplomatic or military outcome. Neutralising the Houthi threat to the Red Sea would not reopen Hormuz. Stabilising Hormuz would not restore the Black Sea CPC terminal.
The Iran dimension adds a further layer of uncertainty. U.S. military strikes on Iranian targets across 12 consecutive nights have kept geopolitical risk premium elevated across all Middle Eastern crude benchmarks. Iran's statement that the U.S. struck an unfinished nuclear facility introduces an escalation dimension that markets are actively pricing across forward curves. A U.S.-Iran memorandum of understanding had briefly generated expectations of supply normalisation — those expectations have since been fully unwound.
*One factor that has received less attention than it deserves is the role of Chinese purchasing behaviour. The U.S. has reported that China has reduced Iranian oil purchases by approximately 40%. China simultaneously drawing on pre-war stockpiles rather than purchasing at elevated spot prices creates a dual dynamic that is reshaping global crude flow patterns and removing what had previously been a stabilising demand anchor for certain crude grades.*
FAQ: Brent Tops $100 as Houthi Attacks Push Oil Rally Into Triple Digits
Why did Brent crude cross $100 per barrel?
A convergence of simultaneous supply disruptions across multiple shipping corridors removed multiple layers of supply redundancy from the global oil market. Houthi attacks on Saudi tankers in the Red Sea, ongoing threats to the Strait of Hormuz, drone strikes on the Black Sea CPC terminal, and constrained Russian fuel exports all compounded at the same time, pushing Brent above the $100 threshold.
What is the Bab el-Mandeb Strait and why does it matter?
It is a narrow waterway between Yemen and Djibouti connecting the Red Sea to the Gulf of Aden. Approximately 6 to 7 million barrels of oil per day transit this passage under normal conditions. When disrupted, vessels must reroute around the African continent, adding significant time, cost, and insurance expense to every voyage.
Could oil prices reach $120 or higher?
Goldman Sachs has publicly modelled a scenario in which Brent reaches $120 if Middle East conflict continues to escalate. The key variable is whether disruptions remain episodic or become structurally persistent across multiple chokepoints simultaneously. A crude oil market overview of current conditions suggests the upside scenario remains credible while multi-vector disruptions persist.
How does $100 oil affect everyday consumers?
U.S. gasoline prices have climbed back above $4 per gallon. Heating oil has reached $4.368 per gallon. Airline ticket prices are expected to rise as carriers absorb higher jet fuel costs. Broader inflation pressures will intensify in import-dependent economies across Asia, Europe, and emerging markets.
Why is the depletion of strategic petroleum reserves significant?
Strategic reserves function as the global oil market's emergency shock absorber. With hundreds of millions of barrels already drawn down since the Middle East conflict began, governments have reduced capacity to intervene and cap prices through reserve releases as they did during previous oil price spikes. A depleted buffer means the market must rely on price-driven demand destruction rather than supply-side intervention to rebalance.
What does the forward curve movement signal to investors?
When the entire Brent forward curve moves higher simultaneously rather than just the front-month contract, it signals that professional traders believe the disruptions will persist across multiple future delivery periods. This is structurally more significant than a spot price spike, as it reflects a market-wide reassessment of medium-term supply availability rather than short-term speculative positioning.
Disclaimer: This article is for informational purposes only and does not constitute financial or investment advice. Oil price forecasts referenced from Goldman Sachs and Bloomberg Economics represent analytical scenarios, not guaranteed outcomes. All prices cited reflect market data at the time of publication and are subject to change. Readers should conduct their own research before making any investment or business decisions related to energy markets.
Want to Capitalise on the Market Volatility Driving ASX Resource Stocks?
When geopolitical shocks send commodity markets into triple digits, the ripple effects reach ASX-listed energy and resource stocks almost instantly — and Discovery Alert's proprietary Discovery IQ model ensures subscribers receive real-time alerts the moment significant mineral and resource discoveries are announced, turning complex market signals into actionable investment opportunities before the broader market catches on. Begin your 14-day free trial at Discovery Alert today and position yourself ahead of the next major market move.