
June 7, 2026
The Anatomy of a Statistic: Why Central Bank Gold Demand Figures Are More Complex Than They Appear
Every major asset class has a narrative that anchors investor confidence. For gold, that narrative has been built substantially around central bank gold buying estimates — a persistent claim that sovereign institutions are purchasing gold in enormous quantities. This story has supported gold's multi-year bull run, provided a psychological floor during periods of retail selling pressure, and reinforced the broader thesis that sovereign institutions view gold as an irreplaceable reserve asset.
However, beneath the headline tonnage figures lies a structural complexity that most retail investors never encounter. The number reported each quarter is not a single, audited statistic. It is a hybrid construct, combining verified disclosures with demand-side modelling, and in recent quarters, the balance between these two components has shifted in ways that deserve serious analytical attention.
When big ASX news breaks, our subscribers know first
How Central Bank Gold Reporting Actually Works
The IMF Data Layer: What Gets Verified and What Does Not
Central banks are expected to report their gold holdings monthly to the International Monetary Fund, and those submissions are compiled into the IMF's International Financial Statistics database. This is the verified layer of the demand picture — the portion that analysts can cross-reference, audit, and treat with a reasonable degree of confidence.
The problem begins with consistency. Not every central bank files accurate reports on time, and some major holders have historically gone silent for extended periods without any formal disclosure. This creates gaps in the official record that cannot simply be left empty if the goal is to construct an accurate picture of total global demand.
How the World Gold Council Fills the Gaps
To address these gaps, the World Gold Council, working in partnership with Metals Focus, employs a demand-side modelling methodology. Rather than relying solely on what institutions declare, analysts work backwards from observable market data: refinery output flows, vault delivery records, trade statistics, and market intelligence gathered through industry networks.
The logic is straightforward. Gold that enters the system through mining and recycling must exit through identifiable demand channels. Once jewellery, technology, investment, and official reported purchases are accounted for, any remaining gold is attributed to central bank activity that has not yet entered the public record. This residual figure is the modelled component of the headline total.
Furthermore, according to World Gold Council research on central bank demand, the methodology is the best available tool for estimating true demand, but it carries inherent variance. The residual is an inference, not a confirmation.
Reported vs. Estimated: Understanding the Verification Gap
How the Balance Has Shifted Quarter by Quarter
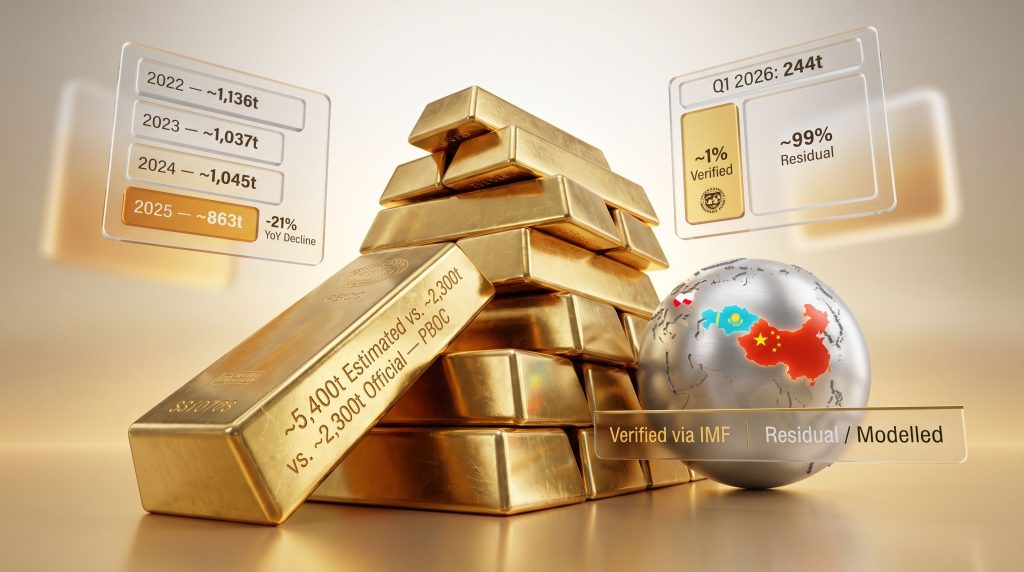
The proportion of verified versus modelled demand has not remained stable. In earlier years, the residual portion was relatively contained, reflecting a period when most significant buyers were reporting transparently. Since 2022, however, that balance has inverted dramatically.
| Quarter | Total Estimated (Tonnes) | Verified via IMF (%) | Residual/Unverified (%) |
|---|---|---|---|
| Q1 2024 | ~290t | 44% | 56% |
| Q2 2024 | ~260t | 33% | 67% |
| Q1 2025 | ~230t | 22% | 78% |
| Q1 2026 | 244t | ~1% | ~99% |
Data: IMF International Financial Statistics (verified component); World Gold Council / Metals Focus demand modelling methodology (residual component).
The Q1 2026 figure is the most striking. Of the 244-tonne estimate for that quarter, only approximately 2 tonnes could be confirmed through IMF disclosures. That places the verified component at roughly 1% of the total headline figure. The remaining 99% is a modelled inference derived from the analytical framework described above.
Why This Matters More Now Than It Did Three Years Ago
Prior to 2022, quarterly central bank purchases of 100 to 200 tonnes were largely reported through official channels with minimal dependence on modelling. The structural shift that began in the third quarter of that year fundamentally altered the transparency landscape. In addition, central bank gold demand has increasingly become a driver of gold's price performance, making the accuracy of these estimates more consequential for investors than ever before.
The 2022 Inflection Point: Why the Residual Began Ballooning
Dollar Weaponisation and the Reserve Manager Rethink
Russia's exclusion from the SWIFT financial messaging system in February 2022, combined with the freezing of a significant portion of the Russian central bank's foreign currency reserves, sent a clear signal to reserve managers globally. Sovereign wealth held in dollar-denominated instruments was not beyond geopolitical reach.
The immediate consequence was a reassessment of reserve composition across numerous central banks, particularly those in emerging markets and among nations with complex relationships with Western financial institutions. Gold, which cannot be frozen, sanctioned, or digitally seized, became the logical beneficiary of this rethink. Consequently, central banks influencing gold prices became a defining theme for the asset class.
China's Reporting Pattern and Its Role in the Residual
China resumed monthly gold reserve reporting in November 2022 after a three-year silence. The timing was not incidental. It coincided precisely with the period when the residual began expanding rapidly, as the combination of dollar anxiety, sanctioned reserves, and a large buyer re-entering visible markets created conditions that overwhelmed the reporting infrastructure.
Historical Precedent: China disclosed in 2009 that it had accumulated 454 tonnes of gold during a six-year period when it had reported zero purchases (2003 to 2009). In 2015, a further 604 tonnes were announced. In both cases, independent analyst estimates derived through residual modelling closely aligned with the eventually disclosed figures, providing strong empirical support for the methodology.
Q1 2026 Central Bank Gold Buying: Breaking Down the Numbers
Which Nations Were the Largest Verified Buyers?
While the aggregate Q1 2026 figure is dominated by the modelled residual, the verified portion does identify specific national buyers with meaningful activity.
| Country | Reported Purchases (Tonnes) |
|---|---|
| Poland | 31t |
| Uzbekistan | 25t |
| Kazakhstan | 12t |
| Czech Republic | 5t |
| Malaysia | 5t |
| Guatemala | 2t |
| Cambodia | 2t |
| Indonesia | 2t |
| Serbia | 1t |
| UAE | 1t |
Source: IMF International Financial Statistics, Q1 2026 disclosures.
Poland's 31-tonne reported purchase continues a trend of European central bank accumulation that has been consistent since 2018. Uzbekistan and Kazakhstan represent the continued preference among Central Asian nations for gold as a primary reserve asset, partly driven by domestic production.
January 2026 Softness: A Monthly Data Point Worth Watching
Within the quarterly total, January 2026 saw a particularly soft monthly figure of approximately 5 tonnes of verified purchases. Against the prior 12-month average of roughly 27 tonnes per month, this represents a meaningful departure. Whether January softness reflects a seasonal reporting lag or a genuine deceleration in acquisition activity is a question the Q2 2026 report will need to help answer.
The China Factor: Strategic Opacity as a Buying Advantage
Official Reserves vs. What Analysts Actually Believe
The People's Bank of China officially reports central bank gold reserves of just over 2,300 tonnes, a figure that places China as one of the world's largest holders by disclosed reserves. Independent analyst estimates, however, place the true figure at well over 5,400 tonnes, implying that more than 3,100 tonnes have been accumulated without formal disclosure.
| Metric | Figure |
|---|---|
| Official PBOC Reported Reserves | ~2,300 tonnes |
| Independent Analyst Estimates | ~5,400+ tonnes |
| Estimated Undisclosed Accumulation | ~3,100+ tonnes |
Why Opacity Is a Feature, Not a Bug, for Strategic Buyers
The logic behind China's approach is straightforward from a market mechanics perspective. If a buyer of China's scale were to publicly announce an ongoing programme to acquire thousands of tonnes of gold, prices would react immediately, raising the average cost of accumulation. By keeping acquisition activity off official records, large buyers can execute their strategy at lower average prices over extended timeframes.
This same principle applies to sovereign wealth funds, which are often incorporated into the World Gold Council's central bank demand model even though their reporting obligations differ from those of monetary authorities. Russia, having been subject to financial sanctions since 2022, has largely ceased meaningful reporting to the IMF entirely.
These three categories of buyer — the PBOC, sovereign wealth funds, and the Russian Federation — likely account for the overwhelming majority of the modelled residual. None of them have structural incentives to increase their disclosure voluntarily.
The next major ASX story will hit our subscribers first
The Implied Price Gap: Does 244 Tonnes Actually Explain Gold's Performance?
What the Model Says Should Have Happened
One of the more analytically revealing tensions in the Q1 2026 data involves the relationship between reported demand and observed price movement. A demand modelling framework applied to the 244-tonne quarterly estimate implies that central bank purchases of that magnitude should theoretically have supported approximately a 12% price appreciation over the same period.
The actual observed price movement during Q1 2026 was approximately 8.2%. The gap between modelled demand and price behaviour creates two competing interpretations:
- Central bank demand was overstated relative to what actually occurred in markets
- Demand was broadly accurate, but offsetting factors including institutional selling or leveraged position unwinding absorbed more of the buying pressure than anticipated
Neither interpretation is comfortable for investors using central bank buying as a primary conviction driver. For broader context on gold safe-haven dynamics and how these factors interact with price performance, the picture is more nuanced than headline figures suggest.
Annual Demand Trends: Is the Structural Pace of Buying Decelerating?
From Record-Setting Volumes to a Meaningful Pullback
The aggregate annual demand picture reinforces the concern raised by the verification gap. After three consecutive years exceeding 1,000 tonnes, the 2025 estimate came in at 863 tonnes, representing a 21% year-on-year decline.
| Year | Estimated Annual Demand (Tonnes) | Year-on-Year Change |
|---|---|---|
| 2022 | ~1,136t | Record year |
| 2023 | ~1,037t | -9% |
| 2024 | ~1,045t | Flat |
| 2025 | ~863t | -21% |
Source: World Gold Council / Metals Focus annual demand estimates.
The compounding concern is that the 2025 decline occurred simultaneously with a reduction in verification rates. Lower totals being supported by less verified data creates a scenario where investors are being asked to extend more faith in the model at precisely the moment when the model's outputs are declining. According to Brookings Institution analysis, the strategic importance of gold reserves remains significant regardless of short-term demand fluctuations.
How Investors Should Interpret and Monitor These Figures Going Forward
Key Signals to Track Before and After the Q2 2026 Report
The World Gold Council's second quarter 2026 central bank demand report is expected to be published in late July or early August 2026. Investors monitoring the structural gold thesis should watch for the following signals:
- Whether the verified-to-residual ratio begins reverting toward pre-2022 norms, when reported data constituted the majority of headline totals
- Any changes in PBOC reporting behaviour, particularly following a sustained period of silence, which has historically preceded major disclosure events
- Whether the implied price model gap — specifically the divergence between demand-implied price appreciation and actual observed price movement — narrows or persists
- Whether reported sales figures, which totalled approximately 115 tonnes in Q1 2026, trend meaningfully higher relative to purchase activity
- Whether sovereign wealth fund acquisitions begin appearing in disclosed rather than modelled data, which would meaningfully improve headline credibility
The Distinction Between the Thesis and the Data
It is analytically important not to conflate the structural macroeconomic case for gold with the near-term demand data picture. The long-run drivers — reserve diversification away from dollar concentration, hedging against currency debasement, and geopolitical fragmentation of the global financial order — remain intact regardless of quarterly verification rates.
What the verification gap does introduce is uncertainty about the pace and magnitude of institutional accumulation, not necessarily the direction. The thesis can be correct while the headline tonnage figures carry wider confidence intervals than most investors assume. Understanding central bank buying trends in this broader context is therefore essential for any informed assessment.
The gold market has historically rewarded those who distinguish between what is disclosed and what is modelled. The structural case for sovereign accumulation is defensible. The precision of any specific quarterly figure is not.
Frequently Asked Questions: Central Bank Gold Buying Estimates
What Is the Difference Between Reported and Estimated Central Bank Gold Purchases?
Reported purchases refer to gold holdings disclosed directly to the IMF by central banks on a monthly basis. Estimated purchases include that verified data plus a modelled residual component derived from trade flows, refinery output, vault movements, and demand-side analysis. The headline figure most investors see combines both.
Why Do Some Central Banks Not Report Gold Purchases to the IMF?
Reporting is technically voluntary in practice, and several major holders — most notably China and Russia — have demonstrated willingness to remain silent for extended periods. Strategic buyers benefit from opacity because public disclosure of large accumulation programmes would drive up prices during the buying window.
How Accurate Are World Gold Council Demand Estimates Historically?
The 2009 and 2015 China disclosure events provided meaningful validation of the modelling approach. In both cases, independent analyst estimates derived from residual demand analysis were closely aligned with the tonnage China eventually disclosed. This does not eliminate variance, but it does establish the methodology as substantively credible.
What Does Residual Demand Mean in Gold Market Analysis?
Residual demand is the quantity of gold unaccounted for after all identified demand categories — including jewellery, technology, investment, and officially reported purchases — are subtracted from total estimated supply. This remainder is attributed to unreported central bank and sovereign wealth fund activity.
Did Central Banks Buy More or Less Gold in 2025 Compared to Previous Years?
Estimated central bank gold buying estimates for 2025 placed demand at approximately 863 tonnes, down 21% from the roughly 1,045 tonnes estimated for 2024 and well below the record 1,136 tonnes estimated for 2022.
Which Countries Were the Biggest Verified Gold Buyers in Q1 2026?
Poland led verified purchases at 31 tonnes, followed by Uzbekistan at 25 tonnes and Kazakhstan at 12 tonnes. The Czech Republic and Malaysia each reported 5 tonnes.
How Does China's Gold Buying Strategy Affect Global Demand Estimates?
Because China's PBOC is widely believed to be accumulating gold well in excess of its official disclosures, a large portion of the modelled residual in any given quarter is likely attributable to Chinese activity. If China were to disclose its true holdings, it would simultaneously validate the methodology and reshape the market's understanding of how much gold sovereign buyers have absorbed over the past decade.
Separating Structural Conviction From Modelling Uncertainty
The central bank gold buying estimates narrative has served as a powerful anchor for investor confidence in gold over the past three years. That anchor deserves neither blind faith nor reflexive dismissal. What it requires is precision about what is actually known versus what is inferred.
The World Gold Council and Metals Focus have constructed a methodology that is analytically sound, practically the best available, and historically validated through major disclosure events. The issue is not that the methodology is broken. The issue is that the variance around any specific quarterly estimate is wider than the headline figure implies, and that variance is widening as the verified portion of demand shrinks toward zero.
For long-term gold investors, the structural case — centred on currency debasement risk, reserve diversification, and geopolitical fragmentation of the dollar-centric financial system — remains analytically defensible. However, investors incorporating central bank buying as a near-term price floor should understand that the floor is constructed substantially from modelling assumptions rather than audited flows. That is not a reason to abandon the thesis. It is a reason to hold it with appropriate intellectual humility and to watch the data carefully as it evolves.
This article contains forward-looking analysis and references to modelled demand estimates. Modelled figures carry inherent uncertainty and should not be treated as confirmed transactional data. Past correlations between central bank demand and gold price performance are not necessarily indicative of future outcomes. This content is for informational purposes only and does not constitute financial advice.
Want to Stay Ahead of the Next Major Mineral Discovery on the ASX?
While sovereign gold accumulation shapes the macro backdrop, Discovery Alert's proprietary Discovery IQ model scans ASX announcements in real time — instantly identifying significant mineral discoveries across 30+ commodities and turning complex data into actionable opportunities, much like the historic finds made by De Grey Mining and WA1 Resources. Start your 14-day free trial today and see why serious investors trust Discovery Alert's discoveries page to understand the transformative returns that major discoveries can deliver.