August 11, 2026
The Two Clocks Running the Gold Market Simultaneously
Most commodity markets operate on a single dominant clock. Supply tightens, prices rise. Demand weakens, prices fall. Gold, by contrast, runs on at least two clocks simultaneously, and they are currently telling very different times. Central bank gold buying and Fed rate uncertainty represent these two competing forces — and understanding them is essential for any serious investor in 2026.
The first clock belongs to financial markets: it ticks in hours, resets with every inflation print, and responds to the probability-weighted expectations of what the Federal Reserve will do next. The second clock belongs to sovereign reserve managers: it advances in years, sometimes decades, and is calibrated to geopolitical risk, dollar dependency, and the long-arc reassessment of what constitutes a safe asset in an increasingly fragmented global order.
Right now, both clocks are running hard, and they are pointing in opposite directions. Understanding which one dominates, and over what time horizon, is the central challenge for any investor seeking to navigate the gold market intelligently in 2026.
When big ASX news breaks, our subscribers know first
How Fed Rate Uncertainty Transmits Into Gold Prices
The Opportunity Cost Mechanism and Why It Moves Markets Fast
When the Federal Reserve signals tighter monetary policy, or when financial markets begin pricing in a higher probability of a rate increase, the transmission into gold pricing is both rapid and mechanically predictable. The chain operates through a well-established pathway:
- Inflation data surprises to the upside, causing markets to revise their expectations for Fed action.
- The probability of a near-term rate hike rises, pushing short- and long-dated Treasury yields higher.
- Real yields increase, elevating the opportunity cost of holding a non-yielding asset like gold.
- Capital reallocates toward interest-bearing instruments, reducing speculative and financial demand for bullion.
- The US dollar firms, making gold more expensive in other currencies and further dampening global demand signals.
This is precisely the sequence that unfolded in August 2026. The September Federal Reserve rate hike probability shifted from 44% to 52% over a compressed window, driven in part by energy market disruptions near the Strait of Hormuz pushing crude oil toward one-week highs. That energy price pressure fed directly into inflation expectations, which in turn sustained upward pressure on the 10-year Treasury yield, lifting it to its highest level in more than a week.
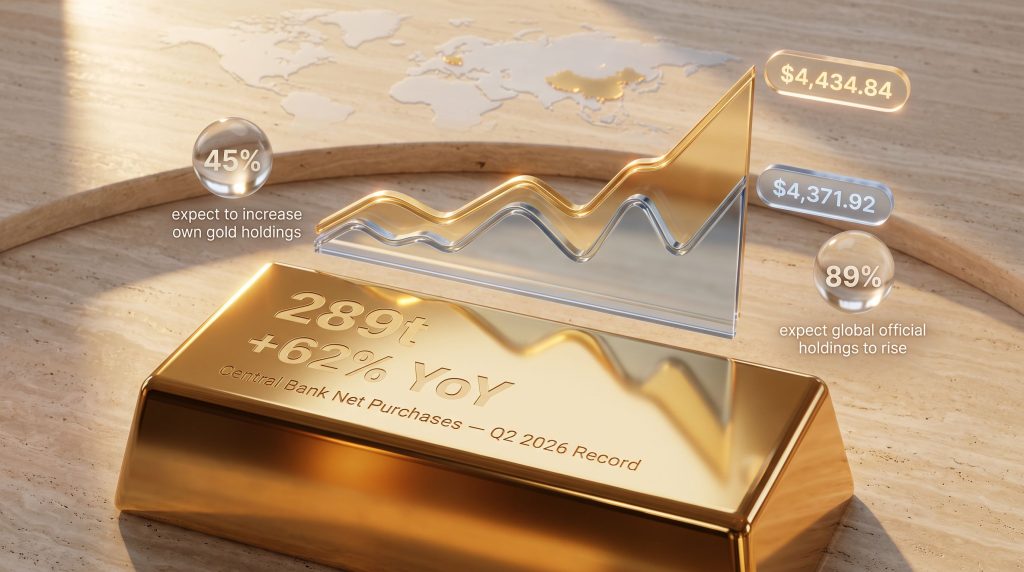
The result: spot gold retreated 0.4% to $4,371.92 per ounce, pulling back from a multi-month high of $4,434.84 established on June 5, 2026. The US Dollar Index (DXY) held broadly steady near 99.84, meaning the dollar's relative stability meant the rate-driven opportunity cost shift was doing most of the heavy lifting in explaining the pullback. For a broader view of where prices may head, the gold price outlook suggests upward momentum remains intact over the longer term.
The Oil-Inflation-Gold Triangle: An Underappreciated Transmission Channel
Most gold-focused analysis concentrates on the direct relationship between real yields and the gold price. Fewer analysts, however, focus on the secondary channel that runs through energy markets, even though it can be equally powerful in certain conditions.
The logic is straightforward:
- Rising oil prices elevate headline inflation expectations.
- Elevated inflation expectations increase the probability that central banks will maintain or extend their tightening bias.
- Higher-for-longer rate expectations push real yields up and gold down.
This creates a situation where geopolitical instability in energy-producing regions can transmit negative pressure onto gold prices through the inflation-rate pathway, even while the same instability might be expected to generate gold safe-haven demand. The two forces can partially or fully offset each other, creating price action that looks confusing at the surface level but is entirely coherent once the transmission channels are separated.
Cleveland Fed President Beth Hammack's stated preference for a measured and gradual approach to rate increases reinforced the market's view that the higher-for-longer policy posture remains intact, adding another layer of near-term headwind for bullion.
Central Bank Gold Buying: A Structural Force on a Different Timescale
Q2 2026 Demand Data and What It Actually Tells Investors
While financial markets were repricing rate expectations downward for gold, the physical market was sending an entirely different signal. According to World Gold Council data, central banks purchased a net 289 tonnes of gold in Q2 2026, representing a 62% increase year-over-year and a record for any second quarter in the data series.
This is not a marginal data point. To place it in context:
| Demand Metric | Q2 2026 | Comparative Context |
|---|---|---|
| Net Central Bank Purchases | 289 tonnes | Record for any Q2 on record |
| Year-over-Year Change | +62% | Highest YoY growth rate in recent cycles |
| Q1 2026 Net Demand | 244 tonnes | +17% quarter-over-quarter |
| Bar and Coin Demand (Q2) | 307 tonnes | Strong physical retail participation |
| Q1 vs. Five-Year Average | Above trend | Sustained above-average accumulation |
What makes this data particularly striking is the backdrop against which it occurred. Q2 2026 was also the quarter in which gold recorded its steepest quarterly price decline in a decade. Furthermore, central banks, in aggregate, purchased through that weakness at historically elevated volumes. This counter-cyclical buying behaviour is not a trading strategy — it is a reflection of reserve management objectives that are structurally insulated from short-term price volatility.
Which Nations Are Leading Sovereign Accumulation?
The accumulation is not uniformly distributed. Poland emerged as the single largest buyer during April 2026, adding 19 tonnes in a single month, a pace that reflects deliberate strategic rebalancing rather than opportunistic positioning. China extended its gold buying streak to 18 consecutive months, one of the most sustained accumulation runs by a major economy in the modern era.
The central bank gold demand story is further reinforced by the World Gold Council's survey of central bank reserve managers, which provided an equally significant forward signal:
- 45% of surveyed reserve managers expect to increase their own institution's gold holdings over the next 12 months.
- 89% of respondents expect global official gold holdings to rise over the same period.
The near-universal expectation among central bank reserve managers that sovereign gold holdings will increase over the next year represents one of the strongest forward demand signals available in any commodity market. This is not speculative positioning; it is a documented policy intention held by the institutions that collectively manage trillions in reserves.
Why Reserve Managers Buy Differently Than Financial Markets
Central banks are not price-sensitive buyers in the conventional sense. A portfolio manager running a gold ETF or a futures trader will typically reduce exposure when prices fall and increase it when momentum turns positive. Reserve managers, however, operate under an entirely different mandate.
Their decision to accumulate gold is driven by factors that are largely orthogonal to near-term price movements:
- De-dollarisation: Reducing the share of US dollar-denominated assets in reserve portfolios, particularly relevant for economies seeking to lower their exposure to US sanctions risk.
- Counterparty risk elimination: Gold held in physical form within a nation's own jurisdiction carries no counterparty risk, unlike sovereign bonds or currency reserves held in foreign financial institutions.
- Geopolitical hedging: The freezing of Russian central bank assets following the 2022 Ukraine invasion created a lasting reassessment among many sovereign reserve managers of the risk associated with holding foreign-currency-denominated reserves.
- Long-duration portfolio construction: Reserve management operates on multi-decade horizons, making short-term price drawdowns largely irrelevant to the accumulation calculus.
In addition, central bank buying trends indicate this behaviour is accelerating rather than plateauing, which has meaningful implications for long-term price support.
The ASGM Formalisation Signal: Supply-Side Infrastructure on a Multi-Year Clock
What the World Gold Council and Dynacor MOU Actually Means
While spot price volatility commands daily attention, a parallel development in the physical gold supply chain deserves equal analytical weight. The World Gold Council and Dynacor Group signed a Memorandum of Understanding to formalise artisanal and small-scale gold mining (ASGM) operations and expand processing capacity across Africa and Latin America.
This matters for several reasons that are not immediately obvious from the headline:
- ASGM accounts for approximately 20% of global gold production, making it the second-largest source of mined gold globally after large-scale industrial mining.
- The sector has historically operated outside formal regulatory frameworks, meaning its production is often untracked, unverified, and excluded from official supply statistics.
- Formalisation efforts improve traceability, environmental compliance, and processing efficiency, which over time has the potential to bring meaningful volumes of previously informal supply into transparent market channels.
- New processing infrastructure, once commissioned, operates on timelines measured in years, not quarters, making this a supply-side investment that is entirely decoupled from near-term rate expectations.
Differential Exposure Across the Gold Value Chain
One analytically important dimension of rate-driven gold price weakness is that its impact is not uniform across all participants in the gold sector. Consequently, the exposure profile varies significantly depending on where in the value chain a company or institution sits.
| Segment | Primary Revenue Driver | Spot Price Sensitivity | Rate-Driven Financing Risk |
|---|---|---|---|
| Junior Explorers | Equity market sentiment and capital raising | Very High | High |
| Development-Stage Projects | Project NPV, feasibility economics | High | High (discount rate impact) |
| Gold Processors (toll processing model) | Ore throughput volume and processing spreads | Moderate | Low to Moderate |
| Central Banks (reserve holders) | Long-duration strategic reserve value | Low | Negligible |
For junior developers specifically, rate-driven gold price weakness creates a compounding challenge. Lower spot price assumptions reduce project net present values, which in turn narrows financing headroom and can delay development timelines. Processors whose revenues are tied to throughput volumes rather than direct metal price exposure have a structurally more resilient revenue model during these periods.
Scenario Framework: What Comes Next for Gold?
Three Pathways Defined by the Upcoming Inflation Data
The near-term direction of gold prices is largely a function of what US inflation data reveals over the coming weeks. The two most consequential releases are the Consumer Price Index and the Producer Price Index, with retail sales data providing supplementary context on demand-side inflation pressures.
| Scenario | Trigger Condition | Impact on September Hike Odds | Expected Gold Price Direction |
|---|---|---|---|
| Base Case (Softer CPI) | Inflation prints below consensus | Hike odds retreat below 50% | Gold retests $4,434.84 resistance |
| Bear Case (Hotter CPI) | Inflation surprises to the upside | Hike odds remain above 52% | Extended pullback below $4,371.92 |
| Macro Wildcard | Geopolitical escalation in energy | Mixed inflation and safe-haven signals | Gold response ambiguous; physical demand likely holds |
The interplay between gold and bond dynamics is particularly relevant here, as shifts in the rate environment ripple directly through to real yield expectations and gold's relative attractiveness. Analysts at ING have also noted that gold's bull run is likely to continue into 2026, lending further weight to the structural case for the metal.
Diagnostic Questions for Assessing Any Rate-Driven Selloff
Before drawing investment conclusions from a period of gold price weakness, three diagnostic questions help separate structurally significant deterioration from mechanically driven temporary pressure:
- Is physical demand actually weakening, or is only financial demand retreating? If central bank buying and bar and coin demand remain robust while ETF flows and futures positioning soften, the selloff is financially driven, not a fundamental breakdown.
- Is the inflationary pressure behind the rate repricing durable or transient? Oil-price-driven inflation is historically more volatile and reversible than wage-driven or services-sector inflation. The former supports a shorter rate headwind timeline.
- Why is the dollar strengthening, if at all? Dollar firmness driven by rate differentials applies direct negative pressure on gold. Dollar strength driven by safe-haven flows can coexist with gold strength, making the mechanism matter as much as the direction.
Key Indicators to Monitor for the Next Gold Price Move
The Inflation Calendar as an Investor's Roadmap
For investors tracking central bank gold buying and Fed rate uncertainty simultaneously, the following data releases and market signals represent the most actionable near-term catalysts:
- US CPI Release: A softer print reduces September hike odds and Treasury yields, creating space for gold to recover toward $4,434.84. A hotter print extends the rate headwind and deepens the pullback.
- US PPI Release: Provides a leading indicator of upstream inflation, confirming or contradicting the consumer price signal and informing the durability of the current rate repricing.
- Retail Sales Data: Signals whether consumer demand is strong enough to sustain services-sector inflation, a key variable in the Fed's assessment of the rate path.
- Fed Communications: Speeches and published minutes from officials will be closely parsed for any moderation of the higher-for-longer posture that has dominated market expectations.
- China's Consecutive Buying Streak: Any interruption in China's 18-month accumulation programme would be widely interpreted as a significant shift in the world's most scrutinised sovereign gold demand story.
- Technical Level: $4,434.84 remains the key resistance. A sustained break above this level on soft inflation data would represent a technically meaningful confirmation that the rate headwind is fading.
The next major ASX story will hit our subscribers first
The Dual-Force Framework: Resolving the Apparent Contradiction
The most important analytical takeaway from the current gold market environment is that rate-driven price weakness and sovereign accumulation are not contradictory signals. They operate on different timescales and respond to entirely different decision-making frameworks.
| Force | Timescale | Current Direction | Gold Price Impact |
|---|---|---|---|
| Fed Rate Uncertainty | Weeks to months | Headwind (52% September hike odds) | Negative near-term |
| Central Bank Accumulation | Years to decades | Structural tailwind (289t Q2 buying) | Positive long-term |
| Physical Bar and Coin Demand | Months to years | Supportive (307t Q2) | Positive medium-term |
| ASGM Formalisation and Processing Investment | Multi-year | Supply-side capacity building | Neutral to positive long-term |
The analytical error that regularly misleads retail investors is treating these as competing explanations when they are in fact orthogonal forces operating simultaneously. Financial markets can push gold lower in the short term through the opportunity cost mechanism without any underlying deterioration in the structural demand that central bank buying represents.
The distinction between why prices are falling and whether the structural demand thesis is intact is arguably the single most important judgment call in gold market analysis. Getting it wrong in either direction carries significant opportunity costs: treating structural strength as a reason to ignore near-term weakness can lead to poor entry timing, while treating near-term weakness as structural deterioration can cause investors to abandon a thesis at exactly the wrong moment.
The evidence from Q2 2026 is unambiguous on the physical side: 289 tonnes of net central bank purchases, 307 tonnes of bar and coin demand, and a formalisation MOU that brings ASGM supply chain investment into transparent market structures. Research from Crux Investor similarly highlights how Federal Reserve repricing pressures gold in the near term while central bank demand anchors the long-term outlook. The financial side is equally unambiguous in the opposite direction over a shorter horizon: 52% September hike odds, elevated real yields, and a spot price that has pulled back from its most recent multi-month peak.
Recognising both realities simultaneously — and resisting the cognitive pull toward a single explanatory narrative — is what separates disciplined analysis of central bank gold buying and Fed rate uncertainty from reactive market commentary.
Disclaimer: This article is intended for informational and educational purposes only and does not constitute financial advice. All price levels, probability figures, and demand statistics referenced reflect conditions as reported at the time of writing. Forecasts and scenario analyses are speculative in nature and should not be relied upon as the basis for investment decisions. Readers should conduct their own due diligence and consult a qualified financial adviser before making any investment.
Want to Track the Next Major ASX Mineral Discovery Before the Broader Market Does?
While gold's dual-force dynamics play out across different timescales, Discovery Alert's proprietary Discovery IQ model delivers real-time alerts the moment significant mineral discoveries are announced on the ASX — cutting through the noise to surface actionable opportunities for both short-term traders and long-term investors. Explore historic discoveries and their exceptional returns, then start your 14-day free trial at Discovery Alert to position yourself ahead of the market.