
August 11, 2026
The Institutional Logic Behind Gold's Dip-Buying Cycle in 2026
Most commentary on gold prices focuses on what the Federal Reserve will do next. That framing misses the more consequential dynamic currently shaping the market: a systematic, regime-dependent rotation mechanism operating inside Chinese institutional portfolios. Understanding Chinese gold ETF inflows and gold dip buying is arguably more useful for assessing gold's structural floor than any single macroeconomic data release. For a broader perspective, the gold market outlook for 2025 and beyond provides essential context for understanding these dynamics.
Gold's behaviour in mid-2026 offers a textbook illustration of how multiple independent demand sources can converge to create price support that is far more durable than sentiment-driven momentum. The metal touched a two-month high near $4,435 per ounce on August 11, 2026, before profit-taking trimmed gains. That pullback was absorbed within hours. The buyer absorbing it was not retail speculation. It was systematic institutional capital rotating out of a fractured domestic equity market.
When big ASX news breaks, our subscribers know first
Why Portfolio Construction Logic, Not Sentiment, Is Driving Chinese Gold ETF Inflows
When crowded positions in domestic Chinese equities unwind, institutional allocators face an immediate practical problem: they must redeploy large volumes of capital quickly into assets with sufficient market depth. The options are narrower than most investors assume. Fixed income in a managed-rate environment offers limited upside. Cross-border capital deployment is constrained by currency convertibility restrictions. Real estate remains structurally impaired following years of sector deleveraging.
That leaves gold. It is the only asset class that simultaneously offers deep global liquidity, zero counterparty exposure, and a market large enough to absorb institutional-scale reallocation without significant slippage.
The July 2026 equity selloff provided the catalyst. China's broad CSI 300 index fell approximately 10% over the month, its most severe monthly contraction in a decade, according to Bloomberg. Technology-oriented indices fell considerably harder as momentum in AI-related equities unwound aggressively. Institutional allocators facing mark-to-market losses on concentrated positions needed an exit that would not compound those losses through illiquidity premiums.
Critically, gold had already pulled back roughly 21% from its January 2026 all-time high of $5,589.38 before this recovery phase. From the perspective of a portfolio manager rotating out of a cracked equity position, that drawdown represented a discounted entry point into the most liquid non-sovereign store of value available globally.
The Step-by-Step Rotation Mechanism
-
Equity crowding reaches saturation — Domestic Chinese institutional and retail capital concentrates heavily in high-momentum sectors, particularly AI and technology equities through the first half of 2026
-
De-risking catalyst arrives — The CSI 300 declines approximately 10% through July, forcing position reduction across momentum-driven funds
-
Capital seeks a liquid, zero-counterparty alternative — Gold, already trading at a significant discount to its January peak, meets both criteria simultaneously
-
Domestic ETF flows accelerate — Institutional demand channels through Chinese gold ETFs, creating sustained, measurable buying pressure across 14 consecutive trading sessions
-
Intraday dips are absorbed systematically — Repeated institutional buying at price weakness reinforces technical support and compresses the effective trading range
Market Psychology Insight: The distinction between sentiment-driven buying and systematic institutional reallocation is not academic. Sentiment reverses on news cycles. Systematic portfolio reallocation operates on multi-week to multi-month durations. Investors who confuse the two will consistently misread the durability of price support.
Decoding the 2026 Chinese Gold ETF Flow Data
The flow record for Chinese gold ETF inflows and gold dip buying in 2026 is one of the most analytically rich datasets in the modern gold market. Rather than a uniform trend, it reveals a conditional, regime-dependent allocation pattern that switches direction based on the relative attractiveness of domestic equities versus gold. According to data on Chinese gold ETF inflows from Kitco, record Q1 inflows were driven by a confluence of investors, wholesalers, and the PBoC acting in concert.
| Period | Flow Direction | Volume | Market Context |
|---|---|---|---|
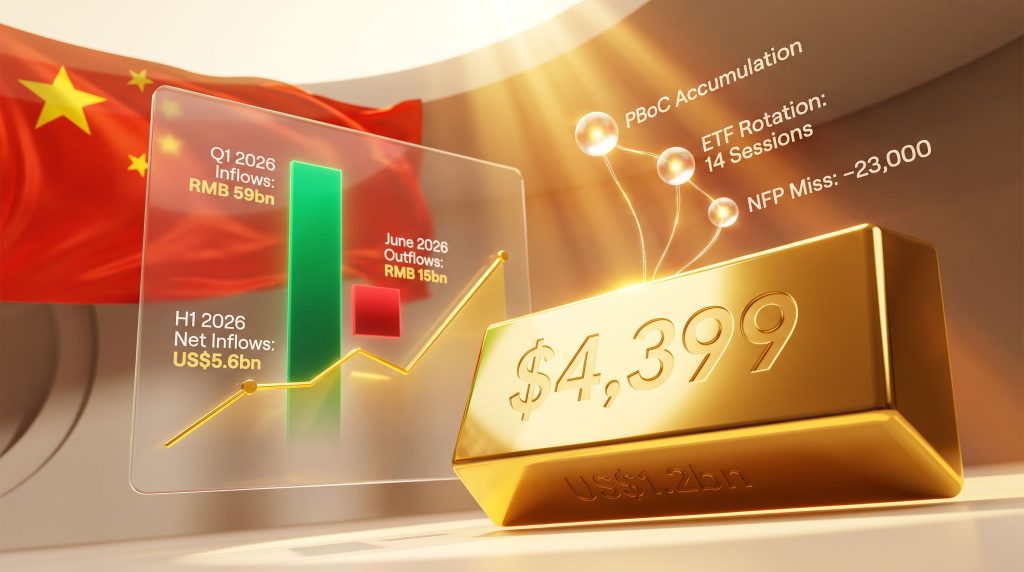
| Q1 2026 (Full Quarter) | Inflows | ~RMB 59bn (US$8.5bn) | Record quarterly inflow; holdings rose 50 tonnes to 298 tonnes |
| March 2026 | Inflows | ~RMB 12bn (US$1.7bn) / 8.4 tonnes | Explicit dip-buying despite weak local gold price |
| June 2026 | Outflows | ~RMB 15bn (US$2.2bn) | Record single-month outflow; domestic equity recovery triggered profit-taking |
| H1 2026 (Full Period) | Net Inflows | ~RMB 40bn (US$5.6bn) | Second-strongest first half on record despite June reversal |
| Late July to August 11, 2026 | Inflows | US$1.2bn over 14 consecutive sessions | Longest inflow streak since March; single-day peak of US$370 million |
Several observations from this dataset carry significant analytical weight. First, the June 2026 record monthly outflow of approximately US$2.2 billion is just as important as the inflow periods. It confirms that Chinese institutional gold demand is not structurally unconditional. When domestic equities recover sufficiently to offer competitive returns, capital flows back. This regime-dependency is a feature of the mechanism, not a flaw in the thesis.
Second, the 14-session consecutive inflow streak through August 11, confirmed as the longest since March by Bloomberg, accumulated US$1.2 billion in total. A single-session peak of US$370 million indicates this is institutional-scale positioning rather than a retail-driven accumulation pattern. Retail investors rarely move that volume through a single instrument in a single session.
Third, the H1 2026 net inflow of US$5.6 billion ranks as the second-strongest first-half performance ever recorded for Chinese gold ETFs, despite June erasing a material portion of earlier gains. This underscores the structural, not episodic, nature of the overall demand trajectory.
Three Conditions Governing Flow Direction
-
Condition A: Price weakness combined with equity market stress leads to accelerating inflows as gold is treated as a liquid, discounted safe-haven alternative
-
Condition B: Price weakness combined with recovering domestic equity momentum produces rapid, large-scale outflows as profit-taking and equity rotation dominate
-
Condition C: Price stabilisation following a drawdown sees outflows narrow and systematic dip-buying resume as allocators rebuild positions at discounted levels
The Three Structural Demand Layers Establishing Gold's Floor
Gold's current price support is not a single-source story. Three structurally distinct demand categories are operating simultaneously, each driven by a different institutional logic and operating on a different time horizon.
Layer One: People's Bank of China Official Reserve Accumulation
The People's Bank of China has maintained a multi-year consecutive gold reserve accumulation programme. Official-sector buying of this kind is largely price-insensitive within normal trading ranges, meaning it establishes a reliable baseline demand floor that does not disappear when gold prices rise modestly. Furthermore, central bank gold demand globally has been running at elevated levels since 2022, with the World Gold Council documenting consecutive years of above-average official purchases. China's participation in this trend is well-documented, though the precise monthly figures are reported with a lag.
Layer Two: Institutional ETF Rotation Demand
The 14-session inflow streak through August 11, 2026, totalling US$1.2 billion, represents the second independent demand layer. This is not speculative positioning. It is systematic reallocation driven by domestic portfolio construction decisions triggered by the July equity drawdown. Its duration extends beyond any single macroeconomic data release.
Layer Three: US Macroeconomic Repricing
The July 2026 US non-farm payrolls report delivered a significant shock. Payrolls fell by 23,000 against a Dow Jones consensus expectation of an 83,000 gain, a miss of approximately 106,000 positions. This single data point reduced the probability of a Federal Reserve September rate hike by roughly 14 percentage points, according to CME FedWatch data. Gold closed above $4,300 for the first time since early June on August 7, immediately following the payrolls release, and held that level through subsequent sessions.
Why Three Layers Matter More Than One: When official-sector accumulation, institutional ETF rotation, and macroeconomic repricing align simultaneously, the resulting price floor carries a structural durability that no single catalyst can easily dismantle. A hot CPI print may compress gold toward the lower end of its trading range. It cannot eliminate a floor built on three independent demand sources.
The CPI Question: What Chinese Institutional Flows Actually Respond To
A common analytical error is to evaluate Chinese gold ETF inflows through the lens of US inflation data. The two variables operate on different frequencies and respond to different inputs.
The mechanical relationship between CPI and gold is well-established: a headline reading above consensus revives Federal Reserve rate-hike speculation, strengthens the US dollar, and lifts real yields. Since gold carries no yield, rising real yields increase the opportunity cost of holding it, creating downward price pressure. The inverse applies when inflation prints soft. In addition, the gold safe-haven dynamics at play reveal how these mechanics interact with broader investor behaviour.
What this means in practice:
| CPI Scenario | Impact on Gold Price | Impact on Chinese ETF Inflows |
|---|---|---|
| Hot print (above 3.4% YoY) | Headwind: dollar strengthens, real yields rise | Minimal: rotation logic is equity-driven, not CPI-calibrated |
| In-line print (~3.4% YoY) | Neutral: September Fed decision remains uncertain | Neutral |
| Soft print (below 3.3% YoY) | Tailwind: real yields compress, path to $4,500 clears | Marginal acceleration possible |
The July CPI consensus stood at 3.4% year-over-year headline with core CPI expected at 2.5%. Whether the actual print lands above or below that level matters for the mechanical real-yield relationship with gold. It does not alter the underlying allocation logic driving Chinese institutional flows, which is calibrated to the performance of domestic equity markets rather than US monetary policy cycles.
The Mirror-Image Divergence: China Buys While the West Sells
One of the most structurally significant and underreported features of the 2026 gold market has been the divergence between Chinese and Western institutional ETF behaviour. During the same period that Chinese gold ETFs accumulated approximately US$8.1 billion in net inflows through April 2026, US gold ETFs recorded net outflows over the equivalent period.
Identical asset. Two of the world's largest capital markets. Diametrically opposed allocation decisions.
This divergence is not random. It reflects fundamentally different portfolio construction environments. The World Gold Council's global gold-backed ETF holdings and flows data illustrates this East-West split in remarkable detail, confirming the structural divergence visible throughout H1 2026.
-
Chinese institutional context: Domestic equity volatility, limited cross-border investment alternatives due to managed currency convertibility, a cultural and policy-level orientation toward gold as a monetary reserve asset, and a rapidly expanding domestic ETF market providing accessible vehicle for institutional gold exposure
-
Western institutional context: Competing yield-generating alternatives in a higher-rate environment that raises the opportunity cost of holding non-yielding gold, different regulatory frameworks governing institutional allocation, and index-tracking mandates that reduce discretionary reallocation flexibility
Chinese gold ETF assets under management reached approximately RMB 304 billion (US$44 billion) by end of Q1 2026, with total holdings of 298 tonnes following a 50-tonne quarterly increase. While SPDR Gold Shares alone holds in excess of US$70 billion, the velocity and directional consistency of Chinese ETF flows have exerted disproportionate influence on short-term gold price dynamics throughout 2026. Understanding central banks and gold allocation decisions is equally important for contextualising this divergence.
The next major ASX story will hit our subscribers first
The Long-Duration Structural Case: US Fiscal Arithmetic
Beyond the immediate flow dynamics and monetary policy calendar, a longer-duration structural argument underpins gold's floor that is independent of both Chinese equity conditions and Federal Reserve decisions.
US federal debt has surpassed $39 trillion, with annual interest servicing costs exceeding $1 trillion. These arithmetic constraints shape the Fed's operating environment in ways that individual inflation prints cannot alter. An institution managing over $39 trillion in sovereign debt obligations faces structurally different constraints on its ability to sustain high real interest rates than it did in previous tightening cycles when the debt stock was materially smaller.
This fiscal context matters for gold because it represents a constraint on the credibility and duration of high real yield environments. Consequently, if the Fed's practical ability to sustain elevated rates is limited by the cost of debt servicing, then real yields face a structural ceiling that sets a corresponding structural floor for gold over multi-year horizons. The interplay between gold and bond dynamics is particularly instructive here.
Long-Term Perspective: Investors focused exclusively on the next CPI print or the next Fed meeting are analysing gold on a time horizon that is poorly matched to the structural forces actually driving its multi-year appreciation trend. The fiscal arithmetic does not change on a monthly basis, but it accumulates pressure over years.
Key Takeaways: Reading the Chinese Dip-Buying Signal Correctly
-
14 consecutive sessions of Chinese gold ETF inflows through August 11, 2026, totalling US$1.2 billion, confirm the longest institutional accumulation streak since March
-
Single-day peak inflow of US$370 million signals institutional-scale positioning rather than retail-driven momentum buying
-
Record June outflow of US$2.2 billion establishes that Chinese flows are regime-dependent and can reverse sharply when domestic equity conditions improve
-
H1 2026 net inflows of US$5.6 billion rank as the second-strongest first-half result on record for Chinese gold ETFs, confirming structural rather than episodic demand
-
Three simultaneous demand layers (PBoC accumulation, institutional ETF rotation, US macroeconomic repricing) are collectively building a price floor with multi-source durability
-
Gold at approximately $4,399 per ounce as of August 11, 2026, absorbed an intraday pullback from a two-month high near $4,435 within a single session, demonstrating the absorption capacity of current institutional demand
The most actionable insight from the 2026 Chinese gold ETF inflows and gold dip buying cycle is not the headline inflow figure itself. It is the conditional logic that governs when flows turn on and off. Investors who can identify the equity-rotation trigger, recognise official-sector accumulation as a price-insensitive demand floor, and separate macro noise from structural allocation dynamics will assess gold's durability with considerably greater precision than those who react to daily price movements or individual data releases.
Disclaimer: This article is for informational and educational purposes only and does not constitute financial, investment, or purchasing advice of any kind. All data and figures referenced are sourced from publicly available reporting as of August 11, 2026. Past performance is not indicative of future results. All investments, including precious metals, involve risk and may result in partial or total loss. Always consult a qualified financial advisor before making investment decisions. Sources include Bloomberg (August 4, 2026), InvestingLive (August 7, 2026), Yahoo Finance (August 11, 2026), USAGOLD (August 7, 2026), South China Morning Post (July 8, 2026), and GoldSilver.com price data.
Want to Track the Next Major Mineral Discovery Before the Broader Market Does?
Discovery Alert's proprietary Discovery IQ model scans ASX announcements in real time, instantly converting complex mineral data across 30-plus commodities into clear, actionable insights — giving subscribers a decisive edge the moment a significant discovery is announced. Explore historic discoveries and the exceptional returns they've generated, then begin your 14-day free trial to position yourself ahead of the market.