
June 22, 2026
The Valuation Gap That Central Bank Gold Buying Has Created in Developer Equities
Across modern financial history, the periods of greatest opportunity in resource equities have rarely announced themselves clearly. They tend to emerge from structural dislocations, moments when the fundamental demand architecture for a commodity strengthens materially while equity markets, preoccupied with near-term macro noise, fail to reprice the underlying assets. The relationship between central bank gold buying and gold developer equities in mid-2026 fits this pattern with unusual precision.
Sovereign institutions are accumulating gold at rates that place quarterly purchasing within striking distance of the threshold institutional analysts associate with sustained price appreciation. Meanwhile, a specific and theoretically reversible monetary policy constraint is suppressing the Western ETF inflows that would ordinarily close the gap between current spot prices and the $5,400 to $6,300 per ounce targets maintained by Goldman Sachs and JPMorgan respectively. The result is a measurable valuation discount in gold developer equities that quantifiable triggers could close by 17 to 37%.
Understanding why that gap exists, how it closes, and which developer profiles capture the re-rating first requires working through three interconnected analytical layers: the structural mechanics of sovereign reserve diversification, the stagflationary policy trap constraining the Federal Reserve, and the mathematical leverage that gold developers carry to any upward repricing of the metal itself.
When big ASX news breaks, our subscribers know first
Sovereign Reserve Architecture Is Undergoing a Structural Shift
Why Gold Has Become the Reserve Asset of a Fragmented Monetary World
The International Monetary Fund's Currency Composition of Official Foreign Exchange Reserves data has documented a sustained decline in the US dollar's share of global reserves over the past decade. With US fiscal deficits running at approximately 6 to 7% of GDP, sovereign reserve managers in multiple jurisdictions have concluded that concentration in dollar-denominated assets carries long-duration risks that no yield premium adequately compensates.
Gold occupies a unique position in this context. It carries no counterparty risk, imposes no exposure to any single nation's monetary decisions, and holds formal IMF recognition as an official reserve asset, a status that distinguishes it categorically from other commodity stores of value. These characteristics are not new, but their relevance has intensified as geopolitical fragmentation has made sovereign reserve diversification a policy priority rather than a tactical allocation decision. According to Brookings Institution research, central bank gold holdings play a critical role in underpinning national financial stability, further reinforcing this structural shift.
Q1 2026 Central Bank Purchasing: The Numbers Behind the Thesis
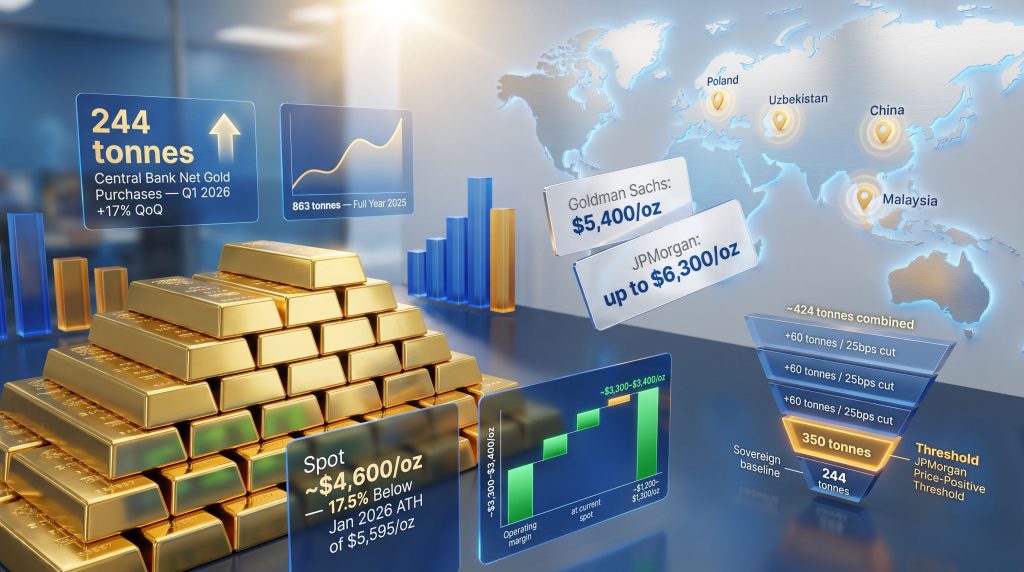
World Gold Council data for Q1 2026 establishes the scale of this structural commitment with measurable specificity. Furthermore, central bank buying trends confirm that central banks collectively purchased a net 244 tonnes of gold during the quarter, representing a 17% increase from Q4 2025 and placing quarterly sovereign demand above the five-year quarterly average.
The country-level breakdown reveals deliberate, policy-driven accumulation rather than opportunistic buying:
| Central Bank | Q1 2026 Purchase | Notable Context |
|---|---|---|
| National Bank of Poland | 31 tonnes | Explicit 700-tonne national target; holdings now at 582 tonnes |
| Central Bank of Uzbekistan | 25 tonnes | Gold now represents 87% of total national reserves |
| People's Bank of China | 7 tonnes | More than doubled Q4 2025 pace; total holdings reach 2,313 tonnes (~9% of reserves) |
| Bank Negara Malaysia | Resumed purchases | First accumulation in seven years |
Poland's accumulation pattern is particularly instructive. The National Bank of Poland has publicly disclosed a target of 700 tonnes, transforming gold purchasing from a portfolio management exercise into a sovereign policy mandate with a defined endpoint. Uzbekistan's 87% gold reserve allocation reflects a different calculus entirely, one where gold is not a diversification tool but the primary reserve asset. Malaysia's resumption after a seven-year pause signals renewed institutional conviction across a geographically distinct jurisdiction.
The Annual Baseline Confirms This Is Structural, Not Episodic
Full-year 2025 central bank gold demand reached 863 tonnes in net purchases, below the record 1,092 tonnes recorded in 2024 but substantially above the historical norms that preceded 2022. Two consecutive years of elevated sovereign accumulation confirm that this is a durable shift in reserve policy architecture rather than a response to any single geopolitical event.
The World Gold Council's estimated annual central bank demand range of 700 to 900 tonnes covers most of the incremental growth in global mine supply before a single tonne of Western ETF demand is counted. This creates a demand floor independent of retail and institutional sentiment in Western markets.
The Federal Reserve Policy Trap and Its Effect on Gold Pricing
Why Gold Is Trading 17.5% Below Its All-Time High Despite Strong Fundamentals
Gold spot pricing near $4,600 per ounce in mid-2026 sits approximately 17.5% below the January 29, 2026 all-time high of $5,595 per ounce. The correction is not explained by weakening sovereign demand, which has remained robust by historical standards. It is explained by a specific, identifiable, and potentially reversible mechanism: geopolitically driven energy price inflation has kept US consumer price pressures elevated at levels that remove Federal Reserve rate-cutting capacity.
The transmission mechanism is straightforward. Higher nominal interest rates increase the opportunity cost of holding non-yielding assets. Gold, which generates no coupon or dividend, becomes comparatively less attractive relative to yield-bearing alternatives when real rates rise. This dynamic suppresses inflows into Western gold exchange-traded funds, which collectively absorbed approximately 500 tonnes of gold demand during 2025 but have seen that demand channel contract materially in 2026.
The Stagflationary Configuration: A Policy Bind With No Clean Exit
The Q1 2026 macroeconomic data present the Federal Reserve with a configuration in which neither of its conventional policy responses is available without cost.
| Macroeconomic Indicator | Q1 2026 Reading | Policy Implication |
|---|---|---|
| US Real GDP Growth (annualised) | 2.0% | Below 2.3% consensus; weakening trend |
| PCE Deflator | 4.5% | Eliminates rate-cutting capacity |
| Consumer Spending Growth | 1.6% | Demand softening visible |
| FOMC Rate Decision (April 29, 2026) | Hold at 3.5–3.75% | 8–4 vote, most divided since October 1992 |
| Cash Real Return | Approximately -4.5% annually | Purchasing power erosion in progress |
The April 29, 2026 FOMC vote to hold rates passed 8 to 4, recorded as the most internally divided Federal Reserve policy decision in more than three decades according to Federal Reserve Board records. The split reflects genuine disagreement about which risk is more dangerous: cutting rates and re-accelerating inflation that is already running at 4.5% on the PCE deflator, or holding rates and compressing an economy growing below consensus at 2.0% annualised.
In a stagflationary environment, gold's zero nominal yield becomes structurally less penalising than it appears in standard rate-cycle analysis. Equities face margin compression as input costs rise and consumer demand softens. Fixed income loses real purchasing power when inflation exceeds nominal yields. Cash erodes at precisely the rate of PCE inflation, currently 4.5% annually. Gold, carrying no counterparty risk and no duration exposure, occupies a comparatively advantaged position across all three competing asset classes simultaneously.
A critical but underappreciated dimension of the current stagflationary configuration is the source of inflation itself. Middle East conflict-driven energy price elevation is the primary driver of PCE persistence. This matters because it is a supply-side inflation mechanism rather than a demand-side one, meaning it could resolve faster than a demand-driven inflationary cycle, potentially reopening the rate-cutting window without requiring deliberate Fed policy action to compress growth.
What Institutional Price Targets Reveal About the Suppressed Demand Gap
Goldman Sachs and JPMorgan Forecasts: Quantifying the Re-Rating
In addition to the sovereign demand backdrop, current gold price forecasts from major institutions highlight a significant premium to current spot pricing.
| Institution | Year-End 2026 Gold Price Target | Premium to Current Spot (~$4,600/oz) |
|---|---|---|
| Goldman Sachs | $5,400/oz | ~+17% |
| JPMorgan | Up to $6,300/oz | ~+37% |
Both institutions identify the same catalytic sequence. Once energy-driven inflation moderates and Federal Reserve rate-cut pricing re-enters market expectations, the suppressed Western ETF demand that has been absent from Q1 2026 purchasing data is expected to unlock. Goldman Sachs has quantified the elasticity of this relationship, estimating that each 25 basis point rate reduction generates approximately 60 additional tonnes of ETF demand within a six-month window.
Modelling the Demand Cascade From Rate Cuts to Price-Positive Territory
JPMorgan identifies 350 tonnes per quarter as the demand threshold above which gold prices have historically risen on a sustained basis, with every incremental 100 tonnes estimated to add approximately 2% to the quarter-on-quarter gold price.
The demand arithmetic under a rate-cutting scenario is instructive:
- Sovereign baseline (Q1 2026): 244 tonnes of net central bank purchases already on record
- Gap to JPMorgan's price-positive threshold: approximately 106 tonnes before ETF flows are counted
- Three 25 bps rate cuts: estimated to generate approximately 180 additional tonnes of ETF demand within six months (3 x 60 tonnes)
- Combined demand scenario: 244 + 180 = approximately 424 tonnes, materially above the 350-tonne price-positive threshold
This analysis reveals why the current gold price sits where it does. Sovereign demand alone is insufficient to push combined quarterly demand past JPMorgan's threshold, but the addition of even a partial recovery in Western ETF inflows would push the aggregate well into price-positive territory.
The Developer Leverage Equation: Why Junior Equities Offer Disproportionate Upside
How Discounted Cash Flow Models Amplify Gold Price Movements Into NPV Expansion
Gold developers are valued primarily through discounted cash flow models that embed a long-term gold price assumption. This creates a mathematical asymmetry that is less well understood by generalist investors than it should be. When the gold price assumption in a DCF model rises, the incremental revenue above the fixed operating cost base flows almost entirely to the bottom line.
Because costs are largely fixed, a 20% increase in the modelled gold price does not produce a 20% increase in after-tax net present value. It produces a multiple of that increase, with the exact amplification determined by the ratio of operating costs to revenue. Consequently, the gold outlook for miners at current spot near $4,600 per ounce is particularly pronounced for developers whose feasibility studies were constructed at $2,000 to $2,500 per ounce base cases.
AISC Margin Expansion at Current Spot: What the Numbers Mean
| AISC Range | Current Spot (~$4,600/oz) | Operating Margin per Ounce | Original Study Base Case |
|---|---|---|---|
| ~$1,200–$1,300/oz | $4,600/oz | ~$3,300/oz | $2,500/oz assumed |
| ~$1,300/oz | $4,600/oz | ~$3,300/oz | $2,500/oz assumed |
| ~$1,500/oz | $4,600/oz | ~$3,100/oz | $2,000/oz assumed |
The figures in the table above represent a compounding of two separate effects. First, the gold price itself is materially above the level at which feasibility economics were originally constructed. Second, the operating margin per ounce at current spot is generating theoretical cash flow that was structurally unmodelled when the investment case was originally presented to the market. Institutional DCF models that have not been updated to reflect $4,600 per ounce spot are systematically undervaluing the assets they are evaluating.
The Lassonde Curve and Commissioning Risk Removal
A concept well understood within the mining investment community but less familiar to generalist investors is the Lassonde Curve, the observed pattern by which resource company valuations tend to decline during the development and construction phase before recovering sharply as first production approaches and commissioning risk is removed. Developers approaching production represent the point on this curve where risk is declining but the equity re-rating has not yet fully occurred.
The combination of an improving gold price environment and commissioning milestone achievement creates a dual re-rating catalyst. Furthermore, gold's impact on equities at the developer stage is amplified precisely because fixed-cost structures mean that even modest gold price increases translate into disproportionate NPV expansion. This does not require the gold price to move at all to generate meaningful equity appreciation.
Developer Profiles Positioned to Capture the Re-Rating
Brazil: Heap Leach Construction Approaching Commissioning
Cabral Gold's Phase 1 gold-in-oxide heap leach project at the Cuiú Cuiú Gold District in Pará State, Brazil, represents a construction program approximately 70% complete as of late April 2026, with 85% of project costs committed under contract. Commissioning is now targeting June 2026, ahead of the original Q3 2026 schedule.
The Updated Pre-Feasibility Study filed in July 2025 was constructed on a $2,500 per ounce base-case gold price, generating an after-tax IRR of 78% with an AISC of approximately $1,200 to $1,300 per ounce. At current spot near $4,600 per ounce, the margin above AISC expands to approximately $3,300 per ounce, a figure that was entirely unmodelled when the study economics were published.
Alan Carter, President and CEO of Cabral Gold, has confirmed that the company is on schedule and on budget and is actively transitioning from a junior developer to a junior producer, having secured financing as committed and now focused on execution. The capital commitment structure, with 85% of costs locked under contract, substantially reduces completion risk relative to developers at earlier construction stages.
Heap leach processing carries specific metallurgical characteristics that are relevant to this investment thesis. The process involves stacking crushed ore on lined pads and applying a leaching solution, typically cyanide-based, that percolates through the ore and extracts gold. For oxide deposits, recoveries are typically in the 70 to 85% range. The capital intensity is substantially lower than conventional milling circuits, which is why the project's AISC of $1,200 to $1,300 per ounce is achievable at Phase 1 scale. This cost structure positions Cabral at the lower end of the global cost curve, maximising the operating margin benefit from current gold pricing.
Nevada: Self-Funded Development Eliminating Dilution Risk
Integra Resources operates from a structurally differentiated position among Nevada developers. The Florida Canyon Mine currently generates gold production and internally funds permitting, drilling, and technical studies across the broader portfolio, eliminating the near-term equity dilution risk that characterises most development-stage companies.
The April 29, 2026 approval of the Exploration Plan of Operations for the Wildcat Deposit increases drill capacity, with the investment implication being capital efficiency rather than capital expenditure. Production-funded development compresses the timeline to an H2 2027 Pre-Feasibility Study without requiring balance sheet expansion.
George Salamis, President, CEO and Director of Integra Resources, has outlined a production growth profile targeting 80,000 to 90,000 ounces per year in both 2027 and 2028, with 2026 positioned as a capacity-building year at Florida Canyon to deliver higher volumes, stronger cash flow, and lower unit costs going forward. This trajectory is funded from existing operations, not from equity markets.
Nevada: Scale as an Independent Re-Rating Catalyst
Hycroft Mining's February 18, 2026 Initial Assessment Technical Report documented a 55% increase in measured and indicated resources to 16.4 million ounces of gold and 562.6 million ounces of silver. A high-grade silver zone at Brimstone and Vortex containing 90.2 million ounces is under active technical evaluation by RESPEC.
The balance sheet position is notable: US$189 million in cash with zero debt as of March 31, 2026. This eliminates financing risk as a discount factor in institutional DCF models, a category of risk that typically adds 200 to 400 basis points to the discount rate applied to development-stage assets.
Diane Garrett, President and CEO of Hycroft Mining, has noted that the high-grade silver discovery has shifted institutional attention toward the project in a meaningful way, with the consensus view among institutions being alignment with the company's vision and development plan. The silver component is particularly significant because the Brimstone and Vortex zones were not part of the original resource base, meaning the 90.2 million ounce high-grade intercept represents genuinely new information rather than a restatement of existing resources.
Newfoundland: Financing Closing as a Milestone Signal
New Found Gold's Queensway Gold Project in Newfoundland and Labrador has advanced from discovery drilling to development-stage planning, with a July 2025 Preliminary Economic Assessment defining an initial production profile. The April 27, 2026 closing of a C$115 million financing package signals institutional conviction in the project's development trajectory.
The cash flow arithmetic at current spot is direct. Keith Boyle, CEO of New Found Gold, has described an initial production profile targeting approximately 100,000 ounces per year in the first two years at an all-in sustaining cost of approximately $1,300 per ounce. At current gold pricing near $4,600 per ounce, that operating margin generates potential cash flow well in excess of the capital deployed to build the project, making the financing decision straightforward from an institutional capital allocation perspective.
Ontario: High-Grade Vein Systems and Milestone Delivery
West Red Lake Gold Mines has reported drill intercepts including 471 g/t Au over 1 metre from Vein 013, with a 2025 PEA delivering a 42% after-tax IRR at US$1,800 per ounce gold, a price level now substantially below current spot. The economics at $4,600 per ounce are considerably more compelling than those presented in the base-case study.
Shane Williams, President and CEO of West Red Lake Gold Mines, has attributed the anticipated equity re-rating to consistent milestone delivery, noting that the company has committed to a program, executed on that program steadily, and expects the market to recognise that track record as subsequent milestones are achieved. This framing is significant: in the junior mining sector, management credibility is a discount rate input. Teams with verified delivery records command lower institutional risk premiums than those without one.
The next major ASX story will hit our subscribers first
The De-Dollarization Thesis Extends to Critical Minerals
Rare Earths and Copper: Supply Chain Concentration Creates Parallel Demand Dynamics
The same sovereign reserve diversification logic driving central bank gold buying and gold developer equities is generating structural procurement demand in critical minerals. China controls approximately 85 to 90% of global rare earth refining capacity, creating strategic supply chain vulnerabilities for the United States, European Union, and Australia that are now being addressed at the policy level. As analysts at Crux Investor have noted, de-dollarisation and Fed policy constraints are creating wide valuation discounts in gold developer equities that parallel the dynamics now emerging in critical minerals.
Cobra Resources holds what it describes as Australia's only in-situ recovery (ISR) amenable rare earth project, a processing approach that avoids conventional open-pit mining and the associated environmental footprint. The carbonate product grades at 42.94% heavy rare earth elements and 38.9% magnet rare earth elements, with impurities below 0.9%. CSIRO sequential leach testing has confirmed recoveries of up to 25% using tap water alone, a result that has meaningful implications for processing cost structures.
Robert Vero, Managing Director of Cobra Resources, has outlined the product differentiation case, noting that the company's optimised flowsheet produces one of the highest proportions of heavy rare earth mixed rare earth carbonates globally, with dysprosium and terbium content of approximately 4.5% and heavies at 43% in the mixed carbonate, produced through one of the lowest-cost mining methods available. The company also holds an option over the 1,855 square kilometre Manna Hill Copper Project in South Australia's Nackara Arc, where initial drilling returned 74 metres at 1.02% copper.
ISR mining, also known as solution mining, involves dissolving minerals in place using injected solutions and then pumping the mineral-bearing solution to surface for processing. For rare earth deposits with suitable carbonate mineralogy, it eliminates the capital intensity of conventional open-pit development and the tailings management requirements of traditional processing. The CSIRO validation of water-only leach recoveries is technically significant: it suggests the deposit's mineralogy is amenable to extraction without the chemical inputs that typically define rare earth processing costs and environmental risk profiles.
Risk Framework: Three Scenarios That Could Delay the Re-Rating
Evaluating the Downside Cases Before Allocating Capital
The re-rating thesis is internally consistent and quantitatively grounded, but investors should, however, understand the scenarios under which the expected repricing is delayed or reduced in magnitude.
Risk 1: Hawkish Federal Reserve Policy Pivot
A shift toward tighter monetary policy, particularly under new Federal Reserve leadership, could raise real yields and strengthen the US dollar. A stronger dollar increases the cost of gold accumulation for non-US reserve managers and raises the opportunity cost of holding the metal. This scenario would push spot prices toward the $4,300 to $4,400 range and extend the timeline before suppressed ETF demand unlocks.
Risk 2: Rapid Geopolitical Resolution
A faster-than-anticipated normalisation of energy supply conditions could deflate the geopolitical risk premium embedded in current gold pricing. While this scenario theoretically opens the door to rate cuts, it could also trigger a brief disorderly sell-off in gold before ETF demand has time to re-enter the market in sufficient volume. The net price effect could be temporarily negative even as the underlying fundamental case improves.
Risk 3: Project-Specific Execution Failures
Even during a broad sector re-rating, individual developers can significantly underperform if construction cost overruns, permitting delays, or geotechnical surprises emerge. The re-rating thesis for the sector is only as strong as the verified execution milestones underpinning each specific project.
Investor Checklist for Assessing Developer Re-Rating Readiness:
- What percentage of project capital is committed under contract, reducing completion risk?
- Has the commissioning timeline been independently confirmed and is it ahead of schedule?
- Is the AISC structure validated against current input cost environments, including diesel and labour?
- What is the permitting status within the relevant regulatory jurisdiction?
- Does the management team have a verified track record of milestone delivery?
- Does the balance sheet support development without near-term equity dilution?
The Investment Thesis: A Quantifiable Gap With Identified Triggers
The relationship between central bank gold buying and gold developer equities in mid-2026 presents a rare convergence of structural and cyclical factors that are simultaneously measurable and actionable.
The structural case rests on sovereign demand that has placed quarterly central bank purchases within 106 tonnes of JPMorgan's price-positive threshold before a single tonne of Western ETF demand is counted. A PCE deflator at 4.5% against 2.0% GDP growth has created a monetary policy environment in which cash loses 4.5% of its purchasing power annually while gold's zero nominal yield becomes comparatively advantaged across equities, fixed income, and cash simultaneously.
The cyclical trigger is specific and quantifiable: Goldman Sachs estimates that each 25 basis point Federal Reserve rate cut generates approximately 60 additional tonnes of ETF demand within six months. Three cuts would push combined quarterly demand to approximately 424 tonnes, well above the threshold associated with sustained price appreciation. The institutional price targets of $5,400 to $6,300 per ounce sit 17 to 37% above current spot, with the re-rating mechanism identified, quantified, and contingent on a single reversible variable: the energy-inflation constraint that is currently preventing rate cuts from being priced into the market.
Developers with permitted assets, advancing construction programs, committed capital costs, and low AISC structures are mathematically positioned to capture this re-rating disproportionately. The NPV leverage embedded in their discounted cash flow models ensures that a 17 to 37% move in the gold price assumption does not translate to a 17 to 37% move in after-tax net present value. The amplification through fixed-cost operating structures means the equity re-rating, when it arrives, is likely to be substantially larger than the metal price move itself.
This article is intended for informational purposes only and does not constitute financial advice. Forecasts, price targets, and scenario projections referenced herein reflect the stated views of third-party institutions and are subject to material uncertainty. Investors should conduct their own due diligence and consult a qualified financial adviser before making investment decisions. Past performance of commodity prices and equity valuations is not a reliable indicator of future results.
Want to Be First When the Next Major ASX Mineral Discovery Hits the Market?
Discovery Alert's proprietary Discovery IQ model delivers real-time alerts on significant ASX mineral discoveries, cutting through complex data to surface actionable opportunities the moment they emerge — explore historic discoveries and their returns to see what early positioning can mean, then begin your 14-day free trial at Discovery Alert to ensure you're ahead of the market when the next re-rating catalyst arrives.