July 28, 2026
The Price-Insensitive Buyer: What Sovereign Reserve Behaviour Reveals About the Global Monetary System
There is a category of financial market participant that economists have traditionally modelled as highly price-sensitive: the institutional buyer operating under fiduciary constraints, performance benchmarks, and public accountability. Central banks, in theory, belong to this category. Their reserve management decisions are expected to be disciplined, deliberate, and responsive to valuation signals. What has unfolded across global gold markets since 2022 challenges that assumption at a fundamental level, and the Q1 2026 data crystallises the anomaly with unusual clarity.
When the price of an asset doubles within a single year and institutional demand accelerates rather than contracts, something structurally significant is occurring beneath the surface of quarterly statistics. Understanding what that something is requires looking past the volume figures and examining the architecture of motivation driving sovereign reserve managers toward central bank gold buying at record prices.
When big ASX news breaks, our subscribers know first
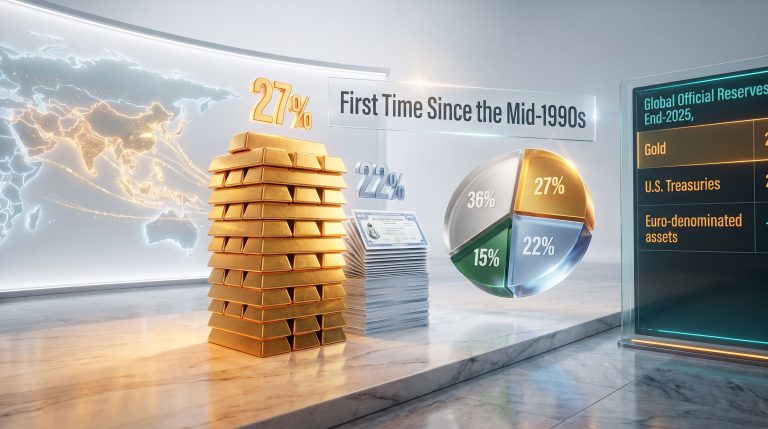
Why Price Is No Longer the Primary Variable for Sovereign Gold Demand
Gold reached $5,405 per ounce in January 2026. Rather than triggering demand moderation, this milestone was followed by accelerating accumulation. According to the World Gold Council's Gold Demand Trends report published April 29, 2026, central banks purchased a net 244 metric tonnes during Q1 2026 alone. That figure represents a 3% increase year-over-year and a 17% jump from Q4 2025's 208 tonnes, marking the fastest pace of sovereign accumulation in over twelve months.
The conventional supply-and-demand model predicts volume contraction as prices rise. That model has been systematically invalidated. The five-year quarterly average for central bank purchases is itself approximately double the average from the preceding five-year period, according to World Gold Council historical data. Sovereign buyers are not simply continuing a trend; they are compressing it upward.
The Reserve Manager's Strategic Horizon
The reason price sensitivity has effectively disappeared from sovereign gold decision-making lies in the fundamental difference between institutional reserve management and portfolio investment. Reserve managers are not optimising for quarterly returns. They are managing against systemic risks operating on decade-long timeframes.
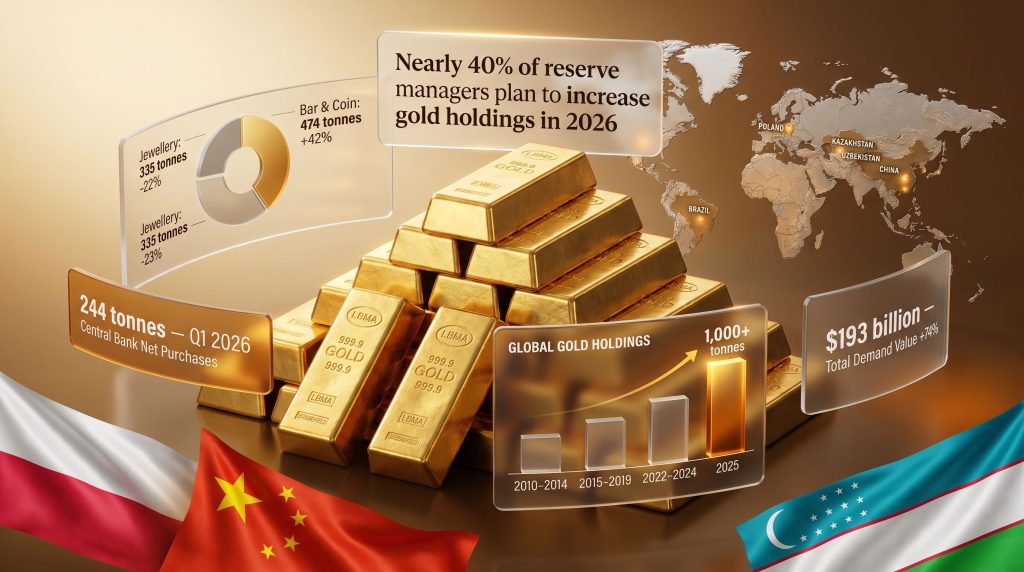
An HSBC Reserve Manager Survey from 2026 documented that nearly 40% of reserve managers indicated plans to increase gold holdings during the year, with the majority explicitly noting that prevailing price levels were not a deterrent to their accumulation strategy. This is not speculative positioning or momentum chasing. It is a structural repositioning of sovereign balance sheets driven by the following interconnected forces:
- Counterparty risk elimination: Physical gold held domestically carries no exposure to foreign custody arrangements or issuer default risk.
- Currency purchasing power erosion: The US dollar's gold-purchasing power was effectively halved between January 2025 and January 2026, a deterioration mirrored across ten major fiat currencies according to World Gold Council data.
- Reserve diversification away from dollar-denominated assets: Geopolitical precedents since 2022 have altered the risk calculation for sovereign institutions holding assets in Western custody.
- Portfolio construction shifts: The traditional 60/40 stock-and-bond framework is losing structural validity as equities and bonds increasingly move in the same direction, eliminating fixed income's hedging utility.
Furthermore, central bank gold demand has proven remarkably resilient even as asset valuations reach historically elevated levels, reinforcing the view that sovereign accumulation is driven by strategic rather than tactical considerations.
How the Current Cycle Compares Historically
| Period | Avg. Annual Net CB Purchases | Primary Driver |
|---|---|---|
| 2010–2014 | ~400–450 tonnes | Post-GFC reserve diversification |
| 2015–2019 | ~550–600 tonnes | Emerging market accumulation |
| 2022–2024 | 1,000+ tonnes | Geopolitical shock and asset-freeze precedent |
| 2025 | 863 tonnes | Sustained at historically elevated levels |
| 2026 (projected) | ~700–900 tonnes | Structural demand at record prices |
The post-2022 step-change in accumulation volume was not a cyclical fluctuation. It was a response to a specific geopolitical event: the freezing of Russian sovereign assets held in Western financial infrastructure. That event sent an unambiguous signal to non-Western reserve managers that dollar-denominated reserves held in foreign custody carry confiscation risk under geopolitical stress conditions. Gold held domestically eliminated that exposure entirely.
Mapping Who Is Accumulating and What the Patterns Reveal
The geographic distribution of Q1 2026 purchases illuminates a deliberate multi-polar reserve strategy rather than a series of unrelated national decisions. In addition, the breadth of participation across both emerging and developed market institutions points to a broad-based reassessment of central bank gold reserves as a core component of sovereign balance sheet management.
Q1 2026 Leading Sovereign Buyers
| Nation | Q1 2026 Purchases | Strategic Context |
|---|---|---|
| Poland | 31 tonnes | Progressing toward a 700-tonne total reserve target; currently holds ~582 tonnes |
| Uzbekistan | 25 tonnes | Consistent accumulator leveraging domestic mine production access |
| China | 7 tonnes (Q1) + 8 tonnes (April) | 17–18 consecutive months of purchases; total holdings ~2,313 tonnes |
| Kazakhstan | Ongoing | Highest annual accumulation since records began in 1993 |
| Brazil | 43 tonnes (Q3–Q4 2025) | Concentrated three-month accumulation episode |
Poland's trajectory provides one of the clearest examples of transparent reserve target-setting among major accumulators. The National Bank of Poland has publicly communicated its 700-tonne objective, and the 31-tonne Q1 2026 purchase demonstrates institutional follow-through at velocity. At this pace, Poland is on track to reach its target within approximately four to five years.
Uzbekistan's accumulation model is structurally distinct from market-dependent buyers. The country hosts the Muruntau deposit, one of the world's largest gold mining operations, providing the central bank with access to newly produced gold before it reaches international markets. This domestic-production-linked acquisition model offers both potential cost advantages and operational confidentiality compared to institutions that must source gold through the London Bullion Market or similar venues.
China's consecutive monthly buying pattern represents a methodological shift from its historical approach of infrequent, large-block disclosures. The transition toward smaller, sustained monthly additions reduces market impact per transaction and allows for more precise reserve management. As of April 2026, China's total gold reserves stood at approximately 2,313 tonnes, placing it among the largest sovereign holders globally alongside Russia, which maintains holdings of over 2,300 metric tonnes.
The Unreported Demand Layer
A frequently overlooked dimension of sovereign gold accumulation is the systematic gap between reported purchases and total physical flows. The World Gold Council estimates unreported buying by tracking discrepancies between global supply-demand flows and officially declared acquisitions. When more gold moves through markets than declared demand categories account for, the residual points to sovereign accumulation that has not yet been disclosed.
Some central banks disclose purchases one to three quarters after execution. Others accumulate incrementally over extended periods before announcing aggregate changes to official reserves. When unreported demand is incorporated into total sovereign accumulation estimates, the structural pressure on available physical gold supply is materially greater than published quarterly totals suggest.
Understanding Why Some Central Banks Sold Gold in Q1 2026
Approximately 115 tonnes in reported gold sales occurred across central banks and sovereign wealth funds during Q1 2026. Understanding the motivations behind these transactions is as analytically important as tracking the purchase side.
The Seller Landscape: Liquidity Management, Not Strategic Exit
| Seller | Volume | Nature of Transaction |
|---|---|---|
| Turkey | ~70 tonnes (official reserves) + 80 tonnes (swap arrangements) | Liquidity management; swap futures with gold returning on maturity |
| Azerbaijan (SOFAZ) | ~22 tonnes | Partial reversal of 53 tonnes accumulated in 2025 |
| Russia | ~22 tonnes | Domestic fiscal management purposes |
Turkey's transactions demand careful interpretation. Central Bank of Turkey Governor Fatih Karahan confirmed that the majority of the transactions were structured as gold-currency swap futures rather than outright dispositions. Under swap arrangements, gold is temporarily deployed in exchange for foreign currency liquidity, with the gold returning to reserves when contracts mature.
Turkey executed comparable arrangements during financial stress episodes in 2020 and 2023, and rebuilt reserves fully on both occasions. This distinction matters enormously for analytical purposes. Deploying gold through a structured swap to manage short-term foreign exchange pressures is categorically different from deciding to reduce long-term gold reserve exposure.
The swap framework preserves the central bank's strategic commitment to gold as a reserve asset while accessing temporary liquidity. Turkey's historical pattern of deploying and then reconstituting reserves establishes this as a cyclical stress-management mechanism, not a conviction reversal. However, despite the identified sales, net central bank demand remained firmly positive across Q1 2026, confirming that the seller-side activity did not alter the structural direction of sovereign accumulation.
The Macro Forces That Cannot Be Reversed Quickly
Central bank gold buying at record prices does not occur in isolation from broader macroeconomic architecture. Three structural forces are sustaining the accumulation cycle regardless of short-term price volatility. Consequently, understanding these forces is essential for interpreting the durability of sovereign demand.
Force 1: Fiat Currency Purchasing Power Deterioration
Gold priced in US dollars approximately doubled between January 2025 and January 2026, moving from roughly $2,700 to over $5,400 per ounce. From the inverse perspective, the dollar's capacity to purchase gold was halved within a single calendar year. World Gold Council data confirms this deterioration was not isolated to the US dollar; broadly similar purchasing power erosion occurred across ten major fiat currencies simultaneously.
This is not a new trend. It is an acceleration of a pattern that has been unfolding for decades, now operating at a pace that compresses what previously took five to ten years into a single calendar year.
Force 2: Reserve Architecture Vulnerability
The 2022 precedent of Western nations restricting access to Russian sovereign reserves held in foreign custody fundamentally altered the risk model for non-Western institutions. Before this event, holding dollar-denominated bonds in Western clearing systems was considered essentially risk-free for sovereign institutions. After it, those same instruments carried demonstrable confiscation risk under geopolitical stress.
Physical gold stored domestically carries no equivalent exposure, making it the cleanest available reserve asset for institutions managing geopolitical risk. This is closely tied to the broader global monetary shift now reshaping how sovereign institutions across multiple regions approach reserve asset composition.
Force 3: Portfolio Construction Breakdown
The 60/40 portfolio model depended on bonds and equities exhibiting negative correlation, so that when equities declined, bond prices rose and cushioned portfolio drawdowns. That correlation has shifted in the current macroeconomic environment, with elevated inflation creating conditions where both asset classes can decline simultaneously.
Some institutional allocators are exploring replacing the fixed income allocation with gold, effectively creating a 60/40 stock-and-gold framework. This represents a material structural shift in institutional demand beyond the central bank accumulation cycle. Gold in the monetary system is, consequently, being reassessed not merely as a reserve diversifier but as a foundational portfolio anchor.
The Structural Transformation of Physical Gold Demand
Sovereign accumulation is operating within a broader physical demand landscape that has undergone a generational transformation.
Q1 2026 Global Gold Demand Breakdown
| Demand Category | Q1 2026 Volume | Year-over-Year Change |
|---|---|---|
| Bar and Coin | 474 tonnes | +42% |
| Central Bank Net Purchases | 244 tonnes | +3% |
| ETF Net Inflows | 62 tonnes | Positive |
| Technology Applications | 82 tonnes | +1% |
| Jewellery Fabrication | 335 tonnes | -23% |
| Total Demand Value | $193 billion | +74% |
The total demand value increase of 74% year-over-year was driven primarily by gold's price appreciation rather than volume growth, which rose approximately 2%. This distinction illustrates how value accumulation in gold markets can detach from physical volume metrics, a feature of store-of-value assets operating in inflationary environments.
The 25-Year Demand Composition Inversion
The structural shift within physical demand categories is one of the least-discussed but most consequential long-term trends in gold markets. Two decades ago, jewellery fabrication accounted for approximately 800 tonnes of Q1 demand. By Q1 2026, that figure had contracted below 400 tonnes. The decline has been gradual and persistent rather than cyclical, reflecting a fundamental reclassification of gold's primary social function.
Where that jewellery demand went is equally significant. Bar and coin investment, which was negligible by volume twenty-five years ago, has grown into the largest single physical demand category. China alone accounted for a record 207 tonnes in bar and coin purchases during Q1 2026, surpassing the previous quarterly record of 155 tonnes set in Q2 2013. This is not a temporary response to price momentum. It represents a structural shift in how Asian populations conceptualise gold: less as ornament, more as primary monetary savings instrument.
The simultaneous positive performance across all major gold demand categories in Q1 2026 — including central banks, physical investment, ETFs, and technology — represents a convergence of institutional, retail, and industrial demand that has rarely been documented within a single quarter. When demand drivers across entirely different buyer segments all strengthen concurrently, the structural signal is materially more significant than any single category's performance in isolation.
The next major ASX story will hit our subscribers first
Does Sovereign Accumulation Actually Move Gold Prices?
This is a legitimate analytical debate. One perspective holds that central bank volumes are insufficient to single-handedly drive prices in a global market of significant depth, and that retail and speculative flows represent the more immediate price-setting mechanism. However, the structural evidence supports a more nuanced interpretation.
The Supply Absorption and Timing Mechanism
Central banks have maintained a net buying position in all but two quarters over the past sixteen years, according to World Gold Council data. In both exceptional quarters where net selling occurred, gold prices either stagnated or declined. This correlation does not establish causation definitively, but it is consistent across multiple market cycles.
More significant is the timing pattern. When sovereign accumulation clusters and intensifies, major price advances have historically followed within approximately 12 to 18 months. The 2024 to 2026 price rally followed concentrated buying in late 2022 and throughout 2023. The 2018 accumulation cluster preceded a similar pattern. Central banks may not be the marginal price-setter on any given trading day, but their sustained purchasing creates a structural demand floor that alters the risk-reward profile of the asset class.
The supply absorption dynamic reinforces this interpretation. In November 2025, central bank purchases represented approximately 15% of total monthly global mine output at record price levels. Consistent removal of physical inventory from available market supply at that scale creates scarcity dynamics that operate independently of speculative positioning. Furthermore, gold safe-haven demand from non-sovereign buyers has amplified these supply dynamics, compounding pressure on available physical inventory.
The 2026 Demand Outlook and Scenario Analysis
The World Gold Council's full-year 2026 projection for central bank purchases sits at 700 to 900 tonnes, broadly consistent with 2025 levels and well above historical pre-2022 averages. According to analysis of recent buying trends, several demand drivers suggest this projection is well-supported:
- Asian physical demand remains the dominant growth engine, with China's bar and coin market operating at record quarterly volumes.
- Eastern ETF inflows are more than compensating for Western fund outflows, maintaining net positive ETF demand globally despite geographic rotation.
- Geopolitical risk premiums show no structural reduction pathway on a near-term horizon, sustaining safe-haven allocation demand.
- Portfolio reallocation from traditional 60/40 frameworks toward gold-inclusive allocations is gaining institutional traction.
- Price momentum attracting buyers: High prices are paradoxically drawing additional buyers in certain markets, a behavioural dynamic consistent with store-of-value asset classes where rising prices reinforce perceived utility rather than suppressing it.
Scenario Analysis: What Could Alter the Trajectory?
| Scenario | Probability | Likely Impact on Central Bank Buying |
|---|---|---|
| Coordinated global monetary tightening restoring real yields | Low-moderate | Modest demand moderation; structural buying likely continues |
| Sustained geopolitical de-escalation and dollar credibility restoration | Low | Temporary slowdown; long-term diversification rationale remains |
| Gold price correction of 20% or more | Moderate | Likely accelerates sovereign accumulation rather than reduces it |
| Emergence of a credible alternative reserve asset | Very low | Structural threat; no viable candidate currently exists |
The scenario analysis reveals an asymmetric risk profile for sovereign gold demand. Events most likely to occur (price corrections, temporary geopolitical easing) would probably intensify rather than reduce accumulation. Events that could structurally reduce demand (dollar credibility restoration, alternative reserve asset emergence) rank as low-probability within any reasonable near-term timeframe.
What the Central Bank Signal Means Beyond Gold Markets
The analytical significance of central bank gold buying at record prices extends beyond its implications for the gold price itself. Sovereign reserve managers are among the most sophisticated institutional market participants in the global financial system. They operate with access to macroeconomic intelligence, geopolitical analysis, and systemic risk assessment capabilities that exceed most private sector equivalents.
When these institutions collectively accelerate accumulation of a single hard asset at valuations that would normally deter price-sensitive buyers, the behaviour constitutes a systemic signal about the perceived trajectory of the monetary system they are responsible for managing. The five-year trend, the post-2022 step-change, the price insensitivity documented in the HSBC survey data, and the geographic breadth of accumulation all point in a consistent direction.
Investors operating with a shorter time horizon than sovereign reserve managers may weigh that signal differently. But dismissing it entirely — when the cumulative weight of sovereign purchasing behaviour represents one of the clearest institutional consensus signals in contemporary financial markets — would require an unusually confident counter-thesis. For instance, research on why central banks continue buying at soaring prices underscores that the structural rationale for accumulation remains firmly intact.
The data does not make investment decisions. But it does clarify what some of the world's most consequential financial institutions currently believe about the trajectory of monetary value.
Data sources: World Gold Council Gold Demand Trends Q1 2026 (published April 29, 2026); World Gold Council Central Banks Gold Demand Trends Full Year 2025; HSBC Reserve Manager Survey 2026; Metals Focus; ICE Benchmark Administration; Bloomberg. This article is for informational purposes only and does not constitute investment advice. Past performance is not indicative of future results. All investments involve risk. Consult a qualified financial adviser before making investment decisions.
Want to Spot the Next Major Mineral Discovery Before the Broader Market Does?
Discovery Alert's proprietary Discovery IQ model delivers real-time alerts on significant ASX mineral discoveries, instantly translating complex data across more than 30 commodities into clear, actionable insights for investors at every level — start your 14-day free trial today, or explore Discovery Alert's dedicated discoveries page to understand how historic mineral discoveries have generated substantial returns for early-positioned investors.