
May 12, 2026
Understanding the Hidden Economics of Central Bank Money Creation
Modern central banking operates through mechanisms that create substantial wealth transfers, often invisible to the general public. When central banks expand monetary bases beyond economic growth rates, they generate what economists term an inflation tax COVID stimulus that systematically redistributes purchasing power across different economic segments. This process accelerated dramatically during the pandemic response period, creating long-lasting financial consequences that continue affecting American households.
The transmission mechanism operates through multiple channels, beginning with direct monetary injection into financial systems. Central banks create electronic reserves to purchase government securities, removing assets from markets while simultaneously expanding the monetary base. This process suppresses government borrowing costs while pushing investors toward riskier assets, inflating prices across financial markets before affecting consumer goods.
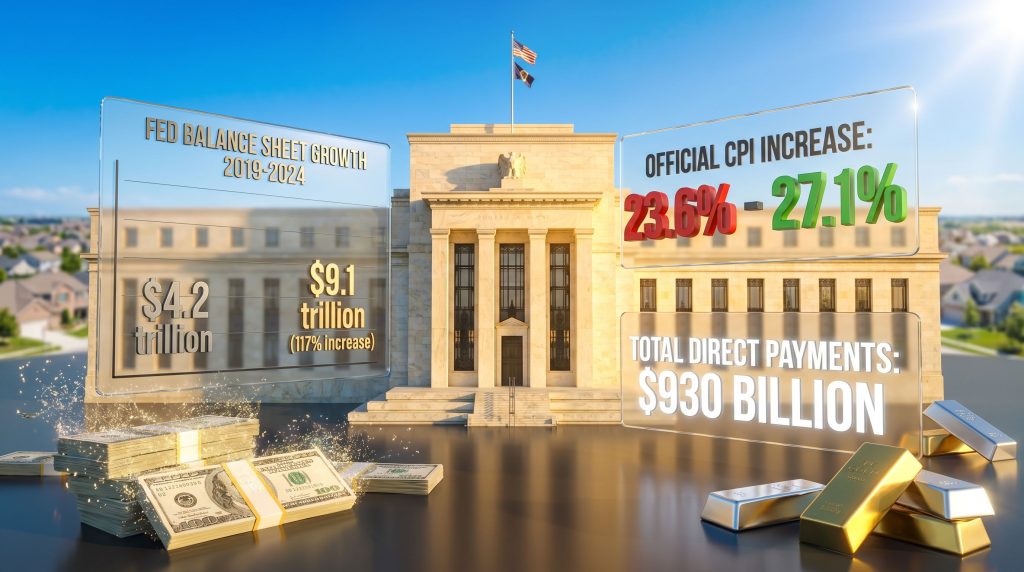
Historical precedent demonstrates this pattern repeatedly. Post-World War II monetary accommodation, the stagflation period of the 1970s-early 1980s, and the European Central Bank's response to the 2008-2009 financial crisis all exhibited similar wealth transfer dynamics. The Federal Reserve's balance sheet expansion from $4.16 trillion in January 2020 to $9.16 trillion by June 2021 represents a 120% increase in just 18 months, dwarfing previous monetary expansions in both scale and speed.
When big ASX news breaks, our subscribers know first
Quantifying the True Scale of Pandemic Fiscal Response
The economic impact payments distributed during the COVID-19 pandemic totaled $930 billion across three legislative acts, representing direct cash transfers that fundamentally altered money supply dynamics. This figure encompasses $290 billion from the CARES Act ($1,200 per eligible adult), $165 billion from the December 2020 Consolidated Appropriations Act ($600 per person), and $475 billion from the March 2021 American Rescue Plan ($1,400 per person).
Beyond direct payments, the broader pandemic response exceeded $5 trillion in total spending across unemployment insurance expansions, business loans, and various emergency lending facilities. The Reserve Bank of Australia's analysis provides valuable insights into how central bank operations facilitated these massive fiscal transfers. The Federal Reserve simultaneously expanded its Treasury securities holdings from $2.48 trillion to $5.75 trillion, while mortgage-backed securities holdings increased from $1.38 trillion to $2.72 trillion.
Federal Reserve Balance Sheet Timeline Analysis
| Date | Balance Sheet Size | Annual Change | Key Policy Actions |
|---|---|---|---|
| January 2020 | $4.16 trillion | Baseline | Pre-pandemic operations |
| March 2020 | $4.70 trillion | +13% | Emergency facilities activated |
| June 2020 | $7.23 trillion | +74% | Peak monthly purchases ($120B) |
| June 2021 | $9.16 trillion | +120% | Maximum expansion |
| December 2022 | $7.71 trillion | +85% | Balance sheet reduction |
| April 2026 | ~$7.20 trillion | +73% | Current sustained levels |
The monetary base expansion from $4.01 trillion to $6.74 trillion (68% increase in 21 months) created unprecedented liquidity conditions. Money supply measures M1 and M2 both increased approximately 40-41% from January 2020 to January 2021, representing the fastest peacetime monetary expansion in modern American history.
Regional distribution patterns revealed significant disparities in stimulus impact. Higher-income regions with substantial asset ownership captured indirect benefits through asset price appreciation, while lower-income areas showed higher marginal propensities to consume direct payments immediately. This differential consumption behaviour contributed to sectoral inflation variations that persist today.
Wealth Transfer Mechanics Through Monetary Policy Operations
The Cantillon Effect describes how newly created money benefits recipients in temporal order, creating systematic wealth transfers independent of policy intentions. First recipients typically include financial institutions, government contractors, and asset holders who gain purchasing power before inflation manifests. Last recipients, predominantly wage earners and fixed-income populations, experience price increases before their incomes adjust accordingly.
Asset ownership concentration amplifies these transfer effects significantly. According to the Federal Reserve's 2022 Survey of Consumer Finances:
- Top 10% of households control 89% of all stock wealth
- Top 10-25% control 8% of stock wealth
- Bottom 75% control merely 3% of stock wealth
- Median stockholding among top 10%: $193,600
- Median stockholding among bottom 50%: $0
Asset Price Performance During Quantitative Easing Period
The wealth transfer operated primarily through asset price inflation during 2020-2021. Furthermore, precious metals demonstrated strong performance, reinforcing their role as gold as an inflation hedge during monetary expansion periods:
- S&P 500: +68.6% (March 2020 low to December 2021)
- Nasdaq-100: +97.5% (same period)
- Home prices (Case-Shiller): +25.7% (2020-2021)
- Gold: +25% (January 2020 to December 2021)
- Bitcoin: approximately 413% (from ~$9,300 to ~$47,700)
Commercial banks held approximately 16% of marketable Treasury securities during peak QE operations, while mutual funds and ETFs controlled another 13%. This concentration meant that newly created reserves flowed disproportionately to institutions managing wealth for higher-income demographics.
The velocity of money remained depressed throughout 2020-2021 due to pandemic-induced behavioural changes, including reduced consumption of services, increased savings rates, and uncertainty-driven spending delays. However, as behavioural patterns normalised in mid-2021, the combination of excess money supply and recovering demand generated sustained inflationary pressures.
The Federal Reserve's accommodation allowed fiscal authorities to distribute stimulus without immediate tax increases while simultaneously inflating asset values for existing wealth holders, creating a dual benefit system heavily skewed toward capital owners.
Measuring Long-Term Purchasing Power Erosion Across Demographics
Price inflation has increased 23.6% to 27.1% since January 2021, depending on measurement methodology. However, methodological changes to Consumer Price Index calculations during the 1990s significantly understate actual purchasing power erosion. Using pre-1990s CPI formulas, cumulative inflation approaches 50% over the same period.
Average hourly earnings increased 24.9% during this timeframe, creating an apparent wash for median workers. However, this aggregate figure masks substantial demographic variations. In addition, the Brookings analysis of COVID-19 inflation highlights how supply shocks exacerbated the inflation tax COVID stimulus effects across different economic segments.
Real Income Impact by Economic Segment
- Professional/managerial workers: Generally maintained or improved purchasing power through wage growth and asset appreciation
- Service sector workers: Experienced significant purchasing power decline despite nominal wage increases
- Fixed-income retirees: Suffered substantial wealth erosion with minimal income adjustment mechanisms
- Asset owners: Benefited substantially from asset price inflation exceeding consumer price inflation
The inflation tax operates regressively because lower-income households spend higher percentages of income on necessities that experienced above-average price increases. Food, energy, housing, and transportation costs increased faster than overall CPI, disproportionately affecting households with limited discretionary spending capacity.
Geographic and Sectoral Inflation Variations
Regional price increases varied significantly based on local economic structures:
- Urban areas: Housing costs increased 20-40% in major metropolitan regions
- Rural areas: Transportation and food costs created disproportionate burden
- Energy-producing regions: Initially benefited from commodity price increases
- Service-dependent economies: Experienced delayed but sustained price pressures
Sectoral analysis reveals that goods with supply constraints showed larger price increases, while services with labour shortages demonstrated persistent wage and price escalation. Semiconductor supply disruptions affected durable goods pricing, while labour shortages in hospitality and healthcare sectors created sustained service price inflation.
Strategic Portfolio Protection Against Currency Debasement
Historical analysis demonstrates that precious metals provide inflation protection during periods of aggressive monetary expansion. Gold prices increased 25% during the initial monetary expansion phase, while silver showed similar performance patterns with higher volatility characteristics. Consequently, understanding gold price forecast insights becomes crucial for portfolio positioning.
Multi-Asset Inflation Hedge Performance Analysis
| Asset Class | 2020-2021 Performance | Inflation Protection Rating | Liquidity Level |
|---|---|---|---|
| Gold | +25% | High | High |
| Silver | +22% | High | Moderate |
| Real Estate | +25.7% | Very High | Low |
| TIPS (Treasury Inflation-Protected Securities) | +7.8% | Moderate | High |
| Commodities (broad index) | +45% | Very High | Moderate |
| Equities (S&P 500) | +68.6% | Variable | Very High |
Real estate provided substantial inflation protection but requires significant capital commitments and involves illiquidity risks. Treasury Inflation-Protected Securities offered some protection but underperformed relative to actual inflation rates due to CPI understating true price increases.
Personal Inflation Rate Calculation Framework
Households should calculate personalised inflation rates based on individual spending patterns:
- Document monthly expenditures by category (housing, food, transportation, healthcare, discretionary)
- Track price changes in specific categories over 12-month periods
- Weight category changes by spending percentages to determine personal inflation rate
- Compare personal rate to official CPI to identify protection gaps
- Adjust portfolio allocation based on inflation sensitivity analysis
Portfolio allocation strategies should consider inflation duration expectations. Short-term inflation spikes may favour commodity exposure, while sustained debasement periods historically favour precious metals and real estate allocations.
Alternative store of value options include:
- Physical precious metals: 10-20% portfolio allocation for wealth preservation
- Real estate investment trusts (REITs): Exposure to inflation-hedged rental income
- Foreign currency exposure: Diversification away from dollar-denominated assets
- Commodity-producing equities: Indirect exposure to resource price appreciation
For instance, analysing gold-silver ratio analysis can help optimise precious metals allocation between these two monetary metals during inflationary periods.
Historical Context for Future Monetary Policy Trajectory
International comparisons reveal similar patterns across developed economies. The European Central Bank expanded its balance sheet from €2.05 trillion (2008) to €8.92 trillion (June 2022), a 335% increase over 14 years. The Bank of Japan's balance sheet exceeded 130% of nominal GDP by 2022, compared to approximately 40% pre-2008.
These precedents suggest that central bank balance sheet expansions become structurally embedded rather than temporary emergency measures. Federal Reserve officials have indicated that balance sheet normalisation will stabilise at levels significantly above pre-2008 baselines, implying continued monetary accommodation relative to historical norms.
Federal Reserve Dual Mandate Tensions
The Federal Reserve faces increasing conflicts between employment and price stability objectives:
- Employment mandate: Political pressure to maintain accommodative policies during economic weakness
- Inflation mandate: Technical requirement to control price increases
- Financial stability concerns: Asset bubble risks from prolonged accommodation
- Fiscal coordination: Implicit pressure to support government borrowing capacity
Demographic trends intensify these pressures as aging populations require increased government spending on healthcare and social security. Congressional Budget Office projections indicate structural deficits exceeding $2 trillion annually by 2030, creating ongoing pressure for monetary accommodation to manage government borrowing costs.
Scenario Analysis for Continued Monetary Debasement
Base case scenario: Continued moderate inflation (3-4% annually) with periodic monetary accommodation during economic downturns, resulting in cumulative purchasing power erosion of 30-40% over the next decade.
Accelerated debasement scenario: Major fiscal crisis requiring sustained monetary financing, potentially creating inflation rates of 6-8% annually and 50-70% cumulative purchasing power loss.
Deflationary scenario: Economic contraction forcing aggressive monetary expansion to prevent deflation, creating asset price inflation while consumer prices remain subdued, concentrating wealth transfers toward asset owners.
The next major ASX story will hit our subscribers first
Preparing for Sustained Currency Debasement Dynamics
The structural factors driving monetary expansion remain firmly in place. Government debt-to-GDP ratios, demographic pressures, and political incentives for fiscal spending create ongoing requirements for central bank accommodation. Understanding these dynamics allows individuals to position portfolios for wealth preservation rather than reactive protection.
Individual Action Framework for Inflation Protection
- Calculate personal inflation exposure based on actual spending patterns
- Diversify away from dollar-denominated financial assets through real asset allocation
- Maintain liquidity buffers in inflation-protected instruments
- Monitor policy indicators for shifts in monetary accommodation levels
- Adjust allocations dynamically based on inflation duration expectations
The most effective hedge against the inflation tax COVID stimulus involves understanding its transmission mechanisms and positioning accordingly before policy effects fully manifest in consumer prices. Historical precedent suggests that early positioning in real assets provides superior protection compared to reactive adjustments after inflation becomes widely recognised.
Investment considerations should account for different inflation scenarios. Moderate, sustained inflation favours real estate and precious metals, while accelerated debasement may favour commodity exposure and foreign currency diversification. Deflationary scenarios paradoxically may benefit holders of real assets if monetary authorities respond with aggressive accommodation measures. Therefore, implementing comprehensive gold market strategies becomes essential for navigating these complex monetary dynamics.
Monitoring Key Economic Indicators
Monitoring key indicators helps identify policy trajectory shifts:
- Federal Reserve balance sheet size and composition changes
- Treasury auction demand and yield curve dynamics
- Money supply growth rates relative to economic output
- Asset price movements in inflation-sensitive sectors
- Congressional fiscal policy debates and budget projections
The inflation tax represents a permanent feature of modern monetary systems rather than a temporary emergency measure. Understanding its mechanics, timing, and distributional effects provides the foundation for effective wealth preservation strategies during periods of currency debasement.
Looking to Navigate Complex Economic Conditions in Australian Markets?
Discovery Alert's proprietary Discovery IQ model delivers real-time alerts on significant ASX mineral discoveries, empowering investors to identify actionable opportunities during periods of monetary expansion and economic uncertainty. Explore Discovery Alert's discoveries page to see how historic mineral discoveries have generated substantial returns for investors, then begin your 14-day free trial to gain a market-leading edge in today's challenging investment landscape.