June 21, 2026
The Hidden Paradox at the Heart of Global Aluminium Recycling
Few commodity trade relationships reveal the complexity of modern industrial supply chains quite like the flow of aluminium scrap into China. On the surface, China's position as the world's largest primary aluminium producer — one of the top aluminium producers globally — suggests self-sufficiency. Yet beneath that headline sits a structural reality that continues to reshape global recycling markets: China cannot generate enough domestic scrap to satisfy its own secondary aluminium manufacturing appetite, and the gap is widening.
Understanding why China aluminium scrap imports from overseas continue to grow, and which nations are capitalising on that demand, offers critical intelligence for commodity traders, recycling operators, sustainability analysts, and industrial policymakers alike.
When big ASX news breaks, our subscribers know first
China Aluminium Scrap Imports From Overseas: The Core Numbers
The headline figures from Q1 2026 confirm a market in sustained expansion. China sourced 526,380 tonnes of aluminium scrap from international markets in the first quarter of 2026, representing a year-on-year increase of 3.92% compared to the 506,546 tonnes recorded in Q1 2025. March 2026 alone generated approximately USD 506 million in import value, underscoring the commercial weight of this trade flow.
Zooming out to full-year comparisons, the structural growth story becomes even clearer:
| Metric | 2024 | 2025 | YoY Change |
|---|---|---|---|
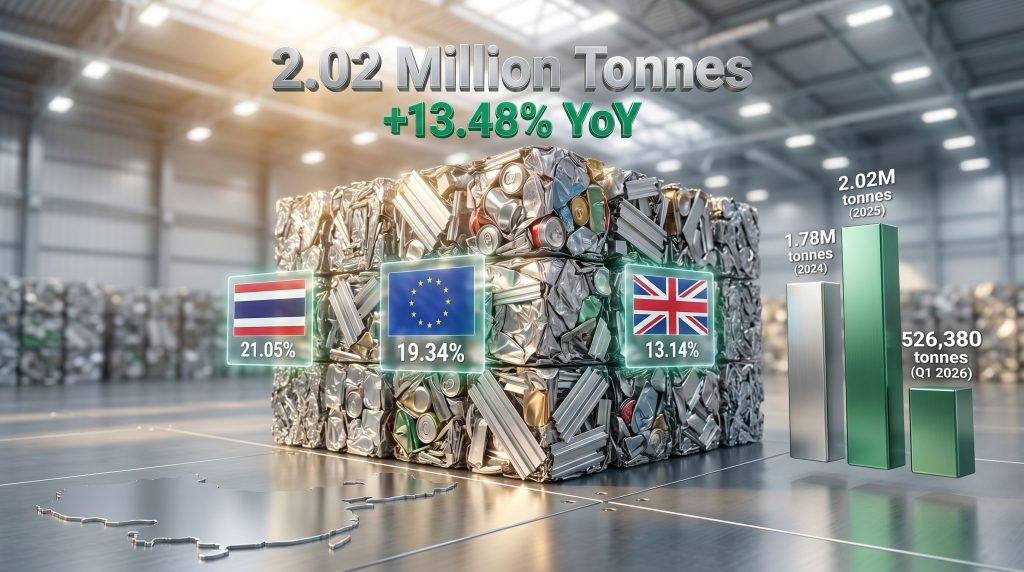
| Total Import Volume | 1.78 million tonnes | 2.02 million tonnes | +13.48% |
| Thailand Supply Volume | 298,243 tonnes | 470,698 tonnes | +57.82% |
| EU Supply Volume | 298,397 tonnes | 348,607 tonnes | +16.83% |
| UK Supply Volume | 193,638 tonnes | 245,313 tonnes | +26.69% |
The 2.02 million tonne import figure for 2025 represents the largest recorded annual volume of aluminium scrap imports China has drawn from overseas sources in recent history. Furthermore, this is not incremental growth; it reflects a deepening structural dependency on external secondary feedstock.
Quarterly Trend: Is Growth Moderating or Simply Recalibrating?
One nuance worth tracking is the deceleration in Q1 2026's growth rate compared to the full-year 2025 surge:
| Quarter | Import Volume | YoY Change |
|---|---|---|
| Q1 2025 | 506,546 tonnes | Significant expansion |
| Q1 2026 | 526,380 tonnes | +3.92% |
| Full-Year 2025 vs 2024 | 2.02M vs 1.78M tonnes | +13.48% |
The moderation in Q1 2026 likely reflects seasonal normalisation and supply-side variability from key exporters rather than a structural reversal. Full-year 2026 data will be the real test of whether the market has entered a consolidation phase or is simply recalibrating before the next leg of growth.
Who Supplies China? The Three Dominant Scrap Exporters
Three supplier nations collectively account for more than 53% of China's total overseas aluminium scrap intake. Their relative positions, growth trajectories, and market dynamics each tell a distinct story.
| Supplier | Share of China's Total Imports (2025) |
|---|---|
| Thailand | 21.05% |
| European Union | 19.34% |
| United Kingdom | 13.14% |
| All Other Sources | ~46.47% |
Thailand: The Dominant Supplier Facing Headwinds
Thailand's rise to the top position in China's aluminium scrap import hierarchy has been rapid and commercially dramatic. Between 2024 and 2025, Thai export volumes to China surged by 57.82%, from 298,243 tonnes (USD 622.85 million) to 470,698 tonnes (USD 1 billion). That single-year expansion is extraordinary by any measure in commodity trade.
Quarterly performance adds important texture:
- Q1 2024: 63,766 tonnes (USD 128.17 million)
- Q1 2025: 133,018 tonnes (USD 289 million) — more than doubling year-on-year
- Q1 2026: 110,810 tonnes (USD 276.8 million) — down 16.7% YoY
The Q1 2026 decline from Thailand is the most operationally significant data point in the current import landscape. Thailand functions as a regional aggregation and processing hub for Southeast Asian aluminium waste streams, benefiting from proximity to China's manufacturing belt and relatively competitive logistics costs. The pullback in Q1 2026 may reflect supply-side tightening within Thailand's domestic scrap collection network, shifting trade routing through alternative channels, or demand-side pricing adjustments by Chinese buyers.
Notably, China's aluminium scrap prices have surged on bullish sentiment, which may also be influencing supplier behaviour. Monitoring Thailand's quarterly trajectory through the remainder of 2026 is essential for any market participant with exposure to secondary aluminium feedstock pricing.
The European Union: Accelerating Into the Gap
While Thailand retreated in Q1 2026, the European Union moved in the opposite direction with striking momentum:
- Q1 2024: 74,764 tonnes (USD 149 million)
- Q1 2025: 78,037 tonnes (USD 170.87 million) — up 4.38% YoY
- Q1 2026: 101,814 tonnes (USD 254.6 million) — up 30.47% YoY
The EU's 30.47% quarterly growth rate in Q1 2026 is the strongest among all three top suppliers and demands analytical attention. For full-year context, EU scrap exports to China reached 348,607 tonnes (USD 772 million) in 2025, up 16.83% from the 298,397 tonnes (USD 625 million) exported in 2024.
The EU's Q1 2026 acceleration suggests European scrap exporters are actively redirecting volumes toward Chinese buyers at a time when domestic European demand for recycled aluminium feedstock may not be absorbing available supply at competitive price points.
Several structural factors are shaping this dynamic. European industrial restructuring in automotive, aerospace, and construction sectors is generating higher volumes of post-industrial aluminium scrap. At the same time, the EU's Carbon Border Adjustment Mechanism (CBAM) is creating layered cost considerations for intra-European aluminium trade flows. In addition, global commodity tariff impacts are reshaping how European exporters approach market selection. Scrap exporters operating outside the CBAM framework's direct scope may find it commercially advantageous to redirect volumes to non-CBAM markets, with China being the most significant buyer of scale globally.
This creates a genuine tension between European circular economy ambitions, which prioritise keeping recyclable materials within the EU's industrial base, and the commercial reality that Chinese buyers are offering competitive pricing for high-grade scrap.
The United Kingdom: Steady Compounding Growth
The UK presents the most consistent growth narrative among the top three suppliers, with year-on-year increases recorded across every measured period:
- Q1 2024: 47,674 tonnes (USD 95.57 million)
- Q1 2025: 60,796 tonnes (USD 133.95 million) — up 27.52% YoY
- Q1 2026: 69,157 tonnes (USD 169.83 million) — up 13.75% YoY
Full-year UK exports to China climbed from 193,638 tonnes (USD 409.2 million) in 2024 to 245,313 tonnes (USD 541.86 million) in 2025, a 26.69% annual increase. Post-Brexit trade policy shifts appear to be influencing the redirection of UK scrap flows away from European buyers and toward Asian markets, though the degree to which this reflects policy design versus commercial pricing arbitrage remains an open question. Whether UK domestic aluminium recycling and remelting capacity is being structurally crowded out by export-oriented demand is an emerging policy concern that has yet to be resolved.
Why China Can't Stop Importing: The Structural Drivers
Energy Economics and the 95% Rule
The fundamental energy arithmetic of aluminium recycling versus primary smelting underpins everything. Recycling aluminium requires approximately 95% less energy than producing primary aluminium from bauxite ore through the Bayer and Hall-Heroult processes. Understanding the role of bauxite production leaders helps contextualise why the energy cost differential is so commercially significant for Chinese manufacturers.
Given China's energy cost pressures, grid capacity constraints, and binding carbon reduction commitments, the economic logic of secondary aluminium production is compelling. China has committed to peak carbon emissions by 2030 and carbon neutrality by 2060, making secondary aluminium production a direct lever for achieving both targets while sustaining industrial output.
The Purity Threshold: Quality as a Market Barrier
Not all aluminium scrap qualifies for import into China. Imported material must meet approximately 99.1% purity levels, with shipments subject to customs inspection protocols. This threshold was introduced as part of China's post-2018 regulatory transition away from broad scrap import restrictions toward a quality-tiered system that distinguishes between contaminated solid waste (prohibited) and high-grade recyclable resources (permitted).
This purity requirement functions as both a quality assurance mechanism and an effective market access barrier. It partially explains why Thailand, the EU, and the UK dominate the supplier landscape: all three operate sophisticated industrial scrap sorting, processing, and certification infrastructure capable of consistently meeting Chinese customs standards.
The U.S. Exit and the Decade-Long Realignment
The current import geography looks nothing like it did a decade ago. In 2017, the United States was China's dominant aluminium scrap supplier, exporting approximately 820,000 metric tonnes (USD 1.17 billion) to China, representing roughly 50% of China's total imports that year. However, the escalation of trade tariffs from 2018 onwards effectively dismantled that relationship, triggering one of the most dramatic geographic realignments in global commodity trade in recent memory.
| Period | Top Supplier | Approx. Volume | Share of China Imports |
|---|---|---|---|
| 2017 | United States | ~820,000 tonnes | ~50% |
| 2024-2025 | Thailand | 298,243–470,698 tonnes | ~21% |
| 2024-2025 | European Union | 298,397–348,607 tonnes | ~19% |
| 2024-2025 | United Kingdom | 193,638–245,313 tonnes | ~13% |
The current three-supplier structure is more geographically diversified than the historical U.S.-dominant era. However, the concentration of over half of China's imports among just three suppliers still represents meaningful supply chain exposure.
Secondary Aluminium Market Dynamics: What Traders Need to Know
Alloy Grades and Feedstock Specifications
Within the aluminium scrap trade, not all material is commercially equivalent. Chinese secondary aluminium smelters primarily target specific wrought and cast alloy scrap streams. The most commercially valuable categories include:
- Zorba (shredded mixed aluminium): lower value, requires further sorting
- Taint/Tabor: painted aluminium from automotive and consumer goods sectors
- Twitch: aluminium recovered from auto shredder residue after ferrous separation
- Cast aluminium scrap: high-silicon content material suited for remelting into die-casting alloys
The distinction matters because China's secondary aluminium industry has bifurcated into two segments: wrought alloy producers serving packaging and transportation applications, and casting alloy producers supplying the automotive, electronics, and construction sectors.
India as an Emerging Competitor for Supply
China does not operate in a vacuum as a buyer of global aluminium scrap. India's secondary aluminium sector has been expanding rapidly, and Indian buyers are increasingly competing with Chinese importers for scrap volumes from the same European and Southeast Asian origins. Furthermore, urban mining trends are creating new domestic supply streams in multiple markets, potentially reshaping the global scrap export landscape over the medium term.
Three Scenarios for China's Aluminium Scrap Import Trajectory Through 2026 and Beyond
Scenario 1: Continued Structural Growth
China's carbon commitments accelerate the secondary aluminium transition, sustaining import demand above 2 million tonnes annually. EU and UK export volumes continue expanding as European industrial restructuring generates higher scrap availability.
Scenario 2: Geographic Diversification
China actively develops supplier relationships in South America, the Middle East, and Sub-Saharan Africa to reduce concentration risk. New entrants begin competing for market share, creating pricing competition that benefits Chinese buyers.
Scenario 3: Domestic Supply Gap Narrows
Accelerated investment in China's domestic scrap collection and sorting infrastructure reduces the import dependency over a five to ten year horizon. Stricter purity enforcement simultaneously constrains the pool of internationally compliant export volumes, moderating import growth from the supply side.
The most likely near-term path is a hybrid of Scenarios 1 and 2, with structural import growth continuing while China gradually diversifies its supplier base. China's industrial demand across multiple material categories reinforces why Beijing is unlikely to voluntarily constrain access to cost-effective secondary feedstock in the near term.
The next major ASX story will hit our subscribers first
Frequently Asked Questions: China Aluminium Scrap Imports From Overseas
How much aluminium scrap does China import annually?
China imported approximately 2.02 million tonnes of aluminium scrap from overseas sources in 2025, up from 1.78 million tonnes in 2024, representing a year-on-year increase of 13.48%.
Which country supplies the most aluminium scrap to China?
Thailand is currently China's largest single-country supplier, accounting for approximately 21.05% of China's total imports in 2025, with annual volumes reaching 470,698 tonnes valued at USD 1 billion.
Why does China import aluminium scrap despite being the world's largest producer?
China's domestic scrap generation cannot meet the scale of its secondary aluminium manufacturing demand. Recycling aluminium consumes approximately 95% less energy than primary smelting, making china aluminium scrap imports from overseas both an energy-saving and cost-effective feedstock choice aligned with China's carbon reduction targets.
What purity standards apply to aluminium scrap imports into China?
China requires imported aluminium scrap to meet approximately a 99.1% purity threshold, with customs inspection protocols ensuring compliance. According to import data on aluminium scrap flows, these standards effectively advantage suppliers with advanced industrial sorting capabilities while filtering out contaminated or mixed-grade materials.
Is the growth rate in China's aluminium scrap imports slowing?
Q1 2026 recorded a growth rate of +3.92% year-on-year, compared to the full-year 2025 growth of +13.48%. This moderation likely reflects seasonal factors and supply-side variability rather than a structural reversal, though full-year 2026 data will be required to draw definitive conclusions.
Disclaimer: This article contains forward-looking analysis, scenario projections, and market commentary based on publicly available trade data. It does not constitute financial or investment advice. All statistics referenced are sourced from reported international trade data and publicly available industry figures. Readers should conduct independent research before making commercial or investment decisions based on any information contained herein.
Want to Stay Ahead of the Next Major ASX Mineral Discovery?
Discovery Alert's proprietary Discovery IQ model delivers real-time alerts on significant ASX mineral discoveries, transforming complex commodity data into actionable insights for traders and investors at every experience level — explore historic discoveries and their returns to understand what early positioning can mean, then begin your 14-day free trial at Discovery Alert to secure your market-leading advantage.