July 11, 2026

When Refining Becomes a Weapon: How China's Processing Dominance Is Rewriting Copper Market Rules
The history of commodity markets is littered with assumptions that proved dangerously fragile over time. For much of the twentieth century, copper pricing operated on a relatively straightforward logic: mine supply disruptions in Chile or Peru transmitted into spot price moves at the London Metal Exchange, and traders positioned accordingly. That framework has not simply evolved — China copper refining capacity expansion has structurally displaced it. Understanding why requires looking not at a single policy announcement or quarterly output figure, but at the most consequential industrial buildout in modern commodity history.
When big ASX news breaks, our subscribers know first
China's Two-Decade Transformation: From Concentrate Buyer to Refining Superpower
Two decades ago, China was a large and growing consumer of refined copper but remained heavily dependent on imports of finished metal. That dependency has been systematically eliminated. China's share of global refined copper output has expanded from approximately 15% in 2005 to roughly 50% today, representing a pace of capacity growth with few precedents in the commodities sector. According to the U.S. Geological Survey Mineral Commodity Summaries 2024, China produced approximately 9.8 million metric tons of refined copper in 2023, accounting for close to half of global production.
By January through November 2025, that output had climbed to 13.3 million metric tons, a 9.8% year-over-year increase, with monthly run rates approaching 1.2 million tonnes. The trajectory suggests 2025 will mark a record annual output figure for Chinese refined copper production. Simultaneously, China accounts for approximately 55 to 60% of global refined copper demand, meaning the country has effectively engineered a position where it both refines and consumes the majority of the world's copper, with surplus production increasingly flowing outward as net exports.
This transition to net exporter status in 2025 is not a coincidence. It is the output of a deliberate, multi-decade industrial strategy executed through:
- Policy bank financing via China Development Bank and state-owned commercial lenders offering preferential loan terms for refining infrastructure classified under strategic industry categories
- Environmental consolidation mechanisms that raise compliance costs for smaller operators, accelerating market concentration among large, well-capitalised state-owned enterprises
- R&D subsidies and technology incentives for advanced processing, including atmospheric acid leaching and high-efficiency electro-refining
- Downstream integration incentives linking refining assets with copper rod, tube, and wiring harness manufacturing, creating vertically integrated supply chains insulated from external price shocks
The policy architecture surrounding China copper refining capacity expansion has entered a new phase. China's National Development and Reform Commission has signalled tighter oversight of new copper smelting projects, targeting what authorities describe as disorderly capacity growth. Approximately 2 million metric tons of previously planned smelting capacity has been suspended under the current policy review cycle. Furthermore, planned additions of 2.5 million tonnes between 2025 and 2028 remain the largest of any region globally, but growth is being redirected toward consolidation among major operators rather than greenfield expansion.
| Region | Planned Refining Capacity Additions (2025–2028) |
|---|---|
| China | 2.5 million tonnes |
| South America | 800,000 tonnes |
| North America | 600,000 tonnes |
The NDRC's shift from volume maximisation to industry concentration signals a maturing phase in China's refining strategy, one that prioritises pricing stability and margin retention over raw output growth.
How Price Discovery Has Shifted: The LME No Longer Operates Alone
The practical consequence of China's refining dominance is a fundamental rewiring of how copper prices are discovered and transmitted globally. Historically, the London Metal Exchange served as the singular anchor for copper price discovery, with physical flows dictated by Western mine supply availability and Chinese import demand. That mechanism required a persistent Chinese dependency on imported refined copper to function.
Once domestic refining output began consistently exceeding immediate consumption, that dependency weakened. Shanghai Futures Exchange inventory levels became a critical leading indicator: when SHFE stockpiles build, import urgency falls, and the price uplift historically generated by Western mine supply disruptions is dampened or absorbed entirely. In effect, the copper supply crunch dynamic now operates across two reference points simultaneously — the LME and the SHFE — with the latter increasingly setting directional momentum.
Copper has functionally evolved from a pure supply-demand commodity into a macro-sensitive industrial asset. Investors who continue to model copper pricing exclusively on mine supply fundamentals are operating with an incomplete analytical framework.
The variables that now drive copper prices reflect this structural change:
- Chinese industrial policy decisions and state-directed demand cycles
- SHFE inventory levels as a real-time proxy for domestic surplus or deficit
- USD/CNY exchange rate dynamics, which directly affect the yuan cost of imported concentrates
- US Federal Reserve interest rate cycles, which alter discount rates on long-duration mining assets
- Chinese property sector activity, a key downstream demand signal for copper wiring, plumbing, and building materials
The implication for portfolio construction is significant. A supply disruption at a major Chilean or Peruvian mine that would have previously generated a sharp spot price rally can now be partially offset by elevated SHFE inventories and reduced import demand from Chinese buyers. Understanding the copper price drivers operating across this multi-variable system is, consequently, more important than ever for informed allocation decisions.
The Geopolitics of Sulfuric Acid: A Hidden Cost Variable Reshaping the Global Cost Curve
Why Is Sulfuric Acid So Critical to Copper Production?
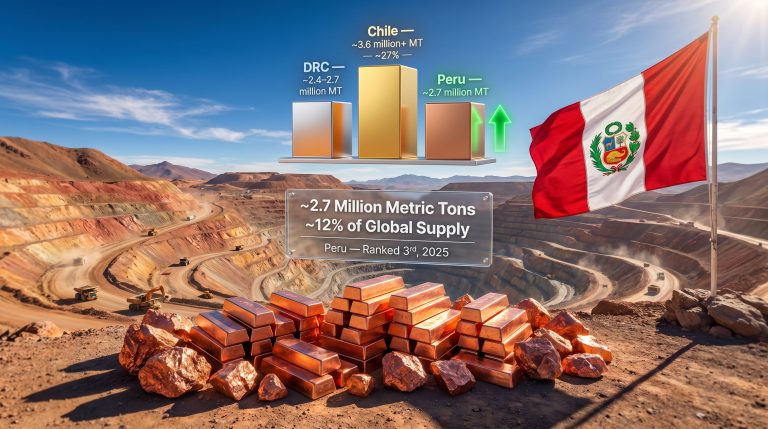
Among the less widely understood variables shaping copper production economics is the availability and pricing of sulfuric acid, a critical processing input for solvent extraction and electrowinning operations. SX-EW production accounts for approximately 17% of global refined copper supply, concentrated in Chile, Peru, and the Democratic Republic of the Congo, and the economics of this production segment are being materially altered by geopolitical disruption.
Shipping constraints through the Strait of Hormuz, combined with export restrictions imposed by China and Turkey during 2024 and 2025, compressed global sulfuric acid availability and raised landed costs for operators across both Chile and the DRC. The cost escalation is not a transient logistics issue; it reflects structural vulnerabilities in a supply chain that copper producers have historically taken for granted.
How Are Chile's Cost Pressures Compounding?
The Chile copper outlook extends beyond acid supply challenges. The country remains the world's largest copper producer at approximately 5.3 million tonnes in 2023 according to the U.S. Geological Survey, but legacy operations face a compounding challenge. Declining head grades across major deposits require moving and processing greater volumes of rock per tonne of recovered copper. Energy input costs have risen. Permitting timelines have extended.
The cumulative effect is a sustained increase in sustaining capital requirements across the Chilean industry, with large-scale capital deployment increasingly required simply to hold output flat rather than grow it. As Merlin Marr-Johnson, Chief Executive Officer of Fitzroy Minerals, has noted, production growth within Chile is increasingly difficult, with the industry deploying vast amounts of capital just to sustain existing output levels, a dynamic that structurally supports a material re-rating of metal prices over time.
This cost pressure is not distributed evenly across operator types. The following framework captures the margin exposure spectrum:
| Operator Profile | Cost Pressure Exposure | Margin Resilience |
|---|---|---|
| High-cost SX-EW (imported acid, legacy infrastructure) | High | Low |
| Low-cost oxide (secure acid supply, competitive energy) | Low to Moderate | High |
| Sulphide producers with declining grades | High | Moderate |
| New low-capex oxide developers with completed DFS | Low | High |
Short-Term Surplus, Long-Term Deficit: Navigating the Timing Paradox
Copper investors in 2025 and early 2026 face a market that is simultaneously oversupplied in the near term and structurally undersupplied over the medium to long term. Understanding the distinction between these two conditions is essential for positioning correctly across different time horizons.
Near-term conditions reflect:
- SHFE copper inventory builds through 2025 as domestic refining output exceeded immediate consumption
- Declining Chinese refined copper import volumes confirming domestic supply adequacy
- Softening physical delivery premiums from 2023 highs
- Range-bound price action driven by Chinese property sector weakness and moderated EV demand support
Long-term structural dynamics point in the opposite direction:
| Demand Driver | Trajectory to 2040 |
|---|---|
| Grid transmission infrastructure | High growth |
| Electric vehicle fleet deployment | High growth |
| Data centre electrification | Moderate to High growth |
| Renewable energy generation capacity | Moderate growth |
The International Energy Agency's Critical Minerals Outlook 2024 projects total copper demand growth of 40 to 50% by 2040 under its Announced Pledges scenario. Against this demand trajectory, mine supply faces structural constraints that are difficult to resolve quickly. Global reserve grades are declining. New discoveries are becoming smaller and geologically deeper. Permitting timelines in Tier-1 mining jurisdictions routinely exceed a decade from discovery to first production.
The simultaneous presence of short-term surplus and long-term deficit creates discrete entry windows during macro-driven price dislocations, particularly for allocators with multi-year investment horizons targeting assets with near-term production timelines.
Capital Allocation in a Bifurcated Market: What Institutional Investors Are Screening For
China copper refining capacity expansion has not only shifted pricing power; it has altered the framework through which institutional capital evaluates copper equities. The result is a bifurcated market with two clearly differentiated valuation regimes operating simultaneously. Exploring robust copper investment strategies has consequently become a priority for serious allocators seeking to navigate this landscape.
Tier 1 assets attracting institutional capital:
- Completed Definitive Feasibility Studies with defined all-in sustaining cost profiles
- Secured environmental and construction permits
- Near-term production timelines targeting first output before the projected late-2020s supply deficit tightens
- Low capital expenditure intensity per annual tonne of copper produced
- Jurisdictions scoring favourably on the Fraser Institute Policy Perception Index for permitting transparency and regulatory stability
Tier 2 assets funded primarily by specialist and retail capital:
- Pre-economic explorers without defined resource economics or metallurgical confirmation
- Long-dated, capital-intensive developments with high sensitivity to discount rate assumptions
- Assets in jurisdictions carrying material permitting uncertainty or infrastructure access risk
Three criteria dominate institutional screening at the asset level:
- Cost curve positioning: assets in the lower half of the global AISC distribution carry structural margin protection through commodity price cycles
- Capital expenditure intensity: lower capex per annual tonne of copper output improves return on invested capital metrics
- Jurisdictional quality: permitting transparency, infrastructure access, and political stability now factor directly into the discount rates institutional allocators apply to project valuations
Hayden Locke, President and Chief Executive Officer of Marimaca Copper, described the economics of the company's Marimaca Oxide Deposit in Chile's Antofagasta Region as confirming industry-leading capital costs, highly competitive operating costs, and industry-leading returns on invested capital. The project's oxide-first, heap leach and SX-EW approach targets a 2026 construction start with a sulphide expansion preserved as an internally funded growth option. Furthermore, the Chile supply gap presents an increasingly compelling context for such well-positioned projects.
Beyond headline project economics, balance sheet strength and non-dilutive financing capacity have emerged as primary differentiators in institutional due diligence, particularly for junior and mid-tier copper developers competing for a constrained pool of project finance capital.
The next major ASX story will hit our subscribers first
Discovery Leverage and the Case for Advanced Copper Exploration
Advanced exploration assets occupy a distinct position in the copper investment spectrum, offering leveraged exposure to resource growth in a market environment where new discoveries are becoming structurally scarcer. The investor base for exploration-stage companies skews toward specialist funds and sophisticated retail allocators prepared to accept pre-economic risk in exchange for outsized upside.
Copper-gold polymetallic systems, particularly volcanogenic massive sulphide deposits, are attracting increasing acquisition interest from producers. The strategic rationale is straightforward: multi-commodity revenue streams provide a natural hedge against single-metal price volatility, and VMS systems frequently exhibit high-grade copper and gold mineralisation within the same orebody.
Jon Deluce, Chief Executive Officer of Abitibi Metals Corp, has quantified the capital efficiency of the B26 polymetallic deposit in Quebec, noting tonnage growth exceeding 125% achieved at a discovery cost of approximately 2.5 cents per pound of copper equivalent. The system remains open along strike and at depth, preserving further resource expansion potential beyond the current resource outline.
Discovery cost per pound of copper equivalent has become a key institutional screening metric for exploration-stage investments:
- Programs delivering discovery costs below 3 cents per pound of copper equivalent are increasingly viewed as meeting the threshold for acquisition consideration by mid-tier and major producers
- Resource tonnage growth rate per dollar of exploration expenditure provides a capital efficiency benchmark that specialist funds now apply systematically
- Geologic openness carries a valuation premium reflecting future resource upside optionality
The Self-Funding Exploration Model: A Third Category Emerges
A structurally distinct third investment category has emerged within the copper equity universe: early-stage developer-explorers pursuing low-capital-intensity oxide production as a mechanism for funding exploration of larger underlying sulphide systems. This model represents a deliberate response to the tightening of equity financing conditions for pre-economic copper explorers.
The operational logic is straightforward. Near-term oxide production, typically through heap leach and SX-EW processing requiring relatively modest upfront capital, generates operating cash flow that can be directed toward drill programmes targeting the broader sulphide endowment. The approach reduces continuous dilution of existing shareholders and preserves upside optionality without dependence on external capital markets during periods of constrained financing.
Chile's Antofagasta Region represents the benchmark jurisdictional setting for this model, combining established permitting frameworks, integrated logistics infrastructure, an experienced local mining workforce, and proximity to existing processing and power infrastructure. However, the structural constraint facing mature Chilean exploration ground means that companies pursuing this model must carry defined near-term production pathways rather than relying on exploration upside alone to attract capital.
Key Statistics Reference: China's Copper Refining Landscape
| Metric | Data Point |
|---|---|
| China's share of global refined copper output | ~50% |
| China's refined copper production (Jan–Nov 2025) | 13.3 million metric tons |
| Year-over-year production growth (Jan–Nov 2025) | +9.8% |
| China's planned refining capacity additions (2025–2028) | 2.5 million tonnes |
| Suspended Chinese smelting capacity (current policy cycle) | ~2 million tonnes |
| SX-EW share of global refined copper supply | ~17% |
| Chile annual copper production (2023) | ~5.3 million tonnes (USGS) |
| IEA projected copper demand growth by 2040 | 40–50% (Announced Pledges scenario) |
| B26 resource tonnage growth (Abitibi Metals) | +125% |
| B26 discovery cost | ~2.5 cents per pound Cu equivalent |
Frequently Asked Questions: Understanding China's Copper Refining Expansion
Why Does China's Expanded Refining Capacity Affect Copper Prices in Western Markets?
China processes more than half of globally traded copper concentrates and accounts for the majority of global refined copper demand. When domestic refining output consistently exceeds immediate consumption, SHFE inventory builds reduce Chinese import urgency. The result is a dampened price response to Western mine supply disruptions, because elevated domestic inventories partially substitute for imported metal. Global copper prices now respond more strongly to Chinese policy signals and inventory cycles than to traditional Western supply disruption events.
Is China Still Adding Copper Refining Capacity, or Has the Buildout Peaked?
Planned additions of 2.5 million tonnes between 2025 and 2028 confirm that China retains the largest pipeline of new refining capacity globally. However, the NDRC has suspended approximately 2 million tonnes of previously announced projects and introduced stricter oversight of new smelting proposals. The 2026–2030 planning cycle prioritises consolidation among large operators over raw volume growth, indicating a transition from expansion-led to efficiency-led industrial strategy.
How Does Sulfuric Acid Supply Affect Copper Production Costs?
Sulfuric acid is the primary reagent in SX-EW processing, which accounts for roughly 17% of global refined copper supply. Supply constraints driven by Strait of Hormuz shipping disruptions and export restrictions from major producing nations raised landed acid costs for SX-EW operators in Chile and the DRC during 2024 and 2025. This cost escalation disproportionately affects higher-cost operators dependent on imported acid, pushing the marginal cost of SX-EW production higher and providing structural price support across the copper market.
What Type of Copper Project Is Best Positioned to Attract Institutional Capital Today?
Institutional allocators are concentrating capital on projects with completed DFS documentation, secured environmental permits, defined AISC profiles, and production timelines targeting first output before the late-2020s supply deficit tightens. Low capital intensity per annual tonne, strong balance sheets, and non-dilutive financing capacity are additional primary screening criteria. Long-dated, capital-intensive developments face wider discount rates in the current interest rate environment.
What Is the Long-Term Copper Demand Outlook Despite Current Near-Term Surplus?
The IEA projects 40 to 50% copper demand growth by 2040 under its Announced Pledges scenario, driven by grid transmission investment, electric vehicle fleet expansion, and data centre electrification. Current surplus conditions reflect a cyclical inventory build in China rather than a structural demand reversal. Mine supply growth faces persistent constraints from declining reserve grades, smaller new discoveries, and decade-long permitting timelines. Long-term allocators are using near-term price weakness as a potential entry point into a structurally supply-constrained market, making informed awareness of copper price drivers an essential component of any sound investment thesis.
This article is intended for informational purposes only and does not constitute financial advice. Readers should conduct their own due diligence and consult a licensed financial adviser before making investment decisions. Forward-looking statements, projections, and demand forecasts referenced herein are subject to material uncertainty and may differ from actual outcomes. Production figures and market share data are sourced from U.S. Geological Survey Mineral Commodity Summaries and International Copper Study Group publications; readers are encouraged to verify current data directly through those sources.
Want to Stay Ahead of the Next Major Copper Discovery on the ASX?
Discovery Alert's proprietary Discovery IQ model delivers real-time alerts on significant ASX mineral discoveries, instantly translating complex data across more than 30 commodities into clear, actionable insights — so investors can act before the broader market catches on. Explore how historic discoveries have generated substantial returns on Discovery Alert's dedicated discoveries page, and begin a 14-day free trial to position ahead of the next major copper find.