
August 12, 2026
The Structural Force Behind Sovereign Gold Demand That Most Investors Overlook
When institutional reserve managers quietly accumulate an asset across 21 consecutive months, ignoring both price rallies and severe drawdowns, they are not responding to economic noise. They are executing a mandate defined years earlier, calibrated against long-horizon portfolio targets that bear no resemblance to the quarterly thinking that governs most investment decisions. Understanding this distinction is the foundation for understanding why the china gold buying reserve gap has become one of the most consequential structural forces in the global gold market today.
Most market commentary treats China's monthly gold purchase figures as reactive events, linking each addition to a specific geopolitical catalyst or macroeconomic signal. That framing misses the deeper architecture. The real driver is a measurable, persistent allocation deficit that no single month of buying can meaningfully close, and that will continue generating demand regardless of where spot prices trade on any given session.
When big ASX news breaks, our subscribers know first
Two Distinct Gaps That Define China's Gold Accumulation Story
The china gold buying reserve gap actually describes two separate but related phenomena, and conflating them produces an incomplete picture of both scale and intent.
Gap Type 1: The Strategic Allocation Deficit
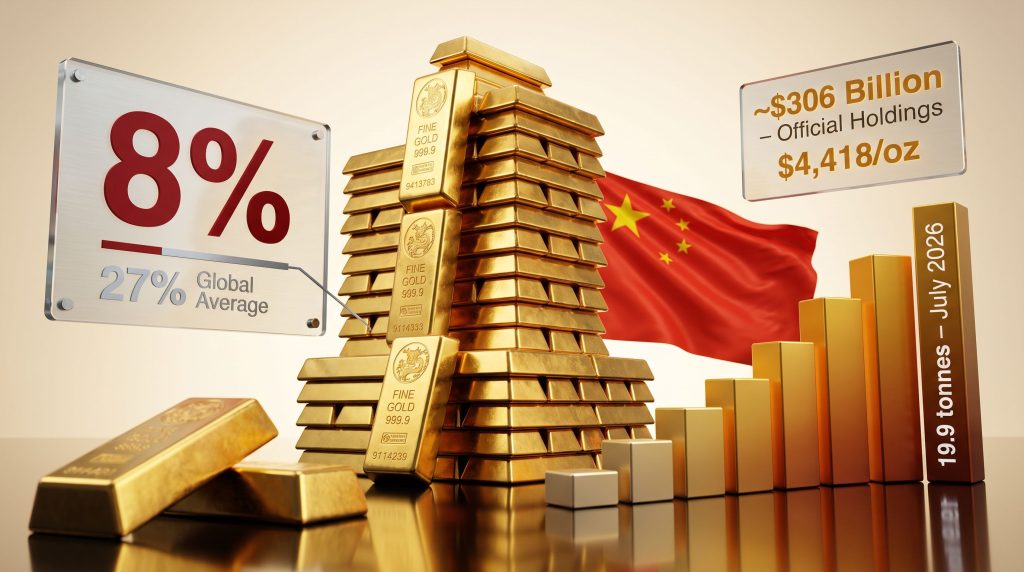
China's officially disclosed gold holdings represent approximately 8% of its total foreign-exchange reserve assets, according to data published by the State Administration of Foreign Exchange (SAFE). The global central bank average, as documented in the World Gold Council's 2026 Central Bank Gold Reserves Survey covering 76 institutions, sits near 27%. That arithmetic creates a 19-percentage-point structural underweight that cannot be interpreted as tactical positioning. It is a multi-decade rebalancing problem, and the pace of monthly purchases is its partial, incremental solution.
Gap Type 2: The Transparency Deficit
The second gap is less visible but potentially more significant. Independent research methodologies, which cross-reference domestic mine output, Shanghai Gold Exchange (SGE) withdrawal volumes, import trade statistics, and retail banking demand against official PBOC disclosures, consistently identify large unexplained residuals in China's national gold balance. Estimated gaps of approximately 1,382 tonnes in 2022 and 1,351 tonnes in 2023 suggest a cumulative two-year residual approaching 2,700 tonnes that does not appear in any official PBOC disclosure. These figures carry methodological uncertainty, but the scale of the implied discrepancy is too large to attribute to data noise alone.
Both gaps matter independently. Together, they suggest that official monthly purchase figures are the visible fraction of a much larger, multi-channel accumulation programme operating across formal and informal reserve channels simultaneously.
Furthermore, China's gold market dominance in both production and consumption adds another layer to understanding why these gaps persist and why they are so difficult to quantify from publicly available data alone.
What the Official PBOC Data Actually Reveals
The People's Bank of China lifted its officially reported gold holdings to 76.08 million troy ounces at the end of July 2026, according to SAFE data released on August 7, 2026. The monthly addition of approximately 19.9 tonnes represented the largest single-month increase since October 2023. Critically, this was not an isolated spike. The monthly pace has escalated progressively through the year.
| Period | Official Monthly Addition (Tonnes) | Cumulative 2026 Total |
|---|---|---|
| March 2026 | ~5.0 | Early accumulation phase |
| April 2026 | ~8.1 | Pace building |
| May 2026 | ~9.95 | Acceleration continues |
| June 2026 | ~14.93 | Pre-July acceleration |
| July 2026 | ~19.9 | ~60 tonnes YTD |
Source: People's Bank of China / State Administration of Foreign Exchange, August 7, 2026; World Gold Council, August 2026
The pattern is not one of steady, constant buying. It is one of deliberate escalation, with each month's reported addition exceeding the prior. At current gold prices near $4,418 per troy ounce, China's official gold reserve holdings carry a market value of approximately $306 billion. According to China's gold reserves data, this trajectory places the PBOC among the most active sovereign accumulators globally in the current cycle.
Why Price Declines Did Not Interrupt the Streak
One of the most analytically revealing features of the current accumulation cycle is that it survived gold's worst quarterly drawdown in 13 years. During late June 2026, gold fell below $4,000 for the first time since November 2025, touching an intraday low near $3,960. Tactical investors reduced exposure. Futures positioning shifted. The PBOC added 14.93 tonnes that month, its second-largest purchase on record for the streak at that point.
This price-insensitive behaviour is the clearest possible signal that the buying is programmatic rather than opportunistic. A reserve manager executing a structural mandate does not require a favourable entry price. The allocation target determines the purchase volume; the monthly spot price merely determines the cost.
The Hidden Layer: What Independent Analysts Estimate China Is Really Buying
The official data, however impressive in isolation, may significantly understate China's true gold absorption. Research using OTC market flow analysis estimated that China purchased more than 48 tonnes via the London OTC market in May 2026 alone, compared to the approximately 10 tonnes officially reported for that month. If accurate, that represents a nearly five-fold discrepancy for a single calendar month. Full-year 2026 actual acquisitions through all channels could be closer to 80 tonnes than the roughly 60 tonnes visible in SAFE disclosures.
How Sovereign Gold Acquisition Can Remain Off the Official Balance Sheet
Understanding why these gaps exist requires familiarity with the mechanics of sovereign gold accumulation structures. Official reserve disclosures reflect holdings formally assigned to the central bank. However, the acquisition pipeline can route through several intermediary structures before formal reclassification:
- Purchases executed through state-owned commercial banks that hold gold on behalf of the sovereign before intra-system transfer to official reserves
- London OTC market transactions settled bilaterally without immediate visibility in SAFE disclosures
- Strategic timing of reclassification, where acquired metal is transferred to official reserves on a schedule determined by policy rather than by the date of commercial purchase
- Domestic gold accumulation by sovereign-linked entities that may be consolidated into central bank holdings at a future date
This opacity is not a uniquely Chinese practice. Multiple central bank reserve managers globally use comparable accumulation architectures. What makes China's case distinctive is the estimated scale of the implied off-balance-sheet stockpile.
| Estimate Type | Official Figure | Independent Analyst Range | Implied Discrepancy |
|---|---|---|---|
| Total Sovereign Gold Holdings (May 2026) | ~2,332 tonnes | ~5,000-5,500 tonnes | ~2,668-3,168 tonnes |
| May 2026 Monthly Purchase | ~10 tonnes | ~48+ tonnes | ~38+ tonnes |
| 2026 YTD Acquisition | ~60 tonnes | ~80+ tonnes | ~20+ tonnes |
Sources: World Gold Council; Reuters 2025-2026; People's Bank of China / SAFE; independent OTC market flow analysis
Three Structural Drivers Sustaining the Accumulation Mandate
Driver 1: Reserve Currency Diversification at a System Level
The World Gold Council's 2026 Central Bank Gold Reserves Survey found that 74% of surveyed central banks anticipate a declining share of US dollar assets in global reserve portfolios over the next five years. This is not a marginal sentiment reading. It represents a supermajority of institutional reserve managers globally signalling a systemic rebalancing away from the world's dominant reserve currency.
Gold is the primary asset that can absorb this reallocation at scale. It carries no counterparty risk, no sovereign credit exposure, and cannot be frozen, sanctioned, or defaulted upon by a foreign government. The 2022 freezing of Russian central bank foreign currency reserves by Western institutions sharpened this calculation considerably for reserve managers across multiple jurisdictions, accelerating a structural reassessment of what it means to hold truly sovereign reserves. In this context, central banks influencing gold prices have become a defining theme in how the market is repriced at a structural level.
Driver 2: Closing a 19-Point Allocation Gap Is a Decade-Long Exercise
At the current official pace of approximately 19.9 tonnes per month, and with China's total reserve base continuing to grow, the arithmetic of closing a 19-percentage-point allocation gap is sobering. Even at accelerating monthly volumes, reaching the ~27% global average gold allocation would require sustained buying across many years, not quarters. This is not a trade. It is a generational portfolio rebalancing programme.
The survey data reinforces this trajectory. 89% of central banks surveyed by the World Gold Council in 2026 expect global official gold reserves to increase over the next 12 months. A record 45% plan to add to their own holdings. China is the most prominent participant in a broader sovereign demand shift, but it is far from the only one. Indeed, central bank buying trends suggest that this coordinated global reweighting may persist well into the next decade.
Driver 3: Physical Gold as an Expression of Reserve Sovereignty
There is a growing differentiation among reserve managers between assets held domestically in physical form and assets held as foreign-currency claims on external institutions. Physical gold stored within a nation's own vaulting infrastructure represents a qualitatively different form of reserve asset: one that is not subject to correspondent banking relationships, clearinghouse dependencies, or foreign regulatory jurisdiction. For a sovereign reserve manager weighing long-horizon risk scenarios, this distinction has become increasingly material.
How China's Reserves Compare to Global Peers
| Country / Bloc | Approximate Gold as % of Total Reserves | Notes |
|---|---|---|
| United States | ~70%+ | Largest official holder globally |
| Eurozone Average | ~50%+ | ECB and member central banks combined |
| Global Central Bank Average | ~27% | World Gold Council 2026 benchmark |
| China (PBOC, official data) | ~8% | Based on SAFE disclosures, July 2026 |
Note: Figures are approximate. China's percentage reflects official holdings only and does not incorporate analyst estimates of undisclosed sovereign stockpiles.
Even if analyst estimates placing China's true sovereign gold stockpile between 5,000 and 5,500 tonnes are accurate, the implied allocation as a percentage of total reserves would still fall materially below the global average. The gap does not disappear if hidden holdings are eventually formalised. It narrows, but the structural accumulation mandate remains. Moreover, central bank gold demand from other emerging market sovereigns is compounding the same structural dynamic simultaneously.
The next major ASX story will hit our subscribers first
The Macro Layer: CPI, Fed Policy, and Gold's Short-Term Price Signals
On August 12, 2026, the US Bureau of Labor Statistics reported that July CPI came in at 3.4% year-over-year, a slight decline from June's 3.5% reading. Core CPI held at 2.5% year-over-year. The softer inflation print reduced market-implied probability of a Federal Reserve rate hike in September to below 50%, triggering a near-term gold price lift. The metal briefly touched $4,438 intraday before settling near $4,418.
This illustrates the real-yield mechanism that drives tactical gold positioning: lower rate-hike expectations reduce the opportunity cost of holding a non-yielding asset, providing near-term price support. The mechanism is real and worth monitoring. It operates, however, on a fundamentally different time horizon than China's reserve rebalancing mandate.
The distinction matters: CPI data moves gold prices over hours and days. The china gold buying reserve gap moves gold demand over years and decades. Treating them as the same signal leads to misallocation of analytical attention.
Compounding the structural and cyclical picture, global gold ETF holdings reached 4,068 tonnes in July 2026, according to World Gold Council data, reversing two consecutive months of outflows and recording a fifth consecutive session of inflows through August 12. When sovereign accumulation, ETF demand recovery, and a softening rate environment align simultaneously, the resulting demand configuration is statistically uncommon and historically significant.
What Individual Investors Can Learn from Sovereign Reserve Logic
The decision framework that governs PBOC gold accumulation translates directly into a behavioural model for individual long-term investors, even if the institutional context differs.
A reserve manager that continues purchasing through sub-$4,000 price levels and then resumes at $4,418 is demonstrating one core principle: the allocation target, not the current price, determines the buy decision. The monthly purchase volume may adjust at the margin, but the directional mandate does not change based on short-term spot movements.
For individual investors monitoring this theme, several data points deserve consistent attention:
- SAFE monthly disclosure releases: Published in the first week of each month, covering prior-month official PBOC gold holdings, these figures provide the most direct official window into China's accumulation trajectory
- OTC market flow analysis: Cross-referencing London OTC settlement data with official disclosures can surface periods of accelerated off-balance-sheet acquisition, as the May 2026 discrepancy illustrated
- SGE withdrawal volumes: Shanghai Gold Exchange physical withdrawal figures represent a comprehensive measure of domestic gold demand and can be reconciled against official data to identify unexplained residuals
- Global ETF flows: Institutional and retail ETF demand tends to directionally confirm or contradict central bank accumulation trends, providing a complementary demand-side signal
- USD reserve share intentions: The 74% of surveyed central banks anticipating declining dollar allocations is a leading indicator of sustained gold reweighting demand that operates independently of any single macro data release
It is worth noting, too, the distinction between physical gold ownership and paper gold exposure through ETFs or futures contracts. In a world where the geopolitical rationale for sovereign gold demand is rooted in asset sovereignty and the elimination of counterparty risk, that distinction carries increasing weight for individual portfolios as well. Furthermore, understanding central bank gold reserves at a global level provides important context for gauging just how far China's rebalancing programme has yet to run.
Frequently Asked Questions: China Gold Buying Reserve Gap
What exactly is the china gold buying reserve gap?
The term describes two measurable deficits. First, the gap between China's officially reported gold allocation of approximately 8% of total foreign-exchange reserves and the global central bank average of approximately 27%, a 19-percentage-point shortfall that drives sustained programmatic accumulation. Second, the discrepancy between PBOC official monthly purchase disclosures and independent analyst estimates of China's true gold acquisition volumes, which research suggests may be substantially larger than reported figures indicate.
How large is China's official gold reserve as of July 2026?
Official PBOC holdings stood at 76.08 million troy ounces at the end of July 2026, equivalent to approximately 2,368 tonnes, with a market value near $306 billion at prevailing prices. The 21-consecutive-month buying streak that produced this figure began in November 2024 and represents the longest documented accumulation run since China began publishing consistent monthly disclosures in 2015.
Why do independent researchers believe China's actual gold holdings are much larger?
Cross-referencing domestic production, import trade data, Shanghai Gold Exchange withdrawal figures, and commercial bank demand against official reserve disclosures reveals large unexplained residuals each year. Estimated gaps of roughly 1,382 tonnes in 2022 and 1,351 tonnes in 2023 point to a multi-thousand-tonne implied accumulation that has not been formally incorporated into PBOC official data. According to Forbes analysis of China's gold strategy, total sovereign gold stockpiles, including unofficially held or unreclassified metal, may range from 5,000 to 5,500 tonnes by some analyst estimates.
Will China's gold buying continue beyond 2026?
The structural logic for continued accumulation remains intact as long as China's official gold allocation stays materially below the global central bank average. Closing a 19-percentage-point gap at current monthly volumes is a multi-year, potentially multi-decade, exercise. The accelerating pace of purchases through 2026 and the programmatic nature of the mandate provide no credible basis for anticipating a near-term cessation. As Kitco's coverage of China's reserve purchases has documented, the streak shows no signs of structural reversal.
Key Data Summary: The China Gold Reserve Gap at a Glance
| Metric | Official Figure | Context |
|---|---|---|
| Gold as % of FX Reserves | ~8% | vs. ~27% global central bank average |
| Official Holdings (July 2026) | 76.08m troy oz / ~2,368 tonnes | Valued at ~$306bn at ~$4,418/oz |
| July 2026 Monthly Addition | 19.9 tonnes | Largest since October 2023 |
| 2026 YTD Official Additions | ~60 tonnes | Accelerating monthly pace |
| Buying Streak Duration | 21 consecutive months | Longest run since 2015 |
| Analyst Estimated True Holdings | ~5,000-5,500 tonnes | Implies ~2,600-3,100+ tonne unreported gap |
| Central Banks Expecting Reserve Increases | 89% (76 surveyed) | World Gold Council 2026 Survey |
| Planning to Add Gold Holdings | Record 45% | World Gold Council 2026 Survey |
| USD Reserve Share: Declining Expectation | 74% of surveyed banks | Five-year forward view |
Sources: People's Bank of China / SAFE (August 7, 2026); World Gold Council Central Bank Gold Reserves Survey 2026; Bureau of Labor Statistics (August 12, 2026); World Gold Council ETF Data (August 2026)
This article is intended for informational and educational purposes only and does not constitute financial, investment, or purchasing advice of any kind. All forecasts, analyst estimates, and independent research cited involve assumptions and methodological limitations. Past performance of any asset is not indicative of future results. Readers should consult a qualified financial adviser before making any investment decisions. Independent analyst estimates of China's true gold holdings are speculative in nature and cannot be independently verified from publicly available data.
Want to Know Which ASX Miners Are Positioned to Benefit From Surging Sovereign Gold Demand?
Discovery Alert's proprietary Discovery IQ model delivers real-time alerts the moment significant ASX mineral discoveries are announced, translating complex market data into actionable investment insights — explore historic discoveries and their returns to understand the scale of opportunity, then begin your 14-day free trial and position yourself ahead of the broader market.