
June 13, 2026
The Geopolitical Supply Shock Rewriting Metal Trade Flows
Markets rarely reprice a commodity chain in a straight line. They lurch from complacency to scarcity, then from scarcity to substitution. That pattern helps explain why the 2026 Middle East conflict has done more than lift benchmark prices. It has started to reroute trade itself, shifting volumes, margins, and bargaining power across aluminium, copper, batteries, and power equipment.
The phrase China metals demand gets lift as Iran war spurs export boom captures the headline dynamic, but the deeper story is more structural. A regional supply interruption has collided with China's vast manufacturing capacity, weak domestic absorption, and the global scramble for electrification hardware. The result is not simply higher shipments. It is a reshaping of where metal-intensive products are made, which markets absorb them, and how pricing spreads signal stress across the system.
Because this topic involves war, commodity volatility, and forward-looking market assumptions, any demand or price outlook should be treated as scenario analysis rather than certainty. Export growth, arbitrage margins, and metal price premiums can reverse quickly if logistics normalise, oil prices retreat, or tariffs and supply chains tighten further.
What Triggered the Supply Shock?
The immediate catalyst was the effective closure of the Strait of Hormuz after the conflict escalated in late February 2026. That chokepoint matters well beyond oil. It also underpins logistics and industrial flows tied to Gulf metals production, especially aluminium.
Strikes on Persian Gulf smelting operations materially disrupted a region responsible for about 9% of global aluminium supply, according to analysts covering the boom. That is a meaningful loss in a market where spare capacity is not always easily exportable in the right form or location. London aluminium prices subsequently reached a four-year high during the dislocation.
What made this episode especially important was the inventory response. Both LME and Comex aluminium stocks were described as drawing down at the same time. When exchange inventories shrink in parallel, traders often read that as a sign of genuine physical tightening rather than a purely speculative move.
Why Did This Shock Spread Beyond Aluminium?
Aluminium was the clearest casualty, but copper and clean-tech-linked materials were also pulled into the same loop because higher energy prices changed end-market economics.
Key market markers included:
- Brent crude above $104 per barrel
- WTI above $101 per barrel
- Copper at $5.6358 per pound on 6 May 2026
- Aluminium futures at $3,314.25 per tonne on the same date
Higher oil and gas prices can shorten the economic payback period for solar, energy storage, and electric mobility. That matters for metals because clean-energy hardware is metal-heavy, particularly in copper-rich wiring, cabling, inverters, connectors, and battery systems. Consequently, the oil price rally became an unexpected amplifier for metal demand across multiple sectors.
The main takeaway is that the conflict did not just remove supply. It also improved the economics of the products that consume large amounts of industrial metals.
When big ASX news breaks, our subscribers know first
Why China Is Capturing the Upside
China entered this disruption with three advantages that are hard to replicate quickly: scale, cost competitiveness, and supply-chain integration. Those attributes matter most when overseas buyers need rapid fulfilment rather than long-term optionality.
Analysts argued that Chinese manufacturers remain the fastest responders when global clean-tech demand jumps suddenly. That reflects decades of industrial buildout across smelting, rolling, extrusion, cable manufacturing, battery assembly, EV production, and downstream components.
At the same time, China's domestic economy has not provided enough demand to absorb all of that capacity. The prolonged property downturn has weighed on local metals consumption, especially in construction-linked categories. Research noted that Chinese copper demand growth is expected to slow to 2.8% in 2026, down from 3.8% in 2025, based on Beijing Antaike Information Co. data. Furthermore, the China steel and iron ore market has faced similar domestic absorption challenges, reinforcing this broader trend.
Domestic Softness Creates Export Urgency
This domestic weakness is a crucial part of the export story. Producers facing softer home demand are far more willing to pursue overseas orders aggressively, especially when foreign premiums spike. Several indicators point to internal oversupply pressure inside China:
- Shanghai aluminium inventories reached their highest level since April 2020
- Domestic EV sales were described as struggling
- Fabricators and mills had stronger reasons to convert local metal into exportable finished goods
In practice, that means Chinese producers were not only able to serve the gap created by disrupted Gulf supply. They were motivated to do so.
The Export Surge by the Numbers
The 2026 trade data reveals that this is broader than one commodity. A basket of metal-intensive and electrification-related exports accelerated at the same time.
| Product category | Reported growth in 2026 | Main driver |
|---|---|---|
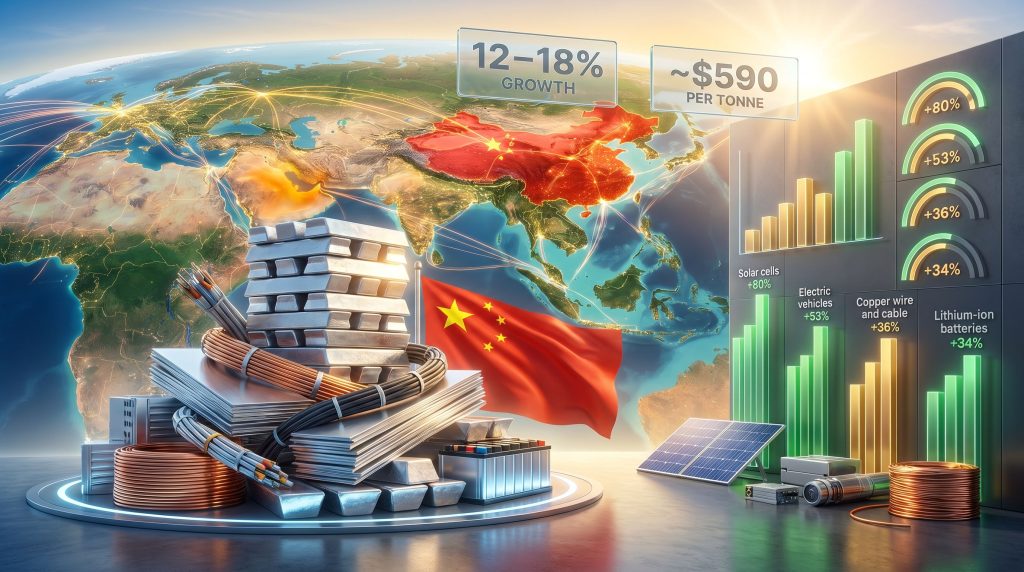
| Aluminium products | 12% to 18% full-year forecast growth | Gulf supply disruption and export arbitrage |
| Aluminium strand | Roughly 100% YoY in April and May combined to 40,000 to 50,000 tonnes | Power grid demand, favourable tax treatment, external shortages |
| Copper wire and cable | +36% YoY in March | Grid, EV, and clean-tech infrastructure |
| Solar cells | +80% YoY in March | Higher fossil fuel costs improving solar economics |
| Lithium-ion batteries | +34% YoY in March | Energy storage demand |
| Electric vehicles | +53% YoY in March | Export market resilience and high oil prices |
| Aluminium sheet export profit | +43% month on month in late March to about $590 per tonne | Widening overseas premium |
These figures matter for two reasons. First, they show the export uplift is happening across multiple adjoining supply chains rather than in a single niche. Second, they suggest the pricing signal is strong enough to pull more semi-fabricated and finished metal products into export channels.
What the Data Implies for Investors and Buyers
A few conclusions stand out:
- China is exporting value-added metal products, not merely raw material
- Products linked to grid buildout, storage, and electrified transport are showing the fastest momentum
- Margin expansion is reinforcing volume expansion, which often extends a trade move beyond the initial shock
- The strongest categories are those that can legally and economically move fastest through existing fabrication networks
The Aluminium Arbitrage Mechanism Behind the Boom
One of the least understood parts of this story is why China cannot simply flood the world with primary aluminium. The reason is policy. Beijing maintains export tariffs and related restrictions that discourage large-scale exports of primary metal.
That policy has a major market consequence. When overseas aluminium prices rise sharply relative to domestic Chinese prices, the easiest response is not to ship out raw ingot. It is to convert domestic aluminium into semi-fabricated or finished products that can move under different trade rules.
Why the London–Shanghai Spread Matters
The premium of London prices over Shanghai widened to its broadest level since 2022. At the same time, buyers in Japan and Europe reportedly faced record physical premiums.
Industry participants described overseas premiums as exceptionally elevated. That tells you the shortage was not just on screen. It was being felt in delivered physical metal and fabricated goods.
Which Products Are Benefiting Most?
The arbitrage is strongest in categories where Chinese fabricators can move quickly and buyers cannot easily wait:
- Aluminium strand for power grids
- Hot-rolled aluminium products for EVs and battery cells
- Cooling plates used in energy storage systems and data centres
- Automotive aluminium components needed by overseas manufacturers facing supply stress
Some hot-rolling mills were reported to have full order books through June 2026, a sign that the bottleneck had shifted from demand creation to production scheduling.
Why Copper Is Riding the Same Wave
Copper has not suffered the exact same supply shock dynamics as aluminium, but it sits inside nearly every major category now gaining momentum. That makes it a second-order beneficiary of the same geopolitical event. In addition, the broader copper market trends already pointed to structural tightness before the conflict escalated.
Copper demand rises through several channels at once:
- Electric vehicles use copper in motors, wiring harnesses, inverters, and charging systems
- Solar installations require copper in cabling and electrical balance-of-system components
- Battery storage systems need copper for connectivity and thermal management architecture
- Power grid expansion remains copper-intensive, even where aluminium substitutes in some transmission applications
Export data supports this link. Chinese copper wire and cable exports rose 36% year on year in March 2026, while solar cells, batteries, and EVs also posted large gains. That combination suggests copper demand is being transmitted through downstream manufacturing rather than only through domestic construction or industrial fixed investment.
Copper Outlook: Domestic Headwinds, Export Tailwinds
| Demand factor | Domestic China trend | Export-linked trend |
|---|---|---|
| Property-related demand | Weak | Not applicable |
| EV sales | Soft domestically | +53% export growth in March |
| Copper demand growth | Slowing to 2.8% in 2026 | Supported by clean-tech exports |
| Battery shipments | Moderate at home | +34% growth in March abroad |
This split helps explain why copper can remain firm even if Chinese domestic data looks mixed. The relevant demand is increasingly embedded in exported equipment, not only in local construction starts.
How Higher Oil Prices Are Accelerating Clean-Tech Metal Demand
The energy-price feedback loop is central to understanding 2026 metals trade. When crude oil rises above $100 per barrel, diesel-heavy businesses and import-dependent energy systems reassess capital spending. Solar-plus-storage begins to look less like a sustainability purchase and more like a cost-control tool.
Research pointed to Southeast Asia and Africa as particularly important growth destinations. In power-constrained markets, companies are adopting solar and battery systems to reduce diesel dependence and improve energy reliability. Moreover, China's clean-tech export surge has been directly accelerated by these elevated fossil fuel costs driving demand. Similarly, the global lithium market has seen increased activity as energy storage adoption accelerates across these emerging regions.
This matters for China because it manufactures much of the value chain needed to serve that shift:
- Solar cells and modules
- Lithium-ion batteries
- Power cables and connectors
- EVs and associated components
- Aluminium and copper fabricated inputs
The result is a reinforcing loop where high fossil fuel prices strengthen demand for metal-intensive exports, and those exports in turn bolster demand for aluminium and copper within Chinese fabrication networks.
The next major ASX story will hit our subscribers first
Risks That Could Slow the Export Boom
No commodity boom is risk-free, and this one carries both policy and geopolitical uncertainty.
Key Downside Scenarios
- Conflict de-escalation: If Gulf smelting capacity returns faster than expected, global premiums could compress and narrow the arbitrage window
- Trade restrictions: Importing countries may respond to a surge in Chinese shipments with tariffs, quotas, or anti-dumping actions
- Tax and rebate changes: The late-2024 withdrawal of export tax rebates across a wide range of metal products could reduce margins in some categories, even if demand stays strong
- Oil price reversal: If crude retreats sharply, the payback advantage of solar, batteries, and EV adoption may weaken in some markets
- Capacity overshoot: Chinese producers may scale up for peak conditions that do not last, raising the risk of oversupply later
Investors should be careful not to assume that wartime arbitrage spreads are permanent. Spreads often normalise faster than capacity plans do.
Strategic Implications for Global Supply Chains
The bigger consequence of China metals demand gets lift as Iran war spurs export boom is not just higher 2026 trade volume. It is the possibility that buyers become even more dependent on Chinese fabrication for the midstream and downstream products that matter most in electrification.
That dependence is especially visible in emerging markets where financing, lead times, and delivery certainty matter more than broad supplier diversification. Belt-and-Road partner nations in Southeast Asia, Africa, and Central Asia appear to be absorbing a growing share of these shipments, particularly in power and energy-related applications.
For industrial buyers, traders, and investors, the most useful indicators to watch next are:
- LME versus Shanghai price spreads
- Physical premiums in Japan and Europe
- Chinese export volumes for strand, sheet, wire, cable, batteries, and EVs
- Shanghai inventory trends
- Oil and gas prices as leading indicators for clean-tech equipment demand
If these signals remain elevated together, the current shift may prove more than a temporary war trade. It could mark another step in the longer relocation of metal fabrication power toward China's export machine.
Frequently Asked Questions
Why Are Chinese Aluminium Exports Rising So Quickly in 2026?
Disruptions to Persian Gulf smelting reduced available global supply, while Chinese manufacturers had spare domestic inventory, strong fabrication capacity, and expanding overseas margins. That combination favoured exports of semi-fabricated and finished aluminium products.
How Much Could Chinese Aluminium Product Exports Grow in 2026?
Industry forecasts point to 12% to 18% growth for Chinese aluminium product exports in 2026.
Why Is Primary Aluminium Not the Main Export Outlet?
China maintains export restrictions and tariff structures that make large-scale primary aluminium exports less straightforward. Fabricated products are often the more practical route.
Is Copper Also Benefiting from the Same Trend?
Yes. Copper demand is being supported by higher exports of wire, cable, batteries, solar products, and EVs, even as some domestic Chinese demand indicators soften.
What Is the Biggest Investment Risk in This Theme?
The main risk is normalisation. If Gulf output recovers, oil prices fall, or trade measures rise, current margins and export growth rates could cool quickly.
Final Perspective
What began as a regional war shock has become a lesson in how tightly modern commodity systems are linked. Remove supply in one geography, push energy prices higher, and the effects can appear somewhere else entirely — in this case in Chinese export volumes for metal-intensive manufactured goods.
For now, the trade map favours China. Whether that persists will depend less on one headline and more on the interaction between policy, logistics, energy prices, and industrial discipline. Ultimately, the story of how China metals demand gets lift as Iran war spurs export boom is as much about structural positioning as it is about geopolitical fortune.
Want to Capitalise on the Next Major Mineral Discovery Before the Market Moves?
Discovery Alert's proprietary Discovery IQ model delivers real-time alerts on significant ASX mineral discoveries, instantly converting complex geological and commodity data into actionable investment insights — ideal for investors tracking the structural shifts reshaping global metal demand. Start your 14-day free trial today and explore Discovery Alert's discoveries page to see how historic mineral discoveries have generated extraordinary returns for well-positioned investors.