June 23, 2026
The Infrastructure Gap That's Been Holding Clean Energy Markets Back
Commodity markets have long understood that price discovery is not merely a convenience — it is the connective tissue that allows capital to flow efficiently, risk to be priced accurately, and procurement decisions to be made with confidence. Crude oil has Brent and WTI. Natural gas has TTF and Henry Hub. Yet two of the fastest-scaling energy technologies in human history — solar photovoltaic modules and lithium battery cells — have operated for years without equivalent institutional-grade benchmarks. That gap is now closing.
The launch of two new monthly price assessments by Fastmarkets, covering N-type TOPCon solar modules (FOB China, USD/W) and LFP prismatic battery cells, 314Ah (EXW China, Yuan/Wh), represents a structural shift in how China PV module and BESS battery cell prices are tracked, reported, and applied across global markets. The first official publication date for both assessments is June 26, 2026.
Understanding why these benchmarks matter requires examining not just the current state of the market, but the forces that made independent price discovery both necessary and overdue.
When big ASX news breaks, our subscribers know first
China's Solar and Storage Markets: Understanding the Scale Problem
Cumulative Capacity Numbers That Reframe the Conversation
The statistics that underpin demand for standardized pricing are not incremental — they are generational in scale. According to China's National Energy Administration (NEA), the country's cumulative installed photovoltaic capacity reached 1.2 TW (1,200 GW) by the end of 2025, reflecting a 35% year-on-year increase. To contextualise that figure: the entire global solar installed base took decades to reach 1 TW, and China alone now exceeds that threshold.
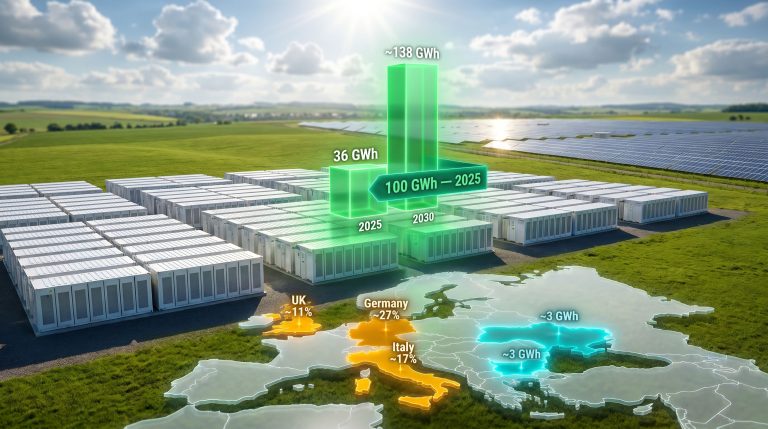
New-type energy storage tells an even more striking story. Cumulative installed capacity reached 136 GW / 351 GWh by the end of 2025, representing an 84% year-on-year surge — meaning China's grid-scale storage base nearly doubled within a single calendar year. The battery storage expansion driving these figures has created an urgent need for credible, independent pricing infrastructure.
Markets growing at this velocity create procurement environments where a 10% price movement within a single quarter can materially alter project economics. Without a credible benchmark, buyers and sellers are negotiating in an informational vacuum.
Why Rapid Growth Creates Pricing Dysfunction
Scale and speed together create a specific set of market dysfunctions that independent benchmarks are designed to solve:
- Accelerating deployment compresses procurement timelines, increasing exposure to short-term price swings that project models cannot easily absorb
- Manufacturing capacity scaling faster than standardisation frameworks means that nominally similar products can carry meaningfully different performance and cost profiles
- The convergence of solar and storage into integrated PV-plus-storage project models creates cross-sector pricing dependencies that previously did not exist in procurement contracts
- The coexistence of multiple cell formats (280Ah, 314Ah, and emerging larger formats) creates specification fragmentation, making like-for-like price comparison difficult without a fixed reference specification
N-Type TOPCon Solar Modules: Anatomy of the New Benchmark
How TOPCon Displaced Earlier Solar Technologies
N-type TOPCon (Tunnel Oxide Passivated Contact) technology has completed a decisive displacement of the previous generation PERC (Passivated Emitter and Rear Cell) architecture as the dominant specification for utility-scale solar globally. The efficiency advantages of TOPCon — typically delivering 1.5 to 2 percentage points higher conversion efficiency than equivalent PERC products — combined with declining manufacturing cost premiums, accelerated this transition faster than most industry forecasts anticipated.
Large-format cell configurations using 182mm (M10) and 210mm (G12) wafer sizes are now the de facto standard for new utility-scale installations, with module power outputs in the 580–700W range per panel. This standardisation of physical formats is a prerequisite for meaningful price benchmarking.
Technical Specifications: N-Type TOPCon Solar Module Assessment
| Specification | Detail |
|---|---|
| Cell Format | 182mm × 182mm and 210mm × 210mm |
| Power Output | 580–700W (typical) |
| Glass | Single/double 2.0mm tempered glass |
| Frame | Anodized aluminum alloy |
| Junction Box | IP68 rated |
| Standards Compliance | GB/T 9535-208; IEC standards |
| Minimum Quantity | 5+ MW per transaction |
| Incoterm | FOB China |
| Loading Period | Within 60 days |
| Currency | USD per Watt |
| Assessment Frequency | Monthly, last Friday of each month |
| Publication Window | 5–6pm Shanghai time |
Export Diversification and the FOB China Reference Point
Chinese module exports have diversified substantially beyond their traditional European concentration. Current destination markets span Europe, Southeast Asia, the Middle East, and Africa — regions with varying procurement practices, currency exposures, and contractual norms. An internationally recognised FOB China reference price serves several simultaneous functions:
- It provides a defensible pricing basis for project finance lenders underwriting long-term solar projects
- It reduces counterparty risk in cross-border procurement contracts by giving both parties a transparent external reference
- It supports structured offtake agreement negotiations by anchoring price adjustment mechanisms to an independent index
- It creates the conditions for derivative instruments and hedging products to eventually develop around solar module pricing
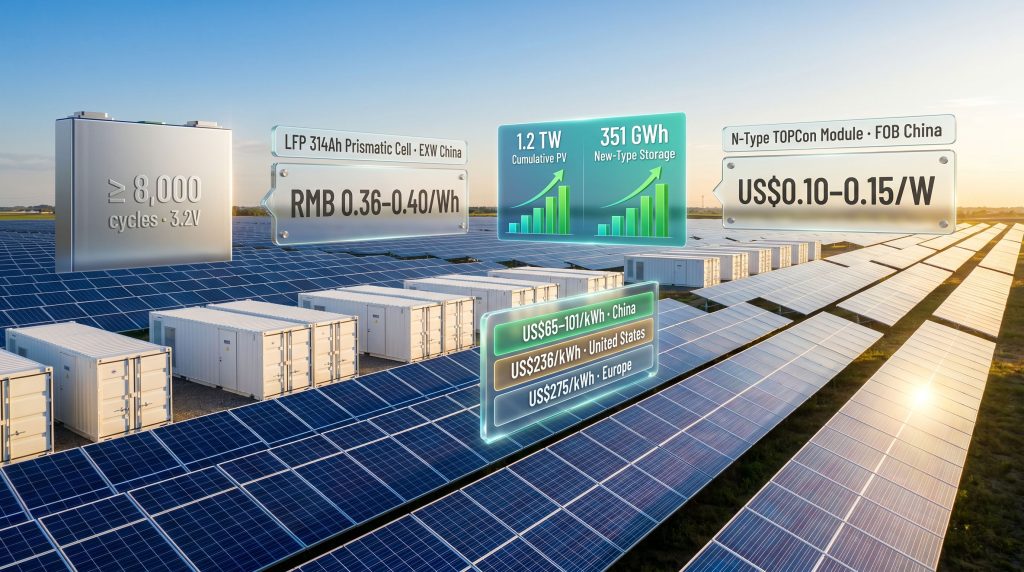
Mainstream Chinese PV module prices tracked broadly in the US$0.10–0.15/W range during 2024–2025 on an FOB China basis, with significant variation depending on module specification, manufacturer tier, and market destination. Furthermore, according to recent analysis on battery storage costs, the broader clean energy cost curve continues to decline structurally across both solar and storage technologies.
LFP Prismatic Battery Cells: Decoding the 314Ah Standard
Why 314Ah Became the Dominant BESS Cell Format
The convergence of the global energy storage industry around the 314Ah lithium iron phosphate (LFP) prismatic cell format was not an accident — it reflects a deliberate manufacturing and systems integration logic. The 314Ah form factor optimises energy density within standard containerised BESS enclosures, maximises the usable capacity of battery management systems designed around predictable cell geometries, and achieves sufficient scale to drive meaningful manufacturing cost reductions.
LFP chemistry itself offers a specific set of attributes that explain its dominance in stationary storage over competing lithium chemistries such as NMC (nickel manganese cobalt):
- Thermal stability: LFP cells are significantly more resistant to thermal runaway, a critical safety attribute for large-scale grid-connected installations
- Cycle life: The 314Ah specification carries a rated cycle life of ≥ 8,000 cycles, supporting 20+ year asset lives at typical daily cycling rates
- Cost per kWh: LFP avoids the price volatility associated with nickel and cobalt, raw materials that have historically contributed to NMC cost instability
- Cobalt-free chemistry: LFP's freedom from cobalt removes exposure to supply chains concentrated in the Democratic Republic of Congo
Technical Specifications: LFP Prismatic Cell (314Ah) Assessment
| Specification | Detail |
|---|---|
| Chemistry | Lithium Iron Phosphate (LFP) |
| Format | Prismatic |
| Capacity | 314Ah |
| Nominal Voltage | 3.2V |
| Cycle Life | ≥ 8,000 cycles |
| Charge/Discharge Rate | 0.25P – 1P |
| Minimum Quantity | No minimum |
| Incoterm | EXW (Ex-Works, domestic China) |
| Loading Period | Within 60 days |
| Currency | Yuan (RMB) per Wh |
| Assessment Frequency | Monthly, last Friday of each month |
| Publication Window | 5–6pm Shanghai time |
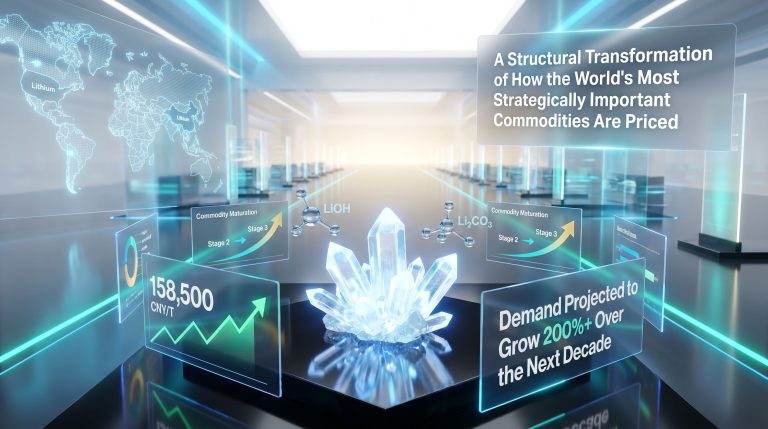
2026 LFP Cell Price Levels and the Lithium Carbonate Connection
LFP cell pricing is directly and tightly correlated with lithium carbonate supply dynamics, which constitute a significant proportion of raw material input costs. After reaching a cyclical trough of approximately RMB 0.26/Wh in 2025 — following an extended period of lithium carbonate oversupply — prices have rebounded sharply.
By mid-2026, mainstream 314Ah LFP cell prices are tracking in the range of RMB 0.36–0.40/Wh (approximately US$0.052–0.058/Wh). Lithium carbonate has been trading at RMB 155,000–180,000/tonne, directly feeding through to manufacturing cost structures.
A less widely appreciated dynamic is the two-tier structure that has emerged within the 314Ah cell market itself:
- Top-tier manufacturers with higher quality control standards and stronger brand recognition are quoting toward the RMB 0.40/Wh ceiling
- Second-tier producers competing primarily on price are clustered near RMB 0.35/Wh, creating a persistent quality premium spread within a nominally standardised specification
This tiering dynamic is precisely the kind of nuance that an independent benchmark — anchored to defined quality specifications — helps the market navigate transparently.
The Full BESS Cost Stack: From Cell to Installed System
Where Cell Prices Sit in the Broader Cost Architecture
Understanding China PV module and BESS battery cell prices in isolation understates their significance. Cell pricing is the upstream input that cascades through the entire value chain. The table below maps current 2026 pricing across each layer of the BESS cost stack:
| BESS Cost Layer | Price Range (2026) | Notes |
|---|---|---|
| LFP Cell (314Ah, EXW China) | RMB 0.36–0.40/Wh (~US$0.052–0.058/Wh) | Rebounded ~50% from 2025 lows |
| Full ESS System (1–4 hour, China tender) | US$50–52/kWh | Record low achieved in 25 GWh CEEC tender (June 2025) |
| Battery Pack (China domestic) | US$65–101/kWh | Lowest globally due to vertical integration and scale |
| Utility-Scale BESS (Installed, ex-China) | US$100–150/kWh | Includes PCS, BOS, and installation |
| Containerized C&I BESS | US$180–320/kWh | Factory-integrated enclosures reduce costs |
| Residential BESS (Installed) | US$400–700+/kWh | Typical 10–20 kWh home system |
China's battery pack costs of US$65–101/kWh compare against approximately US$236/kWh in the United States and US$275/kWh in Europe — a structural cost gap that reflects decades of deliberate vertical supply chain integration and manufacturing scale investment.
What Drove the 2026 BESS Price Rebound
The cyclical price recovery visible across the BESS value chain in 2026 reflects several converging forces. Monitoring the battery raw materials market helps contextualise these shifts within the broader commodity cycle:
- Raw material recovery: Lithium carbonate prices climbed from their 2024–2025 trough as South American brine operations faced weather-related disruptions and Chinese lepidolite producers scaled back at uneconomic prices
- System price inflection: Full ESS system prices crossed RMB 0.61/Wh (approximately US$0.088/Wh) in February 2026, roughly 11% above December 2025 levels
- Specification fragmentation premium: The coexistence of 280Ah, 314Ah, and emerging larger cell formats has created procurement complexity, with buyers paying premiums for the certainty of established 314Ah specifications
- Demand outpacing incremental capacity: China's 84% year-on-year storage capacity addition rate has created periodic pockets of supply tightness for high-specification cells, even within a broadly oversupplied manufacturing environment
Notably, mind-blowing price declines recorded in China's largest energy storage auctions during 2025 set historic lows, making the 2026 rebound all the more significant for market participants tracking the cycle.
PV-Plus-Storage Integration: Why Synchronized Benchmarks Matter
The Convergence of Two Procurement Cycles
The practical significance of launching synchronised benchmarks for both solar modules and battery cells extends beyond the convenience of having two data points from a single provider. Integrated PV-plus-storage projects — now a dominant deployment model for utility-scale renewable energy globally — require project developers to procure both technologies under unified financing timelines.
When module prices and cell prices move independently and are tracked through different channels with different methodologies, procurement teams face a structural information asymmetry. A developer hedging module price exposure through one reference index while managing cell price risk through an incompatible benchmark is exposed to basis risk — the gap between two imperfectly correlated hedging instruments.
Synchronised monthly assessments with consistent data collection windows and publication timing allow:
- Cross-sector price exposure to be analysed on a unified basis
- Project finance models to incorporate both cost components with comparable levels of benchmark credibility
- Contract price adjustment mechanisms to reference independently verified indices for both technology inputs
The next major ASX story will hit our subscribers first
Long-Term Price Trajectory: Structural Decline vs. Cyclical Noise
Two Competing Forces Shaping the Forecast
The 2026 price rebound in LFP cells invites a question that procurement teams and investors are actively wrestling with: does this mark the end of the structural cost reduction trend, or is it a temporary cyclical interruption?
The weight of evidence supports the latter interpretation. Despite short-term lithium carbonate-driven cost pressure, the long-term structural cost reduction trajectory for both technologies remains intact. In addition, advances in direct lithium extraction technology could further ease upstream supply constraints over the medium term:
- DC-unit BESS prices are forecast to decline toward US$80/kWh by 2030 and US$70/kWh by 2035, excluding inverter and transformer components
- Cell manufacturing technology continues to advance, with next-generation formats targeting higher energy density per unit volume
- Solar module manufacturing costs continue to benefit from scale and efficiency gains, despite module average selling prices already approaching cost-of-production levels for some manufacturers
Key Variables That Will Determine Price Direction
| Variable | Bullish for Prices | Bearish for Prices |
|---|---|---|
| Lithium carbonate supply | Extended South American weather disruptions | Recovery of brine operations; new lepidolite capacity |
| Cell manufacturing capacity | Consolidation reduces oversupply | Continued capacity additions outpace demand |
| Export tariff dynamics | Tariff escalation restricts Chinese export competitiveness | Tariff resolution expands addressable markets |
| Grid storage mandates | Policy-driven demand acceleration outpaces supply | Mandate delays or deferrals |
| Technology transitions | 314Ah-to-larger-format transitions create temporary supply tightness | Rapid format standardisation at larger formats |
Disclaimer: Price forecasts referenced in this article represent analyst projections and should not be interpreted as guaranteed outcomes. Actual prices will be determined by market conditions, supply chain dynamics, and policy developments that cannot be predicted with certainty.
How the Fastmarkets Assessments Are Structured
Assessment Methodology at a Glance
Both assessments share a common publication structure designed to align with large-scale procurement cycles:
- Published monthly on the last Friday of each month, with the first official publication on June 26, 2026
- Publication window: 5–6pm Shanghai time, with the data collection window running from the previous assessment through to 5pm Shanghai time on the day of publication
- Methodology documents are publicly available through the Fastmarkets methodology page, consistent with the transparency standards applied across all Fastmarkets price assessments
What Makes a Credible Price Benchmark
Not all price references carry equal weight in contract negotiations or project finance underwriting. The attributes that distinguish an institutionally credible benchmark from an informal market reference include:
- Independence: Assessment conducted by a third-party price reporting agency insulated from the commercial interests of buyers or sellers in the assessed market
- Transparency: Publicly available methodology documents with defined data collection windows, quality specifications, quantity thresholds, and incoterm parameters
- Standardisation: Fixed specifications — cell format, power output range, incoterm, currency — enabling genuine like-for-like comparison across assessment periods
- Governance alignment: Price reporting agencies serving commodity and financial markets are typically aligned with IOSCO Principles for Financial Benchmarks, providing an internationally recognised governance framework
The IOSCO Principles for Financial Benchmarks, established following the LIBOR manipulation scandal of the early 2010s, set the international standard for benchmark governance. PRA-published commodity benchmarks aligned to these principles carry a level of institutional credibility that informal market surveys cannot replicate.
FAQ: China PV Module and BESS Battery Cell Prices
What Is the Current Price of 314Ah LFP Battery Cells in China?
As of mid-2026, 314Ah LFP prismatic cell prices in China are tracking between RMB 0.36–0.40/Wh (approximately US$0.052–0.058/Wh) on an ex-works domestic basis, recovering from a 2025 trough of around RMB 0.26/Wh — a rebound of approximately 50%.
What Is the Current Price of N-Type TOPCon Solar Modules from China?
Mainstream Chinese PV module prices tracked in the US$0.10–0.15/W range during 2024–2025 on an FOB China basis. The new Fastmarkets monthly benchmark assessment for utility-scale N-type TOPCon modules, launched June 2026, will provide ongoing transparent price discovery going forward.
Why Have BESS Prices Increased in 2026 After Years of Decline?
The primary driver is a recovery in lithium carbonate prices, which rebounded to RMB 155,000–180,000/tonne after an extended period of oversupply. This raw material cost increase flowed through to cell and system pricing, temporarily interrupting the long-term downward trend. Consequently, the battery raw materials update for 2025 provides useful context for understanding how these upstream dynamics developed.
What Is the Cheapest BESS System Price Achieved in China?
China's largest energy storage tender — a 25 GWh procurement by CEEC in June 2025 — saw two-hour system bids reach approximately US$51.59/kWh, with four-hour system bids falling below US$50/kWh, representing the lowest utility-scale BESS system prices recorded globally at that time.
How Do Chinese Battery Pack Costs Compare Internationally?
China's battery pack costs of US$65–101/kWh are substantially lower than equivalent costs in the United States (approximately US$236/kWh) and Europe (approximately US$275/kWh), reflecting the structural advantages of vertical supply chain integration.
What Does FOB China Mean for Solar Module Pricing?
FOB (Free On Board) China means the seller's responsibility for goods ends when they are loaded onto the vessel at the designated Chinese port. This is the standard incoterm for Chinese module export contracts and provides a clean, logistics-cost-neutral reference point for international buyers comparing sourcing options.
Benchmarks as Energy Transition Infrastructure
Why Price Discovery Is the Missing Layer
China's solar and energy storage markets are now operating at a scale — 1.2 TW of cumulative PV capacity and 136 GW / 351 GWh of new-type storage — that places institutional demands on every part of the market ecosystem, including how China PV module and BESS battery cell prices are discovered, reported, and applied.
The establishment of independent monthly benchmarks for N-type TOPCon modules and 314Ah LFP cells addresses a transparency gap that has persisted throughout the most rapid scaling period in the history of energy technology deployment. Short-term price volatility, driven by lithium carbonate recovery and supply tightness, reinforces rather than undermines the case for standardised, independent price discovery. Cyclical uncertainty is precisely the environment in which credible benchmarks deliver the most value.
As PV-plus-storage becomes the default deployment model for utility-scale renewable energy globally, synchronised pricing benchmarks for both technologies will become as fundamental to project finance infrastructure as interest rate benchmarks are to debt markets. The question for procurement teams and investors is not whether these benchmarks will matter, but how quickly their markets will be structured around them.
Further information on Fastmarkets' price assessment methodology and governance documentation is available through the Fastmarkets methodology page.
Want to Know Which ASX Miners Are Positioned to Benefit From the Clean Energy Boom?
As lithium, solar, and battery storage markets reach unprecedented scale, the next major mineral discovery could deliver extraordinary returns — Discovery Alert's proprietary Discovery IQ model scans ASX announcements in real time, instantly identifying significant mineral discoveries across lithium and other clean energy commodities before the broader market reacts. Explore historic examples of what major mineral discoveries have returned and begin your 14-day free trial at Discovery Alert to position yourself at the forefront of the next significant find.