June 12, 2026
Why Most Silver Market Commentary Gets COMEX Inventory Wrong
Few areas of financial media generate as much confusion and misinformation as precious metals inventory analysis. When a market combines complex operational mechanics, emotionally charged narratives about monetary systems, and increasingly AI-generated content masquerading as research, the result is a landscape where retail investors routinely make decisions based on figures that bear little resemblance to verified data. Nowhere is this more apparent than in the ongoing debate around COMEX silver registered inventories and July open interest for the 2026 contract cycle.
Understanding why these metrics are so persistently misrepresented requires stepping back from the noise and examining how the COMEX futures delivery system actually functions, what the current inventory data genuinely shows, and what the real-world roll dynamics mean for silver prices over the coming weeks. For context, broader precious metals analysis reinforces just how widespread these misunderstandings have become.
The Registered vs. Eligible Distinction: A Definition That Changes Everything
The most fundamental error in retail silver commentary involves treating registered and eligible inventory as interchangeable figures. They are operationally and analytically distinct categories.
-
Registered silver refers to metal held in COMEX-approved vaults that has been formally certified and designated as immediately deliverable against a futures contract. This is the only figure relevant to assessing actual delivery capacity.
-
Eligible silver describes metal stored in the same approved facilities but not yet committed to the delivery pipeline. It could theoretically be converted to registered status, but has not been formally designated for settlement purposes.
Conflating these two categories produces a severely distorted picture of deliverable supply. A warehouse full of eligible silver provides no operational guarantee of delivery capacity unless and until that metal completes the formal registration process. This distinction is not a technicality; it is the foundational variable in any honest assessment of COMEX delivery risk.
How COMEX Silver Delivery Actually Works: A Step-by-Step Breakdown
The mechanics of futures delivery are frequently misunderstood by market commentators who treat open interest figures as though every contract will demand physical settlement. In practice, the delivery process operates quite differently.
-
A silver futures contract enters its designated delivery month (for July 2026, the delivery cycle begins at the end of June).
-
A short position holder who intends to deliver issues a formal delivery notice, tendering a depository receipt that represents ownership of specific silver bars held in a COMEX-approved vault.
-
The long position holder accepting delivery receives the depository receipt and takes legal ownership of the underlying metal without necessarily moving the physical bars.
-
Critically, that same depository receipt can be redelivered by the new holder as early as the following business day, transferring ownership again without affecting the registered inventory count.
-
This redelivery process can repeat multiple times within a single delivery month, meaning the gross volume of delivery transactions can substantially exceed the net change in registered inventory.
This operational reality is widely understood among institutional participants but almost entirely absent from retail-facing silver commentary. Gross delivery volume overstates net inventory impact by a margin that varies month to month but is almost always significant.
Jeffrey Christian, Managing Director of CPM Group, has explained this dynamic clearly in his market commentary, noting that depository receipts can change hands two or three times during a single delivery month. Some market participants stand for delivery on the first delivery day specifically to examine what inventory is available, then redeliver the same metal the following day to avoid posting the full value of the silver for an extended period. This practice is entirely routine and generates no actual drawdown of registered stocks.
When big ASX news breaks, our subscribers know first
What COMEX Silver Registered Inventories Actually Show Right Now
Verified Inventory Levels vs. Circulating Misinformation
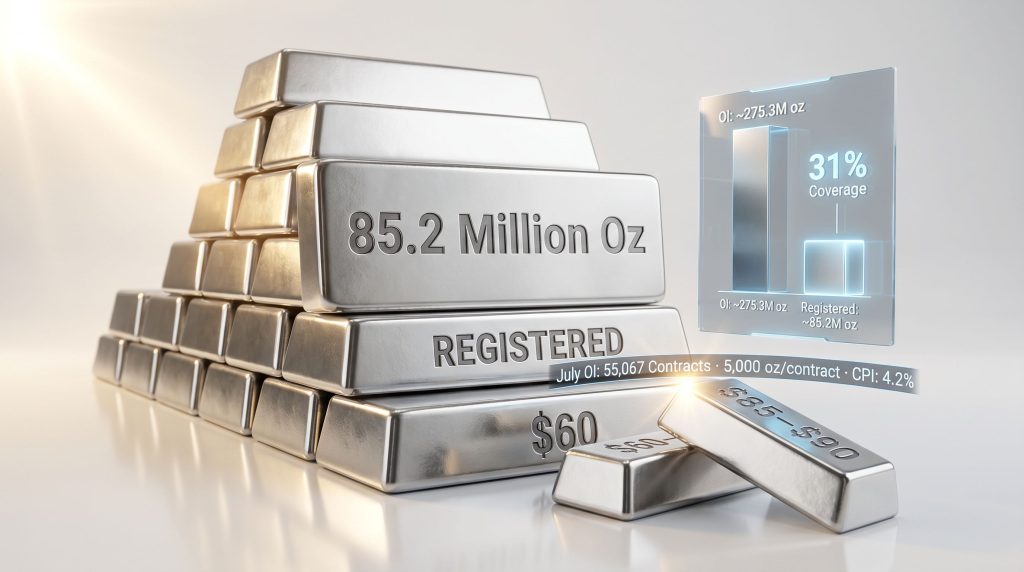
As of June 12, 2026, verified COMEX silver registered inventories and July open interest data — drawn from CME Group's official futures data — places registered silver at approximately 82 million ounces. This represents the actual pool of metal formally designated for futures delivery.
The contrast with widely circulated misinformation is stark. A figure of approximately 42 million ounces of registered silver has been propagating through financial media and AI-generated content, representing a near-50 percent understatement of verified deliverable supply. Christian characterised this specific claim as demonstrably false, noting that anyone consulting the official CME Group warehouse data could verify the discrepancy within minutes.
| Metric | Verified Figure | Circulating Misrepresentation |
|---|---|---|
| COMEX Registered Silver (June 2026) | ~82 million oz | ~42 million oz |
| Decline from 2024 Peak | ~57% from ~190 million oz | Often omits peak context |
| Historical Context (pre-2021) | Current levels exceed all pre-2021 readings | Rarely disclosed |
Why Percentage Declines Can Mislead
The reduction from approximately 190 million ounces at the 2024 peak to 82 million ounces today represents a substantial percentage decline, and some commentary treats this drawdown as evidence of an imminent delivery crisis. A more disciplined analysis, however, requires evaluating absolute levels against meaningful historical benchmarks rather than measuring only the distance from an exceptional peak.
Current registered inventory levels exceed every recorded reading prior to 2021. This historical context fundamentally reframes the narrative. The peak itself was the anomaly, inflated by a period of extraordinary investor accumulation. The current drawdown reflects a partial normalisation of that accumulation, not a structural depletion of deliverable supply. Furthermore, understanding silver supply deficits in the broader market adds necessary depth to this analysis.
Always evaluate commodity inventory drawdowns against long-term historical baselines, not solely against recent peaks. Peak levels often represent exceptional accumulation episodes, and the percentage decline from those peaks can dramatically overstate actual supply deterioration.
Breaking Down the July 2026 Silver Futures Open Interest
Current Open Interest Metrics and Coverage Ratio
As of June 11, 2026, the July silver contract carried open interest of approximately 53,600 contracts, equivalent to roughly 268 million ounces at the standard 5,000-ounce contract size. This figure had declined from approximately 71,000 contracts (355 million ounces) at the end of May, reflecting the early stages of the roll process already underway.
| July 2026 Silver Contract Metrics | Figure |
|---|---|
| Open Interest (June 11, 2026) | ~53,600 contracts |
| Total Ounces Represented | ~268 million oz |
| Registered Silver Available | ~82 million oz |
| Coverage Ratio (Registered / OI) | ~30.6% |
| Decline from Late May Peak |
The 30.6% coverage ratio commands attention when viewed in isolation. Less than a third of the open interest is covered by immediately deliverable silver. However, this statistic requires substantial context before any operational conclusions can be drawn from it.
Why a Sub-31% Coverage Ratio Is Not an Operational Red Flag
The fundamental misunderstanding embedded in coverage ratio analysis is the assumption that a meaningful proportion of open contracts will demand physical settlement. Historically, this is not how futures markets function. The overwhelming majority of silver futures positions are closed or rolled forward before the delivery cycle begins, with actual physical delivery representing a small fraction of notional open interest.
The mechanics of rolling involve shorts buying back positions in the expiring July contract and simultaneously establishing equivalent positions in a later month (typically September or December). This process generates no delivery demand and no inventory drawdown. It is simply a positional migration from one contract month to another.
The roll process for the July 2026 contract was already underway as of mid-June, with open interest having declined by roughly 87 million ounces from its late-May peak. The bulk of the remaining roll activity was expected to complete over approximately two weeks from mid-June, consistent with typical seasonal patterns for active silver contract months. In addition, silver backwardation risk remains an important structural consideration during these roll windows.
Does the July Silver Roll Generate Meaningful Price Pressure?
The Short-Covering Mechanism and Its Diminishing Impact
Historically, the roll of an active silver futures contract has occasionally generated brief, short-term upward price pressure. The mechanism involves short-covering activity in the expiring month creating localised buying demand, which can temporarily support prices for one to two weeks during the roll window.
However, Christian noted that the increasing sophistication of market participants has significantly reduced the magnitude and reliability of this effect. As more investors understand roll mechanics, fewer participants are caught off-guard by the process, and the resulting price pressure has become more muted than in earlier market cycles. The educational dimension of roll dynamics has, ironically, largely neutralised the trading edge that once accompanied them.
Three Scenarios for the July Roll Resolution
| Scenario | Conditions | Likely Price Impact |
|---|---|---|
| Orderly Roll | Most positions migrated smoothly to forward months | Neutral to mildly positive for 1-2 weeks |
| Moderate Delivery Demand | Elevated delivery notices reduce registered stocks | Short-term upward spike, quickly faded |
| Unusual Delivery Concentration | Atypical long-holder demand for physical settlement | Temporary backwardation, elevated basis |
Given the current inventory levels of 82 million ounces, the manageable scale of open interest relative to historical delivery episodes, and the increasingly informed market participant base, the base case strongly favours the orderly roll scenario. The operational math supports this view: even if delivery demand ran at several multiples of typical historical rates, the registered inventory provides substantial buffer before any structural shortage concern would be warranted.
Silver Price Structure: Consolidation, ETF Outflows, and the Path Forward
Where Silver Stands After the Mid-May Selloff
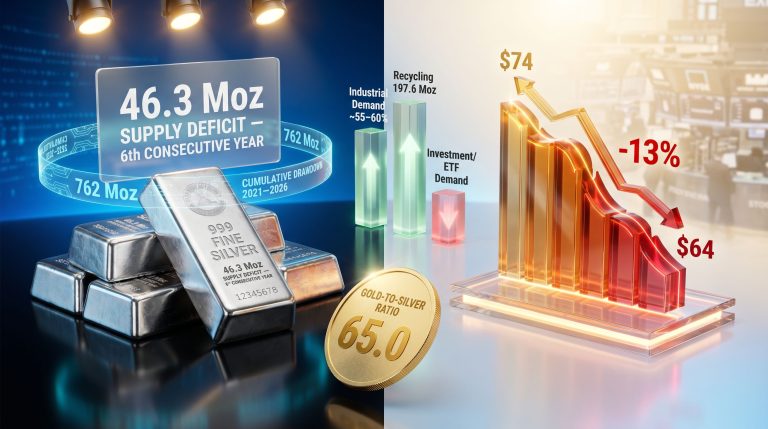
Silver prices recovered to approximately $67 per ounce as of June 12, 2026, following a sharp decline from levels seen earlier in the year. The price had tested the critical $60 level during the selloff, with technical analysts watching $55 and $50 as potential downside targets on a spike basis.
The primary driver of the price decline has not been a deterioration in physical demand fundamentals. Instead, it reflects straightforward investor liquidation, particularly from ETF holders who accumulated positions during the sharp rally of late 2025 and early 2026 and subsequently sold as prices retreated from their peaks.
Silver ETF holdings declined by approximately 13.4 million ounces between May 15 and mid-June 2026, representing a substantial liquidation wave concentrated over a relatively short timeframe. This selling pressure, rather than any physical market imbalance, accounts for the bulk of the price weakness observed since mid-May.
ETF Investors vs. Traditional Physical Holders: A Behavioural Comparison
A nuanced point that CPM Group has emphasised for years involves the fundamental behavioural difference between ETF investors and traditional long-term physical metal holders. These groups do not respond to market conditions in similar ways, and treating ETF outflows as representative of broader precious metals sentiment can produce profoundly misleading conclusions.
| Investor Category | Typical Holding Duration | Primary Motivation | Price Sensitivity |
|---|---|---|---|
| Opportunistic ETF Investors | Weeks to months | Momentum, macro hedging | High; likely to sell into weakness |
| Traditional Physical Holders | Years to decades | Wealth preservation, monetary insurance | Low; typically hold through price cycles |
| Futures Traders | Days to weeks | Speculation, commercial hedging | Very high; position-driven |
At the recent International Precious Metals Institute (IPMI) 50th anniversary conference, attended by refiners, scrap dealers, financial institutions serving the physical market, and industrial users, participants reported substantial metal flows arriving from investors taking advantage of elevated prices. Refinery processing capacity was temporarily strained by the volume of investor and scrap metal arriving for refining — a concrete physical market signal that stands in direct contrast to narratives about silver scarcity.
The anticipated consolidation range for silver over the following two to two and a half months is approximately $60 to $85-$90, with the expectation of a resumption of the broader uptrend later in 2026.
Macro Context: Inflation, the Federal Reserve, and Precious Metals Headwinds
May CPI and PPI: What the Data Reveals
The macroeconomic backdrop for precious metals is shaped significantly by inflation dynamics and Federal Reserve policy expectations, both of which carried important updates from the economic data releases of the week ending June 12, 2026.
Consumer Price Index (CPI) highlights for May 2026:
-
Month-on-month CPI increase: +0.5%, down from 0.6% in April and 0.9% in March
-
12-month headline CPI rate: approximately 4.2%, substantially above the Fed's 2% target
-
Energy costs: up approximately 28% since February 2026, heavily skewing the headline figure
-
Core CPI (excluding food and energy): approximately 2.9%, elevated but not at crisis levels
-
Services inflation: running at 3-4% annually, representing the most persistent component of the current inflation profile
-
Non-food, non-energy goods inflation: approximately 2.3%, elevated but not the primary concern
The energy component's dominance in the headline figure reflects the geopolitical disruption associated with events affecting the Strait of Hormuz in early 2026, which drove a sharp increase in energy prices that has since flowed through the broader price index with a lag.
Producer Price Index data for the same period showed 12-month rates running at approximately 6%, again heavily influenced by energy costs, while services PPI had moderated from the problematic transportation sector spikes seen in late 2025.
Federal Reserve Expectations: What Futures Markets Are Pricing
With headline inflation at 4.2% and services inflation entrenched above 3%, the probability of near-term monetary easing is structurally very low. Fed Funds futures markets reflected this reality clearly, with approximately 96%+ of market participants expecting rates to remain unchanged at the upcoming Federal Open Market Committee meeting. Fewer than 3-4% of participants were pricing in any rate reduction.
The contrarian risk in rate expectations deserves attention. With headline CPI at 4.2% and producer prices running at 6% on a 12-month basis, the directional risk for any surprise Fed move skews toward a rate increase rather than a decrease. This scenario, while not the base case, represents a meaningful tail risk for non-yielding precious metals positions.
For silver and gold investors, an unchanged or potentially higher rate environment removes one of the most frequently cited near-term bullish catalysts. Precious metals generate no yield in standard holding structures, and elevated real interest rates increase the opportunity cost of holding them. This dynamic creates a genuine short-term headwind that should be clearly distinguished from longer-term structural demand considerations. Consequently, monitoring the gold-silver ratio provides a useful lens through which to contextualise these relative pressures.
The next major ASX story will hit our subscribers first
Platinum and Palladium: Industry Pessimism and Technical Weakness
Sentiment from the Physical Market Community
The IPMI conference and the London Platinum Week held two weeks prior provided unusually direct access to sentiment among physical platinum group metals (PGM) market participants. The prevailing mood at both events leaned cautiously pessimistic on near-term price prospects, though the degree of bearishness varied between the two metals.
For platinum, currently trading at approximately $1,718 per ounce, industry participants broadly acknowledged the possibility of prices testing $1,600 and noted that current levels around $1,700 were within their expected range. Notably absent from conference discussions was any significant expectation of a return to the $800-$1,100 range that characterised platinum pricing from 2015 through 2025. The prevailing view positioned platinum within a higher range, though with downward pressure acknowledged.
| PGM Metal | Current Price | Industry Price Expectation | Technical Bias |
|---|---|---|---|
| Platinum | ~$1,718/oz | $1,600-$1,700 near-term | Downward pressure |
| Palladium | ~$1,314/oz | Bearish; stronger downside risk | More pronounced weakness |
Palladium exhibited even more bearish technical momentum than platinum, with industry participants expressing greater concern about downside risk. Christian noted that the physical market community may ultimately be surprised by how weak PGM prices can become if the bearish technical momentum intensifies, suggesting that current pessimism may still underestimate the depth of potential price weakness.
Frequently Asked Questions: COMEX Silver Inventories and July Open Interest
What is the difference between registered and eligible COMEX silver?
Registered silver has been formally certified and designated for delivery against futures contracts. Eligible silver is stored in approved facilities but has not been committed to the delivery pipeline. Only registered silver counts when assessing actual delivery capacity.
How much registered silver is currently in COMEX warehouses?
As of June 12, 2026, approximately 82 million ounces of silver are registered in COMEX-approved vaults, according to verified CME Group warehouse data. Claims of approximately 42 million ounces circulating in some financial media are factually incorrect. You can track real-time COMEX silver inventory levels to verify these figures independently.
What is the July 2026 silver futures open interest?
As of June 11, 2026, the July silver contract carried open interest of approximately 53,600 contracts, representing roughly 268 million ounces at the standard 5,000-ounce contract size.
Does open interest exceeding registered inventory signal a delivery crisis?
No. The vast majority of open contracts are rolled forward or closed before delivery, with actual physical delivery representing a small fraction of notional open interest. The 30.6% coverage ratio, while attention-grabbing in isolation, is not an operational red flag under normal market conditions.
Why has silver's price declined since mid-May 2026?
The primary driver is investor liquidation, particularly from ETF holders selling after prices peaked. Silver ETF holdings fell approximately 13.4 million ounces between mid-May and mid-June 2026. This reflects opportunistic investor behaviour, not a structural deterioration in physical silver demand fundamentals. Furthermore, silver's dual role as both an investment asset and industrial commodity means these divergences in sentiment can be especially pronounced.
Can depository receipts be redelivered multiple times in one delivery month?
Yes. A depository receipt representing specific silver bars can change hands two or three times within a single delivery month without affecting the registered inventory count. This means gross delivery volume can substantially exceed net inventory drawdowns.
Key Takeaways: What the Data Actually Tells Serious Investors
The analysis of COMEX silver registered inventories and July open interest for 2026 yields several conclusions that diverge sharply from the narratives circulating in retail-facing financial media:
-
COMEX registered silver stands at approximately 82 million ounces, nearly twice the 42 million ounces cited in widely circulated but factually incorrect reports
-
Current registered inventory exceeds all historical readings prior to 2021, providing important context for the percentage decline from the 2024 peak
-
July open interest of approximately 268 million ounces (53,600 contracts) produces a coverage ratio of roughly 30.6%, which is operationally manageable given typical physical delivery rates
-
The July roll process was already underway as of mid-June, with the bulk of position migration expected to complete over approximately two weeks
-
Silver price weakness since mid-May reflects ETF investor liquidation of approximately 13.4 million ounces, not a structural physical supply crisis
-
Macro headwinds from persistent inflation (CPI at 4.2%, PPI at 6% on a 12-month basis) and an essentially certain-to-be-unchanged Fed rate create genuine near-term resistance for silver prices
-
The anticipated consolidation range is approximately $60 to $85-$90 before a potential recovery later in 2026
-
Depository receipt redelivery mechanics routinely generate gross delivery activity that significantly overstates net inventory impact, a critical nuance absent from most retail commentary
For investors seeking ongoing, verified analysis of silver futures mechanics, ETF flows, and precious metals macroeconomics, CPM Group publishes regular video updates and research reports on their official channels, offering data-grounded perspectives that contrast sharply with the AI-generated misinformation increasingly polluting precious metals market commentary.
This article is intended for informational purposes only and does not constitute financial advice. Precious metals markets involve substantial risk, and past performance does not guarantee future results. All inventory figures and price levels referenced reflect data available as of June 12, 2026, and are subject to change. Readers should verify all quantitative data against primary sources, including CME Group's official daily warehouse stock reports, before making any investment decisions.
Want to Identify the Next Major ASX Mineral Discovery Before the Broader Market?
While understanding COMEX mechanics and silver market dynamics is essential for informed investing, Discovery Alert's proprietary Discovery IQ model delivers real-time alerts on significant ASX mineral discoveries — instantly transforming complex data across more than 30 commodities into clear, actionable insights for both short-term traders and long-term investors. Explore how historic discoveries have generated substantial returns on Discovery Alert's dedicated discoveries page, and begin your 14-day free trial today to secure a genuine market-leading edge.