June 12, 2026
The Disconnect That Defines Modern Commodity Markets
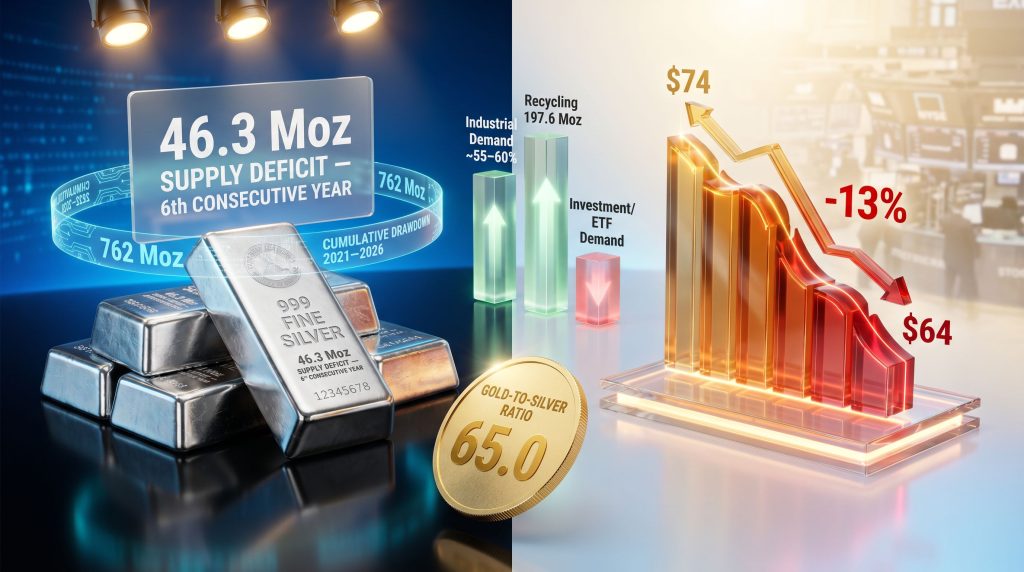
Commodity markets operate on two distinct timescales that rarely move in lockstep. Physical supply and demand unfold across years and decades, shaped by geology, capital expenditure cycles, and long-term industrial trends. Financial markets, by contrast, reprice within hours in response to data releases, central bank commentary, and institutional positioning shifts. Silver sits at the intersection of both worlds more acutely than almost any other tradeable asset, which is precisely why the metal can experience a 13% price decline during the same period that independent research projects a 46.3 million ounce supply deficit.
Understanding the silver price drop despite supply deficit conditions requires dismantling the assumption that physical fundamentals and spot prices move together in the short term. They often do not, and the mechanics behind that divergence carry significant implications for how investors should interpret price weakness in structurally undersupplied markets.
When big ASX news breaks, our subscribers know first
Why Monetary Policy Overwhelms Physical Fundamentals in the Short Term
The Opportunity Cost Mechanism for Non-Yielding Assets
Silver generates no income. It pays no dividend, no coupon, and no interest. This characteristic makes the metal acutely sensitive to the trajectory of real interest rates in a way that yield-bearing assets are not. When investors can earn an attractive return by holding government bonds or money market instruments, the appeal of allocating capital to silver diminishes proportionally. The higher the yield available elsewhere, the steeper the cost of owning an asset that simply sits in a vault or trades on a futures exchange.
This relationship explains why shifts in monetary policy expectations can trigger large, rapid moves in silver pricing that have nothing to do with whether mines are producing more or less metal, or whether solar panel manufacturers are buying more or less silver paste. Furthermore, silver's dual nature as both a monetary and industrial metal amplifies these dynamics in ways that are unique among commodities.
The Three Data Points That Triggered the June 2026 Selloff
The week that silver fell from approximately $74 per ounce to $64 was not driven by a single event. It was the convergence of three distinct macro signals that collectively shifted the interest rate outlook in a direction deeply unfavourable to precious metals.
| Macro Trigger | Reading | Market Implication |
|---|---|---|
| US Nonfarm Payrolls (May 2026) | 172,000 jobs added vs. 80,000 consensus | Labour market too strong for near-term rate cuts |
| Headline CPI (May 2026) | 4.2% year-over-year (highest since April 2023) | Inflation elevated enough to prevent easing |
| Goldman Sachs Rate Forecast Revision | All 2026 rate cuts removed; first cut pushed to June 2027 | Institutional de-risking across precious metals |
The payroll figure was particularly striking. At more than double the consensus estimate of 80,000, the 172,000 May reading was accompanied by an upwardly revised April figure of 179,000, reinforcing the view that US employment remained robust. Unemployment held at 4.3%, providing no offsetting signal of labour market softening that might prompt Fed intervention.
Inflation's Paradox: Too High for Cuts, Too Narrow for Hedging
The 4.2% headline CPI reading created an unusual and frustrating situation for silver bulls. Elevated inflation would normally support precious metals as inflation hedges. However, more than 60% of the May CPI increase was attributable to energy price disruptions linked to Persian Gulf supply tensions rather than broad-based price pressure across the economy.
Core CPI told a different story: the monthly reading decelerated from 0.4% in April to 0.2% in May, with the annual core rate easing to 2.9%. This gave policymakers a basis for holding rates rather than hiking, but removed the broad inflationary backdrop that might have driven significant hedging demand for silver.
The result was a policy paradox. Inflation was high enough to keep rates elevated but not broad enough to make silver compelling as a hedge. The CME FedWatch Tool reflected this awkward equilibrium, showing a 98.4% probability of a June hold alongside a 27.8% probability of a September rate hike. Consequently, these precious metals market impacts reverberated across the entire sector, as explored in tariffs and broader market forces.
ETF Liquidation and Leveraged Positioning: The Mechanism Behind the Selloff
Paper Markets vs. Physical Markets
The World Gold Council's Weekly Markets Monitor identified six distinct drivers of the precious metals selloff, with forced liquidation playing a central role alongside the macro triggers. The key selling mechanisms included leveraged ETF rebalancing, unwinding of extended hedge fund positioning, and pre-FOMC risk reduction ahead of the June 16-17 Federal Open Market Committee meeting.
This is a critical distinction that many retail investors miss. The price decline was not a signal of weakening physical demand for silver. It was a structural feature of modern commodity markets, where financial instruments layered on top of physical assets can amplify price moves in ways that are completely disconnected from the underlying supply-demand balance.
When leveraged ETF managers and hedge funds reduce precious metals exposure simultaneously, the resulting price dislocation can be severe and rapid regardless of whether physical inventories are being drawn down at record rates. These are two separate markets operating on fundamentally different timescales.
The FOMC Leadership Transition as an Amplifier
The June 16-17 FOMC meeting carried additional weight as the first session chaired by Kevin Warsh, creating institutional uncertainty about communication style and potential directional shifts in policy signalling. Pre-meeting positioning in this environment typically involves reducing exposure to volatile, non-yielding assets, a pattern that amplified selling pressure independent of any fundamental change in silver supply or demand.
Six Consecutive Years of Structural Deficit: The Physical Reality
Mapping the Cumulative Supply Gap
While futures markets were repricing rapidly, the physical supply picture for silver remained unchanged from its long-running structural trajectory. Indeed, the silver supply deficits driving this tightening have been building for years, with no near-term resolution in sight.
| Year | Annual Supply Deficit |
|---|---|
| 2025 | 40.3 million ounces |
| 2026 (projected) | 46.3 million ounces |
| Cumulative drawdown (2021-2026) | approximately 762 million ounces |
Source: Silver Institute World Silver Survey 2026
The 2026 deficit of 46.3 million ounces represents not only the sixth consecutive annual shortfall but an acceleration from the prior year's 40.3 million ounce gap. The cumulative 762 million ounce drawdown from above-ground inventories since 2021 represents a sustained physical tightening that has no historical parallel in the modern silver market. According to the Silver Institute, the market is firmly on course for a fifth successive structural deficit, underscoring the depth of this imbalance.
Why Mine Supply Cannot Simply Respond to Higher Prices
This is one of the least understood structural features of the silver market, and it has profound implications for the supply outlook regardless of where prices trade.
Approximately 70% of global silver mine output is extracted as a co-product of copper, zinc, and lead mining operations. Production decisions at these mines are governed entirely by the economics of the primary metal, not silver. When a copper mine decides how much to produce, it is responding to copper prices, copper demand forecasts, and copper capital expenditure returns. Silver emerges as a consequence of that decision, not as the driver of it.
This structural reality means that higher silver prices alone cannot unlock meaningful new primary silver supply. The metal that emerges from copper and zinc operations will continue at whatever rate those operations run, independent of whether silver trades at $64 or $164 per ounce.
As Oliver Turner, Executive Vice President of Corporate Development at Americas Gold and Silver, has explained in public commentary, six years of continuous deficits have not translated into supply responses because most silver production is governed by the economics of other metals rather than by silver demand. Rising industrial consumption from solar applications and other end markets does not automatically create additional silver output.
Record Recycling Still Cannot Close the Gap
Silver recycling reached a twelve-year high of 197.6 million ounces in 2025. Despite this record secondary supply recovery, the market deficit widened from 40.3 million ounces in 2025 to a projected 46.3 million ounces in 2026. The trajectory is clear: even maximum recycling throughput cannot offset the gap between mine supply and total consumption. The deficit is not a temporary anomaly that recycling infrastructure can normalise. It is structural.
Industrial Demand: The Consumption Floor That Rate Cycles Cannot Erode
Why 55-60% of Silver Demand Is Rate-Insensitive
The most important distinction in the silver demand structure is the separation between investment demand, which is highly rate-sensitive, and industrial demand, which is largely insulated from interest rate movements.
According to the Silver Institute, industrial fabrication accounted for approximately 55% to 60% of total silver demand in 2025. The key end markets include solar photovoltaic manufacturing, electric vehicle production, consumer electronics, and artificial intelligence data centre infrastructure. These buyers do not purchase silver as a speculative position or an inflation hedge. They purchase it to fulfil production schedules, manufacturing contracts, and capital expenditure programmes that were approved months or years in advance.
| Demand Sector | Rate Sensitivity | Growth Trajectory |
|---|---|---|
| Solar Photovoltaics | Low | High, driven by renewable energy deployment |
| Electric Vehicles | Low to Medium | High, driven by EV adoption programmes |
| Consumer Electronics | Low | Moderate, cyclically stable |
| AI Data Infrastructure | Low | High, accelerating capital deployment |
| Investment and ETF Demand | High | Volatile, directly tied to rate expectations |
The Consumption Floor in Practice
When the silver price drops 13% in a week, solar manufacturers do not reduce their silver paste orders. EV battery and electrical component producers do not pause procurement. Data centre operators building out AI infrastructure do not substitute away from silver-bearing components because a futures contract repriced. The industrial consumption floor persists through macro-driven corrections, maintaining physical market tightness even as paper prices decline sharply.
This divergence between rate-sensitive investment demand and rate-insensitive industrial demand is what makes the silver price drop despite supply deficit conditions so analytically important. The price signal is not reflecting a change in what is happening in manufacturing facilities and energy installations globally. It is reflecting a change in what institutional fund managers think the Federal Reserve will do next.
The Gold-to-Silver Ratio as a Valuation Framework
Reading the Ratio at 65.0
At the time of the selloff, gold was trading at approximately $4,165 per ounce while silver stood at $65.24, producing a gold-to-silver ratio of 65.0. This compared to a ratio of 55.16 in May 2026 and 59.2 in mid-May 2026, representing a rapid deterioration in silver's relative value over a short period. In addition, gold-silver ratio analysis suggests this kind of rapid deterioration often precedes periods of meaningful mean reversion.
The gold-to-silver ratio is a measure of relative monetary value that has been tracked by precious metals markets for centuries. A ratio of 65 means it takes 65 ounces of silver to purchase one ounce of gold. Historically, ratios in the 60 to 70 range have frequently preceded periods of silver outperformance over subsequent six to eighteen month windows, particularly when the macro environment that elevated the ratio begins to reverse.
The most extreme modern reading occurred in March 2020, when the ratio exceeded 100 during the COVID-19 liquidity shock. Silver relative to gold subsequently outperformed substantially through 2020 and 2021 as interest rates fell and industrial demand recovered. The current elevation to 65 reflects weaker investment demand caused by rate expectations, not a deterioration in physical market fundamentals — a distinction with significant analytical weight for investors assessing relative value.
The next major ASX story will hit our subscribers first
Why Deficits Do Not Automatically Translate to Higher Prices
The Expectations Framework
One of the most counterintuitive aspects of commodity pricing is that a supply deficit is not automatically bullish. It is only bullish relative to what the market had previously priced in. If traders were positioned for a larger deficit and forecasts are subsequently revised downward, prices can fall even though the market remains technically undersupplied. The bullish premium embedded in prior prices gets compressed by the downward revision, not by any improvement in actual supply conditions.
Several research firms revised their 2026 silver deficit projections lower ahead of the June selloff period, which contributed to compressing the premium that had been supporting prices in the $70s range.
Four Mechanisms That Allow Silver to Fall in a Deficit Environment
-
Deficit narrowing, not disappearing: A smaller-than-expected shortfall removes the incremental bullish catalyst even if the market remains technically undersupplied.
-
Investment flow withdrawal: ETF outflows and speculative position reductions remove price support independent of whether physical inventories are being drawn down.
-
Industrial sentiment compression: Near-term concerns about economic growth can weigh on the expectation of future industrial demand even when current purchasing schedules remain intact.
-
Physical tightness manifesting elsewhere first: Supply squeezes typically appear in lease rates, vault premiums, and inventory drawdown rates before they register fully in spot prices.
Where Physical Tightness Shows Up Before Spot Prices
Silver lease rates — the cost of borrowing physical silver for short periods — can spike well before spot prices reflect underlying shortages. Regional premiums over spot price in key manufacturing hubs, particularly across Asia, often signal tightening physical supply chains ahead of broader market recognition. Vault inventory levels at major depositories such as the LBMA and COMEX provide a more direct read on physical availability than futures pricing. Investors monitoring these indicators rather than spot price alone can identify developing tightness earlier than those relying solely on price signals. For instance, analysis from Crux Investor highlights how the supply crisis is actively rewriting industry economics in ways that spot prices have yet to fully capture.
Investment Implications Across the Silver Mining Value Chain
Understanding Risk-Reward Profiles at Each Stage
The structural supply deficit creates differentiated opportunities across producers, developers, and explorers, each with distinct catalysts, financing dynamics, and sensitivity to silver price movements.
Producers offer leverage to silver price movements through operating margins, with high-grade resources near existing infrastructure capable of improving cost structures without major new capital expenditure.
Development-stage projects with completed feasibility studies provide investors with published project economics and external validation of commercial viability. Key metrics include after-tax net present value, internal rate of return, payback period, and the silver price assumption embedded in the feasibility model. Vizsla Silver's Panuco project in Mexico, for example, published a November 2025 feasibility study outlining an after-tax NPV of US$1.8 billion, an IRR of 111%, and a seven-month payback period using a silver price assumption of US$35.50 per ounce. At silver prices well above that assumption, the economics improve substantially.
Exploration-stage companies offer discovery-driven value creation that can be largely independent of near-term price movements. In a physically tight silver market, high-grade discoveries capable of adding future supply attract attention from offtake counterparties, strategic investors, and streaming companies seeking access to the physical metal. GR Silver Mining reported its best-ever drill results at the San Marcial area in May 2026, with one hole returning 45.1 metres true width at 1,623 grams per tonne silver, including a higher-grade zone of 8.25 metres true width at 8,579 grams per tonne silver. Three drill rigs were active on a 20,000-metre step-out programme targeting completion in the second half of 2026, followed by an updated Mineral Resource Estimate.
As GR Silver's Vice President of Corporate Development and Relations has noted publicly, tight physical silver inventories increase the strategic value of high-grade discoveries because access to the physical metal is what offtake partners and streaming companies are ultimately seeking. High-grade silver content commands a premium and can support sophisticated financing arrangements, including offtake agreements and equity participation from parties motivated by metal access rather than purely financial returns.
Key Data Summary and Investor Takeaways
Complete Statistics Reference
| Metric | Data Point |
|---|---|
| Silver price decline (June 2026) | approximately 13%, from ~$74 to ~$64 per ounce |
| 2026 projected supply deficit | 46.3 million ounces |
| Consecutive years of deficit | 6 years (2021 to 2026) |
| Cumulative inventory drawdown | approximately 762 million ounces since 2021 |
| 2025 supply deficit | 40.3 million ounces |
| Silver recycling in 2025 | 197.6 million ounces (12-year high) |
| Co-product silver production share | approximately 70% of global mine output |
| Industrial demand share | approximately 55% to 60% of total consumption |
| Gold-to-silver ratio at selloff | 65.0 (up from 55.16 in May 2026) |
| CME FedWatch June hold probability | 98.4% |
| CME FedWatch September hike probability | 27.8% |
Five Conclusions for Investors Navigating the Silver Price Paradox
-
Short-term price and long-term fundamentals can diverge significantly. Monetary policy repricing events can overwhelm physical supply-demand signals for extended periods, creating dislocations that reward patient positioning.
-
The supply deficit is structural, not cyclical. Six consecutive years of shortfalls and a 762 million ounce cumulative inventory drawdown reflect a market where demand has persistently exceeded the combined output of mines and recycling infrastructure.
-
Industrial demand provides a consumption floor. With roughly 55% to 60% of silver consumption driven by manufacturing commitments in solar, EVs, electronics, and AI infrastructure, physical offtake is largely insulated from interest rate volatility.
-
The gold-to-silver ratio at 65 reflects investment demand weakness, not fundamental deterioration. Historically, this range has preceded silver outperformance when monetary conditions ease and investment demand returns to reinforce the physical deficit signal.
-
Monetary policy remains the swing variable. The direction of Federal Reserve communication will determine whether investment flows return to amplify the physical deficit signal or continue to suppress it. The FOMC meeting chaired by Kevin Warsh for the first time in June 2026 represented the most significant near-term catalyst for a potential reversal. However, the Morningstar assessment of why gold and silver are plunging provides additional context on how institutional analysts are framing this environment for precious metals investors.
Disclaimer: This article is intended for informational purposes only and does not constitute financial advice. Past performance of commodities, including historical gold-to-silver ratio relationships and price trajectories, is not indicative of future results. All forecasts, projections, and deficit estimates from the Silver Institute and other third parties involve assumptions that may not prove correct. Investors should conduct their own due diligence before making any investment decisions.
Want to Stay Ahead of the Next Major Silver Discovery on the ASX?
Discovery Alert's proprietary Discovery IQ model scans ASX announcements in real time, instantly identifying high-potential mineral discoveries across silver and 30+ other commodities — turning complex data into clear, actionable opportunities for investors at every level. Explore how historic discoveries have delivered extraordinary returns on the Discovery Alert discoveries page, and begin your 14-day free trial today to position yourself ahead of the broader market.