
July 24, 2026
The Invisible Supercycle: Why the Decade's Best-Performing Asset Class Remains Its Most Neglected
There is a peculiar tendency in financial markets for investors to systematically avoid the assets generating the strongest returns. Behavioural economists have documented this phenomenon across multiple cycles, but rarely has it manifested so clearly as in the commodity markets of the 2020s. The argument that commodities beat tech this decade is not simply a performance observation — it reflects a deep structural divergence between where capital has flowed and where returns have actually been generated. Physical assets, the oldest and most tangible form of wealth storage, have outperformed nearly everything else in the investable universe.
Understanding why this happened, and why capital has persistently refused to follow the returns, requires moving beyond surface-level performance data into the structural mechanics of modern portfolio construction, the psychology of institutional allocators, and the physical reality of how the global economy actually functions.
When big ASX news breaks, our subscribers know first
The Return Record That Almost Nobody Owns
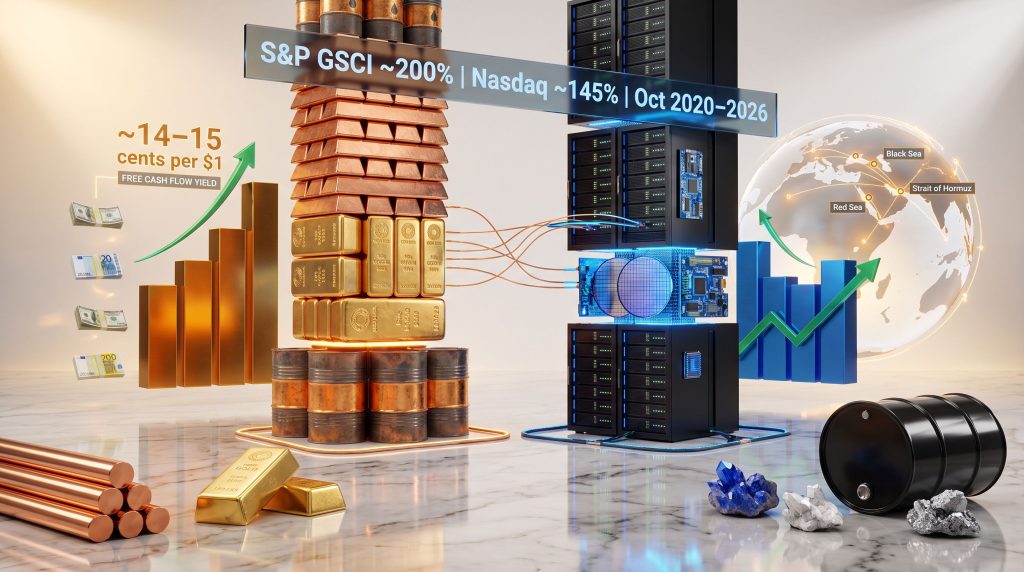
The performance data covering the period from October 2020 through 2026 presents a striking picture. Broad commodity benchmarks, measured by the S&P GSCI, have delivered cumulative returns of approximately 200% over this window. Gold has appreciated roughly 140% across the same period. In 2025 and 2026 alone, commodities as a category have gained approximately 37%, with petroleum-linked assets surging close to 81%.
The breadth of outperformance across commodity sub-categories deserves particular attention, because it demonstrates that this is not a story about a single market anomaly. Furthermore, leadership has rotated meaningfully across the cycle:
- Gold and silver as monetary metals responding to real rate dynamics and geopolitical uncertainty
- Copper as the foundational metal of electrification and digital infrastructure
- Agricultural commodities including coffee and cocoa, driven by climate-disrupted supply chains
- Crude oil and refined petroleum products as geopolitical supply shocks compounded pre-existing underinvestment
- Diesel and gasoline margins reaching record levels as refining capacity failed to keep pace with demand
The rotation across categories is itself analytically significant. When outperformance is this broad and this persistent, it typically reflects a structural rather than cyclical condition. Comparing these figures against the major technology benchmarks over the same period reveals one of the more counterintuitive investment stories of the decade:
| Asset Class | Approximate Cumulative Return (Oct 2020 to 2026) |
|---|---|
| S&P GSCI (Broad Commodities) | ~200% |
| Gold | ~140% |
| Cryptocurrency Indices | ~157% |
| Nasdaq Composite | ~145% |
| S&P 500 | ~117% |
By total return, hard physical assets have outpaced both the Nasdaq and the broader S&P 500 across the current decade. However, this performance has generated almost no meaningful reallocation from institutional investors. Energy and basic materials sectors collectively account for less than 6% of S&P 500 market capitalisation, a figure that represents less than one-third of their historical long-run weighting within the index.
The broader commodity bull run has unfolded with remarkable consistency, yet professional portfolios have remained stubbornly underweight throughout.
The Physical Capital Paradox: The best-performing asset class of the decade is simultaneously the most structurally underowned in professional portfolios. Six consecutive years of outperformance have produced minimal capital reallocation. This is not a market inefficiency that is resolving gradually; it is one that appears to be deepening.
Why Performance Has Not Attracted Capital
In conventional financial theory, superior risk-adjusted returns attract capital until the opportunity is arbitraged away. The commodity market of the 2020s represents a sustained challenge to this framework. Several structural factors explain why the traditional feedback loop between performance and allocation has broken down.
The ESG Divestment Wave and Its Unintended Consequences
Beginning in the early part of this decade, institutional allocators systematically reduced exposure to fossil fuels and extractive industries under sustainability mandates. In many cases, entire real-asset portfolio sleeves were dissolved. The irony embedded in this shift is considerable: the same institutions that divested from commodity producers on environmental grounds simultaneously committed to green energy infrastructure that requires enormous quantities of the very raw materials those producers supply.
Copper is the clearest example. Renewable energy systems require significantly more copper per unit of energy capacity than conventional fossil fuel infrastructure. A wind turbine contains roughly three to five times as much copper per megawatt of generating capacity as a natural gas plant. Solar installations, electric vehicle charging networks, and grid-scale battery storage all require copper at scale. The ongoing copper supply crunch makes divesting from copper miners whilst investing in the energy transition structurally contradictory, yet it defined institutional portfolio strategy for much of the early 2020s.
The Passive Investment Mechanism
The rise of market-capitalisation-weighted passive investing has introduced a structural bias into capital allocation that operates independently of price signals or fundamental value. In a passive-dominated market, capital flows mechanically toward whatever is largest and has recently performed strongly within the benchmark, regardless of relative valuation.
Critical Structural Insight: The marginal buyer in today's equity market is no longer responding to value signals. Capital allocation is determined by index weighting, which is itself determined by market capitalisation, which is itself driven by momentum. This creates a self-reinforcing cycle that systematically underweights sectors that have experienced prior periods of underperformance, even after the underlying fundamentals have fundamentally changed.
The consequence for commodity equities is direct. A decade of underperformance from 2009 through the early 2020s caused energy and materials to shrink within market-cap benchmarks. As those weightings declined, passive vehicles reduced their allocations automatically. By the time the commodity cycle turned, the passive mechanism was structurally positioned to participate minimally in the recovery.
Institutional Memory and the Scars of the 2010s
Portfolio managers who experienced the capital destruction of energy and metals investment cycles during the 2010s carry lasting risk aversion toward the sector. The losses from funding energy and metals projects through that period were substantial and career-defining for many allocators. This generational scar tissue creates a systematic bias toward underweighting the sector even when current fundamental conditions have structurally improved.
This psychological dynamic is well-documented in behavioural finance literature. Loss aversion is approximately twice as powerful a motivator as equivalent gain potential, meaning investors require substantially higher expected returns to re-enter an asset class where they experienced significant prior losses.
The AI Buildout: The Largest Unhedged Commodity Demand Event in History
The most consequential and least discussed dimension of the artificial intelligence investment boom is its raw material intensity. According to research from RMI, the technology sector's largest companies are collectively executing what may be the single largest commodity demand event in modern financial history, whilst simultaneously being the primary reason institutional investors have neglected commodity supply.
The seven largest technology and AI infrastructure companies are projected to deploy approximately $800 billion in capital expenditure in 2026 alone. Analysts estimate close to half of this spending flows directly into physical inputs, including:
- Copper for power transmission infrastructure, data centre electrical systems, and cooling networks
- Critical minerals and rare earth elements for AI hardware, advanced semiconductors, and server components
- Petroleum and electricity for data centre power consumption and cooling operations
- Steel and construction materials for physical data centre facilities
The combined energy footprint of the five largest purchasers of AI computing infrastructure is estimated at approximately 4 million barrels of oil equivalent per day, a consumption profile exceeding that of most major industrialised economies. Furthermore, the surging critical minerals demand driven by both AI and the energy transition creates compounding pressure on already constrained supply chains.
| Sector | Capital Deployed | Physical Commodity Dependency |
|---|---|---|
| AI and Technology Infrastructure | ~$800bn projected capex (2026) | ~50% flows to raw materials and energy |
| Commodity Supply Side | Chronically underfunded across the decade | Providing the physical inputs enabling AI |
The structural contradiction at the heart of the AI trade is stark. Investors have financed an unprecedented wave of physical resource demand whilst simultaneously starving the supply side of the capital required to meet it. This is not a short-term mismatch that market mechanisms will quickly resolve. It is a compounding structural deficit that has been building for years.
The Mechanisation Hypothesis: Why AI Accelerates Rather Than Reduces Commodity Demand
A frequently overlooked dimension of the commodity supercycle argument involves reconsidering the historical sequencing of technological and physical transformation. Conventional analysis assumes the twentieth century's mechanisation of physical labour was largely complete before the digital age arrived. However, a closer examination of the data challenges this assumption significantly.
Despite a full century of industrial machinery, an estimated 80% of physical work globally is still performed by human hands. This figure is not widely appreciated outside specialist industrial research, and it fundamentally reframes the scale of commodity demand that could emerge from genuine physical automation.
The binding constraint on mechanisation was never energy availability or mechanical capability. Repetitive, structured physical tasks were mechanised successfully by assembly lines, agricultural equipment, and industrial machinery throughout the twentieth century. The constraint was cognitive. Artificial intelligence removes that cognitive constraint. As AI enables genuinely autonomous physical systems, the true mechanisation of physical work becomes achievable for the first time. Critically, every autonomous physical system requires:
- Copper wiring, motors, and electrical components
- Rare earth elements for permanent magnets, sensors, and actuators
- Battery storage and power management systems
- Continuous energy input throughout operational life
Analytical Reframe: AI does not reduce commodity demand through efficiency gains. It dramatically accelerates demand by enabling a wave of physical automation that was previously impossible. Each layer of deployed intelligence requires a corresponding layer of physical infrastructure. The digital and physical economies are not in competition for resources; they are compounding demand on the same finite resource base.
The Munificent Seven: A Valuation Opportunity in Plain Sight
The valuation disparity between major commodity producers and technology mega-caps represents one of the most extreme divergences in modern equity market history. Goldman Sachs' Jeff Currie has identified what he terms the Munificent Seven, the western oil and gas majors supplying the energy that the AI buildout depends upon: ExxonMobil, Chevron, ConocoPhillips, Shell, TotalEnergies, BP, and Equinor.
The term is deliberately chosen to highlight the contrast with the technology sector's Magnificent Seven. These energy companies are currently generating free cash flow yields of approximately 14 to 15 cents per dollar of market capitalisation. The largest technology companies, by contrast, return approximately 2 cents per dollar of market value in free cash flow. As Roger Montgomery has noted, the commodity crunch behind AI is one of the most underappreciated dynamics in modern markets.
| Metric | Western Energy Majors | Technology Mega-Caps |
|---|---|---|
| Free Cash Flow Yield | ~14 to 15 cents per $1 market cap | ~2 cents per $1 market cap |
| Valuation vs. Pre-Conflict Levels | Trading below pre-Iran-war pricing | At or near all-time highs |
| Refining Margin Environment | Record levels in 2025 to 2026 | Not applicable |
| Capital Return Profile | Elevated buybacks and dividends | Growth-reinvestment focused |
The market is currently pricing energy majors as though their earnings environment is temporary and about to deteriorate, despite record refining margins and an unresolved geopolitical supply disruption. Meanwhile, technology mega-caps are priced for sustained future dominance that may be partially dependent on the very commodity supply these companies are declining to fund.
The next major ASX story will hit our subscribers first
Supply Buffers Are Being Depleted Simultaneously
Several converging indicators suggest the physical supply system is approaching a stress threshold that cannot be managed through financial instruments alone. In addition, OPEC's market influence has diminished as spare capacity declines, reducing the traditional safety valve for supply shocks:
- Strategic petroleum reserves across major consuming nations have been drawn down significantly from historical levels, reducing the buffer available to absorb supply shocks
- OPEC+ spare production capacity has declined meaningfully, limiting the organisation's ability to offset disruptions elsewhere in the system
- Refining capacity has not expanded to match demand growth, contributing to record margins at existing facilities, with U.S. refinery utilisation recently hitting 96.2%
- Red Sea and Strait of Hormuz shipping routes remain under active threat, simultaneously compressing multiple critical supply corridors
- Black Sea export infrastructure has experienced direct disruption from drone strikes targeting strategic oil terminals
- Inventory levels across key commodity categories remain structurally lean relative to historical norms
Record refining margins are not attracting commensurate new investment in refining capacity. Investors are simultaneously funding record demand growth whilst starving the supply side of capital. These conditions have historically preceded the kind of physical supply failure that forces rapid and expensive capital reallocation.
Historical Precedents: Scarcity, Not Returns, Triggers Reallocation
Analysis of the two most significant commodity supercycles of the modern era reveals a consistent pattern in how institutional capital eventually responds. In both cases, superior commodity returns preceded the major capital reallocation by years. The trigger for reallocation was not the performance data; it was the physical experience of scarcity.
The 1970s Energy Crisis: Energy sector allocations surged not because energy returns had outperformed other sectors for several years, but because fuel physically ran short. Petrol queues, heating shortages, and industrial rationing created a visceral experience of scarcity that could not be rationalised away in portfolio strategy sessions.
The 2000s China-Driven Metals Supercycle: Institutional investors accelerated metals exposure not primarily because commodity indices had outperformed equities for several years, but because Chinese industrial demand visibly emptied warehouse inventories. Empty shelves and extended delivery times made the demand shock tangible and impossible to dismiss.
Historical Pattern: In both documented supercycles, the return data was compelling before the crisis arrived. The crisis simply made it impossible for institutional allocators to continue ignoring the return data. Capital rotated in at significantly higher prices and under conditions of genuine scarcity.
The investment case for commodities in the current cycle has been visible and transparent throughout. The question for investors is whether they respond to the analytical framework before the physical crisis makes the case undeniable, or whether they wait for the queue, the empty shelf, or the outage.
Investment Framework: Navigating the Physical Capital Paradox
Investors evaluating commodity exposure within this framework should consider several dimensions of both the opportunity and the risk. The case that commodities beat tech this decade rests not simply on historical returns, but on compounding structural dynamics that show little sign of reversing.
Structural Bull Case
- Demand growth from AI infrastructure and the energy transition is compounding, not cyclical
- Supply-side underinvestment has created a multi-year production deficit that cannot be rapidly reversed once recognised
- Commodity producer valuations relative to free cash flow are historically attractive
- Geopolitical fragmentation of supply chains reduces the effectiveness of traditional market-clearing mechanisms
- A structurally weaker US dollar environment, driven by fiscal expansion and global reserve diversification, historically supports commodity price appreciation
Key Risks and Counterarguments
- Over longer time horizons, particularly from 1981 through 2024, equities have significantly outperformed commodities as an asset class
- Demand destruction risk is real: sufficiently high commodity prices can trigger substitution, efficiency improvements, or economic slowdown
- Technological advances in extraction, recycling, and material substitution could alleviate supply constraints faster than current projections suggest
- Rate environment shifts can affect commodity prices and commodity equity valuations materially
The supercycle thesis does not require investors to predict the precise catalyst for reallocation. It requires recognition that record demand growth, structural supply underinvestment, depleted physical buffers, and historically cheap valuations create an asymmetric risk profile. The evidence that commodities beat tech this decade has compounded year after year, yet the market has persistently declined to price it correctly. Furthermore, gold as a safe haven continues to attract attention from investors seeking protection against precisely the kind of supply-driven disruption the current environment represents.
When the physical world fails to deliver at the scale that digital ambition now requires, the paradox will resolve. History suggests it will resolve abruptly, expensively, and at a moment when the analytical case will appear, in retrospect, to have been obvious throughout.
This article is for informational purposes only and does not constitute financial advice or a recommendation to buy or sell any security. Past performance is not indicative of future results. All return figures referenced are approximations based on publicly available index data. Investors should conduct their own due diligence before making any investment decisions.
Ready to Position Yourself Ahead of the Next Major Mineral Discovery?
As the commodity supercycle deepens and structural demand for critical minerals compounds, Discovery Alert's proprietary Discovery IQ model delivers real-time ASX mineral discovery alerts, turning complex data across 30+ commodities into clear, actionable insights for traders and investors at every level — explore historic discovery returns or start your 14-day free trial today to secure your market-leading advantage before the next major opportunity emerges.