June 22, 2026
The Structural Case for Copper Has Never Been Stronger — Here Is Why Sophisticated Investors Are Paying Attention
The history of commodity markets is littered with cycles that rewarded patience and punished timing. Investors who positioned ahead of the great oil buildout of the 20th century or the iron ore supercycle of the 2000s understood one thing that reactive traders consistently miss: structural deficits do not announce themselves with a press release. They accumulate quietly, then detonate violently in price. The copper investment thesis belongs to this category of opportunity. It is not a momentum trade. It is not a quarterly earnings play. It is a decade-long structural convergence of collapsing supply growth and accelerating, irreversible demand, and the window to accumulate ahead of consensus is narrowing.
When big ASX news breaks, our subscribers know first
Why Copper Demand Is Structurally Non-Negotiable
The Three Megatrends Driving Irreversible Consumption
Most commodity bull cases rest on a single driver. The copper investment thesis is unusually robust because it rests on three simultaneously unfolding megatrends, each of which is independently sufficient to generate demand pressure, and collectively they are overwhelming.
The first is the global energy transition. Renewable energy installations are dramatically more copper-intensive than the fossil fuel infrastructure they replace. A single onshore wind turbine requires roughly 3.5 tonnes of copper, while offshore installations can require up to 15 tonnes per unit. Utility-scale solar farms use approximately 5 tonnes per megawatt of installed capacity. As governments and private capital accelerate deployment of renewable generation, the copper embedded in each megawatt compounds into extraordinary aggregate tonnage.
The second megatrend is electrified transportation. Electric vehicles contain roughly three to four times more copper than internal combustion engine equivalents. A standard EV uses approximately 83 kilograms of copper, compared to around 23 kilograms in a conventional petrol vehicle. When EV charging infrastructure is included alongside the vehicles themselves, the copper intensity of transportation electrification multiplies further.
The third megatrend is one that receives far less attention in mainstream commodity commentary: the physical infrastructure requirements of artificial intelligence and digital compute. Data centres supporting AI workloads are extraordinarily copper-intensive assets. Each hyperscale facility requires extensive copper wiring across server racks, cooling systems, and power distribution architecture. As AI adoption expands globally and new data centre campuses are commissioned at an accelerating pace, this represents a demand vector that was not even legible in copper demand models five years ago.
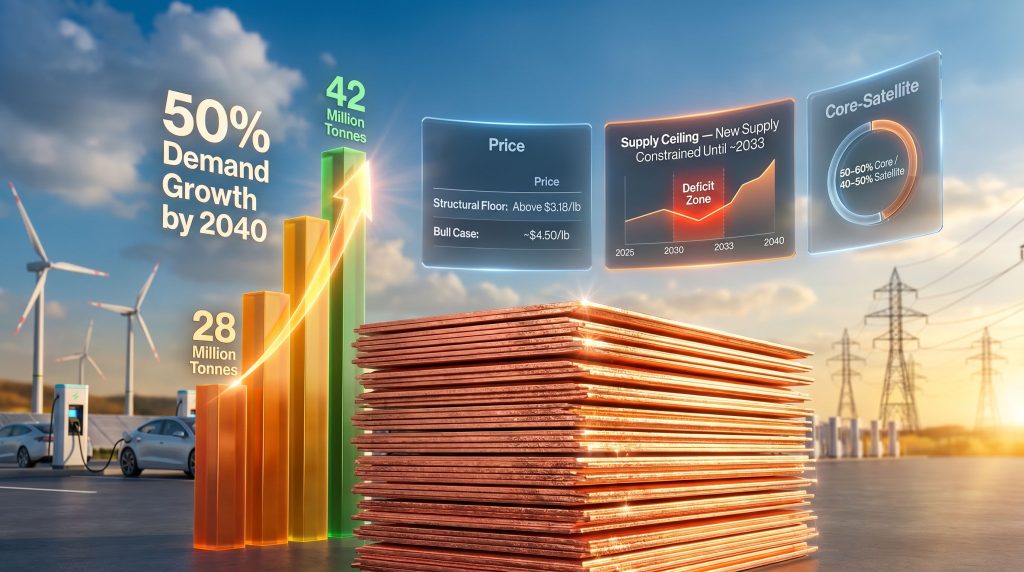
From 28 Million to 42 Million Tonnes: The Demand Trajectory
Global copper demand currently sits at approximately 28 million tonnes annually. Forecasts from industry analysts and major mining houses project this figure to reach 42 million tonnes by 2040, representing growth of roughly 50% over the next 15 years. Critically, this is not demand driven by cyclical economic expansion. The drivers are structural infrastructure transformation embedded in energy systems, transportation networks, and digital compute capacity. Economic slowdowns may trim the trajectory modestly, but they cannot reverse it.
Furthermore, as J.P. Morgan's copper outlook analysis highlights, the scale of copper demand growth projected through 2040 is not a speculative scenario. It is the mathematical result of counting the copper already specified in projects under construction, approved, or in advanced development globally. The deficit is not a forecast; it is a pipeline reality.
Why No Material Substitute Exists
A frequent counterargument to copper bull theses is the possibility of substitution. Aluminium is the most commonly cited alternative, and it does serve in some applications. However, aluminium carries significantly higher electrical resistance than copper, meaning more material is required to deliver equivalent conductivity. This creates practical limitations in high-performance power transmission, motor windings, and precision electronics where space and heat management are critical.
Carbon composites and other advanced materials remain either prohibitively expensive, insufficiently conductive, or entirely unsuitable for the bulk infrastructure applications that account for the majority of copper consumption. No material currently available or in advanced development offers a commercially viable path to replacing copper at scale across EVs, grid infrastructure, and digital compute hardware.
What the Supply Side Actually Looks Like
Global Production Is Approaching Its Ceiling
The demand picture alone would be compelling. However, the supply picture is what elevates the copper investment thesis from interesting to genuinely urgent. Understanding the copper supply crunch is therefore essential for anyone building a position in this space.
| Supply Metric | Data Point |
|---|---|
| Projected global production peak | Approximately 33 million tonnes by 2030 |
| Post-peak trajectory | Declining output from ageing tier-one assets |
| New mine development lead time | 10 to 15 years from discovery to first production |
| Earliest meaningful new supply arrival | Approximately 2033 at the earliest |
| Structural demand at projected peak | Exceeding 36 million tonnes by early 2030s |
These figures reveal a fundamental asymmetry. Supply is constrained by geology and capital cycles in ways that demand is not. Demand responds to policy mandates, private capital deployment, and technological adoption curves that are already in motion. Supply responds to exploration success, feasibility engineering, permitting processes, and construction timelines that span over a decade.
Why Major Miners Cannot Drill Their Way Out of This Problem
One of the less-understood dynamics in the copper market is what mining engineers refer to as ore grade decline. Existing tier-one copper mines are progressively moving into lower-grade ore zones as the high-grade material near surface and in shallow depths is exhausted. This means that major producers must move significantly more total rock to extract the same quantity of copper. More ore movement means higher energy consumption, greater water usage, more reagent input, and elevated cost per tonne of copper produced.
The practical result is that even substantial reinvestment in existing operations does not deliver proportional production growth. The industry has observed broadly flat copper output from major producers despite billions of dollars in capital expenditure over the past decade. Brownfield expansion at mature assets is running headlong into the geological reality of diminishing returns.
Compounding this, new greenfield copper discovery has become substantially harder. The easily accessible, near-surface deposits in politically stable jurisdictions were identified decades ago. The frontier of copper discovery now frequently involves deeper, more complex geology in jurisdictions carrying greater sovereign risk, more demanding permitting environments, and higher infrastructure development requirements.
The Structural Deficit Window
The critical insight for investors is not that the deficit exists in the future. It is that the mechanisms that would need to be activated today to close it by 2033 have not been activated. The projects are not funded. The permitting processes have not begun. The lead time is non-negotiable. This is not a forecast of a possible deficit. It is an accounting of an already-locked structural shortfall.
When demand growth exceeds the production ceiling, the market does not simply pause. It draws down existing inventories held at exchanges and in industrial buffers. London Metal Exchange copper inventories have historically proven to be a reliable early signal of tightening physical markets. Sustained drawdowns in LME stocks have, in prior cycles, preceded significant price re-ratings. The structural deficit projected for the second half of this decade is likely to trigger precisely this mechanism.
Geopolitical Risk and What It Actually Means for Copper Investors
The Reactive Trade Versus the Structural Position
When geopolitical shocks register on trading desks, a well-worn playbook activates: energy volatility spikes, oil options premiums expand, and reactive capital chases short-term crude positioning. This is a legitimate tactical response to short-horizon risk events. However, it consistently distracts investor attention from the more important second-order consequence of geopolitical instability. Indeed, as Sprott's analysis of copper's surge demonstrates, geopolitical shocks are actively building copper's bull case rather than undermining it.
Every escalation in Middle Eastern tensions, every disruption to energy supply routes, every spike in fossil fuel prices simultaneously reinforces the political and economic urgency of energy transition investment. When the cost of energy dependence becomes viscerally apparent to governments and industrial consumers, the policy acceleration behind electrification intensifies. Electrification is the single largest structural driver of copper demand. Geopolitical disruption therefore has a paradoxical long-term effect: it strengthens the copper demand outlook by reinforcing the logic of transitioning away from concentrated, politically vulnerable energy sources.
Investors who rotate capital into oil volatility during geopolitical stress events are often inadvertently selling the very catalyst that makes their long-term copper thesis more powerful. The instability that creates short-term energy price spikes is the same instability that drives long-term electrification urgency.
Strategic Positioning in a World of Persistent Uncertainty
The appropriate investor response to geopolitical uncertainty is not to trade the volatility. It is to use the hesitation created by macro uncertainty as an accumulation opportunity in structural positions. Generalist investors who reduce commodity exposure during periods of geopolitical stress create the entry conditions that reward patient, thesis-driven positioning. Consequently, reviewing robust copper investment strategies becomes particularly valuable during these windows of hesitation.
Where Does Copper Price Go From Here?
A Multi-Scenario Framework
| Price Scenario | Price Level | Conditions Required |
|---|---|---|
| Bear case / macro stress | USD 4,400 to 5,500 per tonne (~USD 2.00 to 2.50/lb) | Global growth contraction, significant demand destruction |
| Current range-bound phase | USD 5,500 to 7,260 per tonne (~USD 2.50 to 3.30/lb) | Macro uncertainty, accumulation dynamic |
| Structural long-term floor | Above USD 7,000 per tonne (~above USD 3.18/lb) | Deficit-driven physical market tightening |
| Bull case / supply crisis convergence | Approximately USD 9,900 per tonne (~USD 4.50/lb) | Inventory depletion meeting demand surge |
The current trading range reflects what experienced commodity analysts recognise as an accumulation phase: prices that are range-bound not because the fundamental thesis is weak, but because macro uncertainty is temporarily suppressing generalist investor participation. Historically, structural commodity deficits have delivered their sharpest price re-ratings during the transition from accumulation to deficit realisation, precisely when the mainstream consensus finally accepts what early-cycle investors already positioned around.
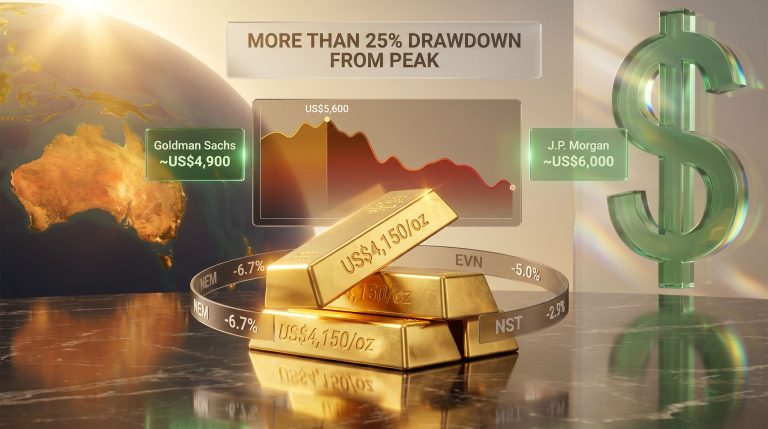
The Gold-Copper Ratio as a Valuation Signal
A less commonly discussed valuation framework is the gold-to-copper ratio, which compares the price of gold against copper on a per-tonne basis. Historically, this ratio has served as a proxy for risk appetite and relative value across precious and industrial metals. When the ratio is elevated, copper is historically cheap relative to gold, suggesting either gold is overpriced, copper is underpriced, or both. At current prices, the ratio sits at historically wide levels, which several commodity analysts interpret as a signal that copper's structural value is not yet reflected in spot pricing. Understanding the underlying copper price growth drivers helps contextualise why this ratio gap is likely to close.
The Chinese Demand Floor
China accounts for approximately 55% of global copper consumption, and its State Reserve Bureau has historically used price dips to accumulate physical copper inventory. This buying behaviour creates a practical price floor during periods of Western macro stress, as Chinese industrial buyers and state entities step in as price-sensitive offtakers during softness. This dynamic partially explains why copper has maintained support despite global growth concerns and suggests that the downside in the bear case scenario is more limited than comparable industrial commodities.
How to Structure a Copper Portfolio: The Core-Satellite Framework
What the Core-Satellite Model Actually Means
The core-satellite framework is one of the most practically useful models for building commodity exposure across a risk spectrum. It divides copper investment into two distinct functional layers:
-
Core allocation (50 to 60% of total copper exposure): Positions designed to capture commodity price appreciation with lower volatility, providing the stable backbone of the thesis.
-
Satellite allocation (40 to 50% of total copper exposure): Higher-risk, higher-reward positions targeting asymmetric upside from project development, discovery, and resource expansion.
Core Allocation: Building the Stable Foundation
Core positions in a copper portfolio typically comprise:
-
Major integrated producers such as BHP, Rio Tinto, Freeport-McMoRan, and Glencore: These companies offer direct copper price leverage combined with strong balance sheets, dividend capacity, and operational diversification that reduces asset-level risk.
-
Physical copper ETFs such as COPP and CPER: These instruments provide direct commodity exposure without company-specific operational risk, making them useful for investors seeking pure price exposure without equity risk premium.
Major producers currently trade at relatively attractive cash flow multiples compared to historical ranges, particularly given the projected copper price trajectory. This creates a situation where core positions offer both income characteristics and structural price upside, a combination uncommon in earlier stages of commodity cycles.
Satellite Allocation: Targeting Asymmetric Returns
| Satellite Tier | Allocation Range | Risk/Return Profile |
|---|---|---|
| Mid-cap development companies | 20 to 30% of total copper exposure | Feasibility-stage assets in stable jurisdictions; strongest risk-adjusted returns in satellite layer |
| Junior exploration companies | 10 to 20% of total copper exposure | High discovery optionality; requires rigorous project-level due diligence |
What Makes a Mid-Cap Copper Developer Worth Owning?
Not every copper developer deserves satellite allocation. The key differentiators between value and value trap in this segment include:
-
Jurisdiction quality: Sovereign risk and permitting environment stability are critical. A high-grade deposit in a politically unstable jurisdiction may never reach production regardless of geological merit.
-
Feasibility stage: Projects with completed pre-feasibility studies or definitive feasibility studies carry materially lower development risk than earlier-stage assets. The confidence level in capital cost estimates improves dramatically from scoping study through to DFS.
-
Resource grade and scale: The minimum threshold for economic viability in open-pit copper mining has shifted upward with cost inflation. Projects below 0.3% copper equivalent in surface-mineable configurations face increasingly challenging economics. Higher-grade underground deposits can be viable at smaller scales but carry different capital and operational profiles.
-
Management track record: The single most frequently underweighted variable in junior resource company assessment. A management team with documented prior success in delivering similar projects to production is a premium that does not always reflect in valuation.
Junior Explorers: Where Discovery Premium Resides
Junior copper explorers occupy the highest-risk segment of the satellite layer but offer the most explosive upside when discovery success occurs. In addition, majors and junior partnerships are increasingly providing juniors with capital support and technical expertise, which further de-risks the exploration pathway. Characteristics of higher-quality junior exploration positions include:
-
Technical teams with demonstrated expertise in the specific geological settings being explored (porphyry systems, IOCG deposits, or sediment-hosted styles depending on the target)
-
Proximity to existing mining infrastructure, which reduces the capital requirement to bring any discovery into production
-
Systematic, disciplined drill programmes that test defined geological targets rather than speculative step-outs
-
Conservative capital structures with sufficient runway to reach the next material catalyst without punitive equity dilution
The next major ASX story will hit our subscribers first
Timing and Entry: The Accumulation Phase Logic
Why Waiting for Confirmation Is the Expensive Option
Structural commodity deficits follow a consistent psychological arc. In the early phase, the thesis is understood by specialists and ignored by generalists. In the middle phase, range-bound pricing creates frustration among early adopters and validates the hesitation of observers. In the late phase, the deficit becomes physically undeniable, inventories collapse, and price re-rating is rapid and sharp.
Investors who enter commodity positions after the deficit is consensus-acknowledged are not accessing the structural thesis. They are paying for a thesis that has already been priced. The asymmetric opportunity lives in the range-bound accumulation phase, when macro uncertainty creates the price hesitation that enables careful entry.
Key Signals to Monitor as the Thesis Develops
Investors tracking the copper investment thesis should monitor the following indicators for evidence of thesis progression:
-
LME and COMEX copper inventory levels: Sustained drawdowns below historical norms indicate physical tightening and provide early evidence of deficit emergence.
-
Chinese import volumes and State Reserve Bureau activity: Unusual import surges or documented reserve accumulation signal that sophisticated state-level buyers are acting on the thesis.
-
Major producer capital expenditure guidance: Downward revisions to project pipelines or brownfield expansion programmes confirm the structural supply ceiling thesis.
-
EV adoption data and charging infrastructure deployment rates: These are direct leading indicators for the transportation electrification component of copper demand growth.
-
Data centre construction activity and AI infrastructure investment announcements: The overlooked demand vector that is increasingly material to aggregate copper consumption forecasts.
Key Risks Every Copper Investor Must Understand
What Could Delay or Derail the Structural Deficit?
Intellectual honesty requires acknowledging the scenarios that could weaken or defer the copper thesis:
-
A prolonged global economic contraction reducing industrial output, construction activity, and consumer goods manufacturing would create temporary demand destruction, potentially pushing the deficit timeline further into the decade.
-
A faster-than-anticipated slowdown in EV adoption in key markets, whether driven by affordability constraints, charging infrastructure delays, or consumer preference shifts, would reduce one of the three primary demand growth vectors.
-
Breakthrough developments in aluminium alloying technology or composite conductors could enable broader substitution at commercial scale, though no such breakthrough is currently in advanced development.
-
Accelerated permitting reform in major copper-producing jurisdictions could compress the 10-to-15-year development timeline, bringing new supply forward relative to current projections.
Position Sizing by Risk Tolerance
| Portfolio Type | Suggested Copper Allocation | Core vs. Satellite Split |
|---|---|---|
| Conservative | 5 to 8% of portfolio | 70% core, 30% satellite |
| Balanced | 8 to 15% of portfolio | 60% core, 40% satellite |
| Growth-oriented | 15 to 25% of portfolio | 50% core, 50% satellite |
Stop-loss discipline is particularly important for junior explorer positions, where binary outcomes around drill results and resource announcements can create rapid and significant value shifts in either direction. Rebalancing from satellite to core exposure as the thesis matures and the deficit enters its realisation phase is a prudent portfolio management approach.
Frequently Asked Questions: The Copper Investment Thesis
Is copper a good long-term investment?
Based on supply-demand fundamentals, copper presents one of the more compelling structural commodity cases of the current decade. The combination of irreversible demand growth from energy transition, EV adoption, and AI infrastructure alongside structurally constrained supply growth creates the conditions historically associated with sustained price appreciation.
What is the biggest risk to the copper bull case?
A prolonged global economic contraction represents the most significant near-term risk, as it would reduce industrial demand temporarily and could delay the deficit timeline. Substitution technology breakthroughs represent the most significant long-term structural risk, though no commercially viable alternative is currently in advanced development.
How do I invest in copper without buying physical metal?
Options include copper-focused ETFs that track commodity prices directly, ASX-listed and globally listed major copper producers, mid-cap copper development companies at the feasibility stage, and junior exploration companies with active drill programmes in prospective copper jurisdictions.
What is the copper supply deficit and when will it hit?
The structural supply deficit refers to the projected gap between global copper production capacity and global copper consumption demand. Based on current demand growth trajectories and supply pipeline analysis, the deficit is projected to become physically manifest in the second half of this decade, with inventory drawdowns expected to be the primary balancing mechanism in the absence of sufficient new supply.
Are copper ETFs a better option than mining stocks?
ETFs offer pure commodity price exposure without company-specific operational risk, making them appropriate for core allocation. Mining stocks, particularly mid-cap developers and junior explorers, offer the potential for asymmetric returns that exceed commodity price appreciation when project value is realised, but carry corresponding additional risk. A blended approach using the core-satellite framework captures both characteristics.
How does AI infrastructure growth affect copper demand?
Each new hyperscale data centre supporting AI workloads requires substantial copper across power distribution, server interconnects, cooling systems, and building infrastructure. As the global AI compute buildout accelerates, this creates a demand vector that was not present in copper forecasting models prior to approximately 2022 and is increasingly material to aggregate demand growth projections through 2030.
The Copper Investment Thesis at a Glance
| Thesis Component | Key Takeaway |
|---|---|
| Demand outlook | 50% growth projected to 2040; driven by EVs, renewable energy, and AI infrastructure |
| Supply ceiling | Production peaks near 33 million tonnes around 2030; new supply constrained until approximately 2033 |
| Structural deficit | Emerges in the second half of this decade; inventory drawdowns are the balancing mechanism |
| Price range | Currently range-bound; long-term structural floor above USD 7,000/tonne; bull case near USD 9,900/tonne |
| Optimal entry timing | Accumulation phase during macro uncertainty, before deficit becomes consensus-acknowledged |
| Portfolio structure | Core-satellite model; 50 to 60% major producers and ETFs, 40 to 50% developers and explorers |
| Geopolitical dimension | Energy security urgency accelerates electrification investment, reinforcing structural copper demand growth |
The copper investment thesis is not built on a single assumption or a single driver. It is the convergence of three independently powerful demand megatrends, a structurally constrained supply pipeline, a decade-long development lag that cannot be shortened regardless of capital commitment, and a geopolitical environment that, counterintuitively, strengthens rather than weakens the long-term demand case. Investors who build positions during the current range-bound accumulation phase, structured thoughtfully across the core-satellite spectrum, are positioning ahead of what history suggests will be one of the most significant commodity re-ratings of the coming decade.
This article is intended for informational and educational purposes only and does not constitute financial product advice. All projections, price scenarios, and demand forecasts referenced are based on publicly available industry analysis and are subject to change. Investors should seek independent financial advice before making any investment decisions. Past performance and structural commodity theses do not guarantee future outcomes.
Want to Be First When the Next Major Copper Discovery Hits the ASX?
Discovery Alert's proprietary Discovery IQ model scans ASX announcements in real time, instantly identifying significant mineral discoveries — including copper — and translating complex data into actionable insights for both traders and long-term investors. Explore historic discovery returns on Discovery Alert's dedicated discoveries page to understand the scale of opportunity that major finds can generate, then start your 14-day free trial at Discovery Alert to position yourself ahead of the market.