June 30, 2026

The global mining industry faces unprecedented structural pressures as demand fundamentals diverge sharply from supply realities. Traditional commodity cycles, typically driven by industrial production and construction activity, now encounter new variables including artificial intelligence infrastructure requirements, accelerating electrification mandates, and geopolitical supply chain vulnerabilities. This convergence creates complex market dynamics where copper price forecast scenarios must account for multiple competing forces across technology adoption curves, regulatory policy shifts, and long-term geological constraints.
Electrification Infrastructure Creates Unprecedented Demand Patterns
Grid Modernisation Drives Structural Consumption Growth
Modern electrical grid infrastructure represents the largest single driver of copper consumption growth, with 11,300+ kilotonnes consumed in 2025 specifically for power infrastructure development according to Goldman Sachs Research. This figure excludes downstream applications, focusing exclusively on transmission lines, distribution networks, and substation equipment required for grid stability as renewable energy penetration increases across major economies.
The technical complexity of grid modernisation extends beyond simple capacity expansion. Smart grid technologies require enhanced conductor specifications, increased redundancy systems, and sophisticated monitoring equipment that collectively elevate copper intensity per megawatt of installed capacity. Industry analysis suggests that next-generation grid infrastructure requires 40-60% higher copper content per transmission mile compared to legacy systems due to advanced load balancing and fault detection requirements.
Furthermore, renewable energy integration compounds copper consumption through multiple channels:
- Transmission line upgrades: Connecting remote renewable generation sites to population centres
- Grid stabilisation equipment: Battery storage systems and frequency regulation hardware
- Distribution network reinforcement: Accommodating bidirectional power flows from distributed solar installations
- Offshore wind connections: Submarine cables requiring specialised high-voltage copper conductors
Electric Vehicle Manufacturing Accelerates Material Intensity
Electric vehicle production consumed 4,118 kilotonnes of copper in 2025, representing a dramatic shift from traditional automotive manufacturing patterns. This consumption encompasses multiple vehicle systems where copper content significantly exceeds internal combustion engine requirements, directly impacting the NY copper prices 2025 trajectory.
Technical copper requirements by EV component:
| Component System | Copper Content (kg) | Function |
|---|---|---|
| Electric Motor Windings | 15-25 | Electromagnetic field generation |
| Battery Thermal Management | 8-12 | Heat dissipation and temperature control |
| Onboard Charging System | 5-8 | AC/DC conversion and power conditioning |
| High-Voltage Cabling | 12-18 | Power distribution throughout vehicle |
| Regenerative Braking | 3-5 | Energy recovery during deceleration |
The scaling mathematics become significant when projected across global production volumes. Current EV manufacturing capacity exceeds 15 million units annually with expansion plans targeting 30+ million units by 2028. Each percentage point of market share gain translates to approximately 200,000-300,000 tonnes of additional annual copper demand when accounting for supporting charging infrastructure.
Data Centre Expansion Emerges as Demand Catalyst
Artificial intelligence infrastructure created an entirely new copper consumption category, requiring 369 kilotonnes in 2025 for data centre construction and equipment manufacturing. This represents a previously unforeseen demand shock that copper market analysts had not incorporated into long-term supply-demand modelling prior to 2023.
AI infrastructure copper requirements exceed traditional data centres through:
- High-density server configurations: Advanced cooling systems requiring enhanced thermal management
- Specialised networking equipment: Higher-capacity switches and routers with increased copper content
- Power delivery systems: Robust electrical infrastructure supporting GPU-intensive workloads
- Backup power systems: Uninterruptible power supplies and generator connections
The geographic concentration of data centre development amplifies regional copper demand patterns. Major cloud computing regions in Northern Virginia, Silicon Valley, and Frankfurt experience disproportionate infrastructure investment, creating localised supply chain pressures that affect global pricing dynamics.
Industry projections suggest data centre copper consumption could reach 500,000+ tonnes annually by 2027 as AI model training requirements scale exponentially and edge computing infrastructure expands to support real-time applications across autonomous vehicles, industrial automation, and smart city initiatives.
When big ASX news breaks, our subscribers know first
Investment Bank Forecasting Models Reveal Divergent Price Scenarios
Goldman Sachs Projects Volatile Price Trajectory
Goldman Sachs Research maintains a nuanced copper price forecast incorporating both cyclical demand patterns and structural policy shifts expected throughout 2026. Their analysis identifies distinct phases of price evolution driven by different market forces across the year, particularly considering the tariff impact on copper stocks.
H1 2026 Bullish Phase ($13,000/tonne target):
The first half projection reflects continued inventory drawdown from the 600 kilotonne supply surplus identified in 2025, the largest absolute surplus since 2009. Despite this surplus, strong demand fundamentals from electrification projects and pre-emptive stockpiling behaviour by US buyers support elevated pricing levels.
Goldman analyst Eoin Dinsmore characterises current market conditions as potentially representing the late stages of the current rally, while acknowledging that US economic growth momentum, accelerated AI infrastructure spending, and strategic inventory building could maintain price support through mid-year.
H2 2026 Correction Scenario ($11,200/tonne target):
The projected second-half decline incorporates assumptions about 15% refined copper tariff implementation by US policymakers. This policy assumption creates significant uncertainty, as tariff announcements typically precede actual implementation by 12-18 months, potentially extending price volatility into 2027.
The $10,710 annual average forecast reflects Goldman's assessment that copper prices have overshot fair fundamental value, positioning policy announcements as potential catalysts for price normalisation rather than demand destruction scenarios.
Alternative Analyst Perspectives Demonstrate Forecast Dispersion
Price target comparison across major institutions:
| Institution | Target Price | Methodology Focus | Key Assumption |
|---|---|---|---|
| JPMorgan | $12,075 annual avg | Supply deficit modelling | 330,000 tonne shortage |
| UBS | $13,000 year-end | Long-term demand growth | Sustained electrification |
| Citigroup | $5.90/lb (Q2) | US dollar weakness | Currency debasement trade |
| Bank of America | $5.13/lb annual | Industrial demand cycle | Economic growth correlation |
The significant variance between institutional forecasts reflects different analytical frameworks for assessing supply-demand equilibrium. However, most analysts agree that understanding copper price growth drivers remains crucial for accurate projections. JPMorgan's bullish stance emphasises structural supply constraints, while Bank of America incorporates greater sensitivity to macroeconomic growth cycles that could moderate industrial demand.
Forecast methodology differences include:
- Mine production assumptions: Varying estimates of Chilean output stability and Peruvian political risk
- Demand elasticity calculations: Different sensitivity models for price-responsive consumption
- Policy implementation timing: Divergent expectations regarding US trade policy execution
- Inventory behaviour modelling: Alternative assumptions about strategic stockpiling duration
US Trade Policy Creates Market Structure Uncertainty
Tariff Implementation Timeline Affects Price Discovery
The proposed 15% refined copper tariff represents a fundamental shift in US trade policy that could restructure global copper flows and pricing mechanisms. Goldman Sachs assumes mid-2026 announcement timing with 2027 implementation, creating an extended period of market uncertainty that supports current elevated pricing despite fundamental supply-demand balance suggesting lower equilibrium levels.
Pre-tariff market dynamics include:
- Accelerated purchasing schedules: US buyers advancing normal inventory cycles by 6-12 months
- Supply chain reconfiguration: Importers seeking alternative sourcing arrangements before tariff implementation
- Pricing arbitrage opportunities: Regional price differentials expanding as market structure anticipates policy changes
- Financial hedging activity: Increased futures market participation as commercial users manage policy risk
The political economy surrounding tariff implementation introduces additional complexity. US mid-term elections in November 2026 create affordability pressures that could influence policy timing or tariff rates, as refined copper costs directly affect construction, manufacturing, and infrastructure sectors with significant employment impacts across swing states.
Currency Debasement Trade Amplifies Hard Asset Demand
The Sprott Physical Copper Trust exemplifies growing investor interest in copper as a hard asset allocation during periods of fiat currency volatility. After 18 months of trading, the fund accumulated $190 million in net assets at $11.87 per unit, demonstrating substantial institutional and retail interest in direct copper exposure beyond traditional mining equity investments.
Debasement trade mechanics affecting copper pricing:
- US dollar weakness: Driving international investors toward commodity allocations
- Monetary policy uncertainty: Central bank balance sheet expansion creating inflation hedging demand
- Geopolitical risk premium: Physical asset accumulation during international tension periods
- Portfolio diversification trends: Modern Portfolio Theory applications incorporating commodity exposure
Sprott analysts identify electricity demand growth projections of 157% increase by 2050 as fundamental justification for copper's role in long-term wealth preservation strategies, distinguishing copper from other industrial metals through its essential role in energy transition infrastructure that governments cannot substitute or defer.
Supply-Side Constraints Create Long-Term Price Support
Mine Development Timeline Constraints Limit Response Capacity
The copper mining industry faces structural limitations that prevent rapid supply responses to price incentives. Average 17-year development timelines from discovery to production create fundamental supply inelasticity that distinguishes copper from other industrial commodities with shorter development cycles. For instance, the recent Argentinian copper system discovery highlights these lengthy development requirements.
Mine development phase breakdown:
- Exploration and Discovery (3-5 years): Geological surveying and initial resource definition
- Feasibility Studies (2-3 years): Economic analysis and technical design optimisation
- Environmental Permitting (3-5 years): Regulatory approval processes varying by jurisdiction
- Construction and Commissioning (3-4 years): Infrastructure development and equipment installation
- Ramp-Up to Full Production (1-2 years): Operational optimisation and capacity achievement
This extended timeline means that current high copper prices cannot generate meaningful supply increases until the early 2040s, assuming immediate acceleration of exploration and development activities. Most mining companies reduced exploration spending during the 2015-2020 period of lower copper prices, creating a pipeline deficit that compounds current supply constraints.
Ore Grade Deterioration Affects Production Economics
Chilean copper operations, representing approximately 28% of global production, face declining ore grades that increase processing costs and reduce effective mine life. This geological reality affects both existing operations and new development projects, as lower-grade deposits require more extensive processing infrastructure and higher energy consumption per unit of refined copper output.
Grade deterioration impacts:
- Energy intensity increases: Lower grades require more crushing, grinding, and flotation processing
- Water consumption expansion: Additional processing steps demand greater water resources in arid regions
- Waste rock generation: Higher ratios of overburden removal to copper production
- Capital expenditure requirements: More sophisticated processing equipment for marginal deposits
Industry analysis indicates that average copper ore grades globally have declined from approximately 1.6% copper content in 1980 to less than 0.8% in 2025, effectively doubling the amount of rock that must be processed to maintain equivalent copper output levels.
Strategic Investment Positioning for Copper Exposure
Direct Investment Vehicle Evaluation
Investors seeking copper exposure face multiple vehicle options with distinct risk-return profiles and operational characteristics suited to different portfolio allocation strategies. Consequently, understanding the broader copper investment outlook becomes essential for informed decision-making.
Physical Copper ETFs provide direct commodity exposure without operational risk from individual mining companies. The Sprott Physical Copper Trust represents the primary option for investors seeking unlevered copper exposure with professional custody and storage management. This structure eliminates mine production risk, labour disputes, and jurisdiction-specific regulatory changes while providing pure copper price sensitivity.
Major Diversified Miners including BHP Group and Rio Tinto offer copper exposure within broader commodity portfolios that provide natural diversification across multiple metals markets. These companies typically maintain strong balance sheets, established operations across multiple jurisdictions, and dividend policies that provide income during periods of price volatility.
Pure-Play Copper Companies such as Freeport-McMoRan and Southern Copper Corporation provide concentrated copper exposure with higher beta characteristics relative to copper price movements. These investments carry greater operational leverage to copper prices but increased sensitivity to mine-specific risks including geological challenges, labour relations, and environmental compliance issues.
Geographic Diversification Considerations
Jurisdiction-specific risk factors affecting copper investment decisions:
| Region | Production Share | Key Risks | Investment Characteristics |
|---|---|---|---|
| Chile | 28% | Water scarcity, grade decline | Stable regulatory environment |
| Peru | 12% | Political instability, social opposition | Lower-cost operations |
| China | 8% | Domestic consumption priority | Limited foreign investment access |
| Democratic Republic of Congo | 8% | Geopolitical instability | High-grade deposits, infrastructure challenges |
| United States | 6% | Environmental permitting delays | Regulatory predictability |
Investment strategies incorporating geographic diversification typically allocate across multiple jurisdictions to reduce concentration risk from any single country's political, environmental, or economic developments that could affect production continuity.
Risk Management Framework Implementation
Volatility management strategies for copper investments include:
Collar Options Strategies: Purchasing protective puts while selling covered calls to limit downside risk while capping upside participation. This approach suits investors seeking reduced volatility during periods of heightened price uncertainty surrounding policy implementation or macroeconomic developments.
Position Sizing Relative to Liquidity: Copper investments, particularly smaller mining companies, often exhibit limited daily trading volumes that could affect exit timing during market stress periods. Professional portfolio management typically limits individual copper positions to levels that can be liquidated within reasonable timeframes without significant market impact.
Currency Exposure Management: Investors in USD-denominated markets face additional considerations when investing in companies with operations in Chilean pesos, Peruvian soles, or other local currencies that could affect returns through exchange rate movements independent of copper price performance.
Technical Indicators and Fundamental Monitoring Framework
Supply-Side Data Points for Market Assessment
Critical supply monitoring metrics include:
London Metal Exchange Warehouse Inventory Levels: Weekly inventory reports provide real-time indication of physical copper availability and inventory trends that affect near-term pricing dynamics. Current inventory levels relative to historical averages indicate market tightness or abundance. For more detailed market analysis, copper price forecasts from industry specialists provide comprehensive market overviews.
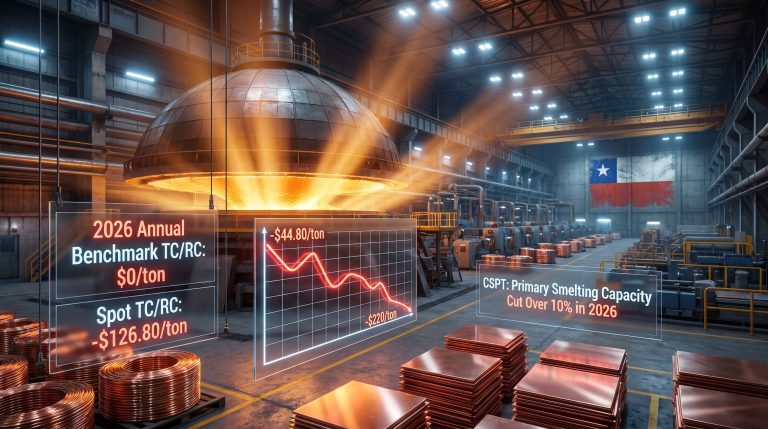
Treatment and Refining Charges (TC/RCs): These processing fees paid by miners to smelters provide leading indicators of concentrate availability and smelting capacity utilisation. Rising TC/RCs typically indicate increasing concentrate supply, while declining charges suggest tighter raw material availability.
Mine Production Disruption Monitoring: Tracking labour disputes, equipment failures, weather-related interruptions, and political developments affecting major producing mines provides early warning indicators for supply interruptions that could affect pricing.
Exploration Expenditure Trends: Annual exploration spending by major mining companies indicates future supply pipeline development and industry confidence in long-term copper demand fundamentals.
Demand-Side Leading Indicators
Infrastructure Investment Commitments: Government announcements regarding grid modernisation budgets, renewable energy targets, and electric vehicle adoption incentives provide quantifiable demand growth projections that affect long-term copper price forecast scenarios.
Electric Vehicle Sales Data: Monthly EV registration statistics across major markets (China, Europe, United States) enable calculation of incremental copper demand based on average copper content per vehicle and market penetration rates.
Construction Activity Metrics: Building permits, infrastructure project announcements, and construction PMI readings across major economies provide proxy indicators for copper demand from traditional construction and industrial applications.
Data Centre Capacity Expansion: Cloud computing capital expenditure guidance from major providers (Amazon Web Services, Microsoft Azure, Google Cloud) indicates AI infrastructure investment levels that drive incremental copper consumption beyond traditional data centre requirements. Additionally, comprehensive copper price analysis from economic data providers offers valuable market insights.
The next major ASX story will hit our subscribers first
Market Psychology and Behavioural Factors
Inventory Behaviour During Policy Uncertainty
Current market conditions demonstrate how policy uncertainty affects purchasing behaviour independent of underlying supply-demand fundamentals. US copper buyers advancing normal inventory cycles by 6-12 months creates artificial demand that supports prices above levels justified by current consumption patterns.
This pre-emptive stockpiling behaviour typically reverses following policy resolution, whether through tariff implementation or policy abandonment. Historical analysis of similar trade policy episodes suggests inventory normalisation periods of 12-18 months following policy clarification, during which demand moderation could pressure prices despite continued underlying consumption growth.
Investor Sentiment and Commodity Cycles
Copper's unique position in energy transition narratives creates psychological support during market volatility periods as investors associate copper demand with irreversible technological and policy trends rather than cyclical economic patterns affecting other industrial metals.
The emergence of debasement trade dynamics reflects growing institutional recognition of copper as a monetary hedge during currency volatility periods, expanding the investor base beyond traditional commodity and mining equity specialists to include fixed-income and currency hedge fund strategies.
Sentiment indicators affecting copper investment flows:
- Commitment of Traders data: Weekly reporting of speculative versus commercial positioning in copper futures markets
- ETF flow analysis: Net creation/redemption activity in copper-focused exchange-traded products
- Mining equity performance: Relative performance of copper miners versus broader market indices as sentiment proxy
- Analyst recommendation trends: Consensus rating changes across coverage universe indicating professional sentiment evolution
The convergence of structural demand growth, supply constraints, and policy uncertainty creates a complex environment where traditional commodity analysis must incorporate new variables including technological adoption rates, regulatory implementation timelines, and geopolitical supply chain resilience. Investment success in copper markets increasingly requires multi-disciplinary analysis spanning geological constraints, political economy factors, and technological development trajectories that extend far beyond conventional supply-demand modelling approaches.
This analysis contains forward-looking statements and projections that involve substantial risks and uncertainties. Commodity prices are inherently volatile and subject to numerous factors beyond the scope of this analysis. Past performance does not guarantee future results. Investors should conduct their own research and consider consulting qualified financial advisors before making investment decisions.
Ready to Capitalise on Copper's Next Major Discovery?
Discovery Alert's proprietary Discovery IQ model delivers real-time alerts on significant ASX mineral discoveries, instantly empowering subscribers to identify actionable opportunities ahead of the broader market. Understand why major mineral discoveries can lead to substantial returns by exploring Discovery Alert's dedicated discoveries page, showcasing historic examples like De Grey Mining and WA1 Resources that delivered exceptional outcomes for early investors.