July 31, 2026
The Geology Behind a 280% Resource Surge: What Copper Investors Rarely Consider First
Most investors instinctively reach for the headline tonnage figure when a mineral resource estimate lands. That instinct is understandable but incomplete. What separates genuinely transformative resource updates from incrementally useful ones is the structural geology underneath the numbers, the economic assumptions embedded in the cut-off grade economics, and the brownfield infrastructure context that determines how quickly a tonne of rock can become a pound of sellable copper.
The 2026 Selkirk Copper Minto resource estimate, carrying an effective date of June 10, 2026, delivers all three dimensions simultaneously. Understanding why this particular update carries weight requires looking past the 280% tonnage increase and examining the mechanical forces that produced it.
When big ASX news breaks, our subscribers know first
Understanding the Minto Project: Infrastructure, Ownership, and Strategic Context
What Assets Does Selkirk Copper Already Control at Minto?
The Minto Project sits within the Minto-Carmacks copper belt in Yukon, Canada, a jurisdiction with a documented copper endowment that remains underexplored relative to its geological prospectivity. Selkirk Copper Mines (TSXV: SCMI | OTCQB: SKRKF | FRA: IO20) controls 26,850 hectares of mineral claims across this belt, giving the company a substantial land position around an asset with a verified production history.
What distinguishes Minto from most development-stage copper projects in northern Canada is the infrastructure already in place. The site hosts a 4,100-tonne-per-day processing plant and a 400-person accommodation camp, assets that in a greenfield development scenario would require years of construction and hundreds of millions of dollars in capital expenditure before a single tonne of ore could be processed.
An additional layer of strategic significance comes from the ownership structure. The Selkirk First Nation holds a controlling interest in Selkirk Copper Mines, a relationship that reflects genuine partnership rather than a procedural consultation model. In Canadian mining, social licence and Indigenous partnership are increasingly central to whether a project advances on schedule.
How Does Minto Compare to Other Yukon Copper Projects?
| Feature | Minto (Selkirk Copper) | Typical Yukon Greenfield Project |
|---|---|---|
| Processing Plant | Existing 4,100 tpd | Requires construction |
| Accommodation | 400-person camp in place | Requires construction |
| Resource Stage | PEA-stage (2026 MRE) | Exploration / early resource |
| Indigenous Partnership | Selkirk First Nation (controlling) | Varies |
| Mineral Claims | 26,850 hectares | Varies |
The brownfield advantage is often underpriced by retail investors who focus on resource size without adequately weighting the capital cost differential between restarting an existing facility and constructing one from scratch.
Breaking Down the 2026 Minto Resource Estimate: Scale, Grade, and Composition
What Are the Headline Figures from the June 2026 Mineral Resource Estimate?
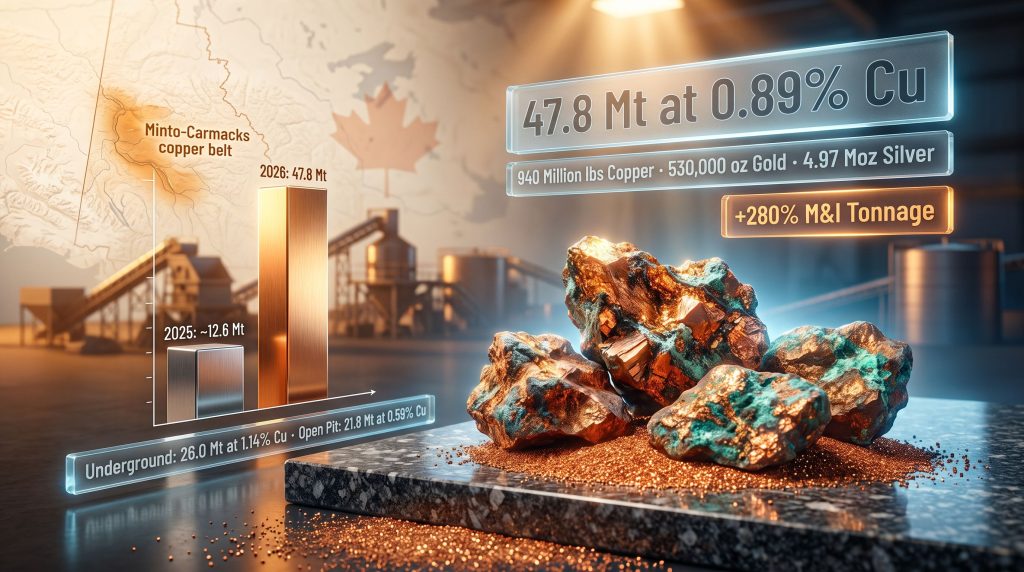
The 2026 Selkirk Copper Minto resource estimate establishes the following measured and indicated resource base:
- Total measured and indicated tonnage: 47.8 million tonnes
- Copper grade (M&I): 0.89% Cu
- Gold grade (M&I): 0.34 g/t Au
- Silver grade (M&I): 3.2 g/t Ag
- Contained copper (M&I): 940 million pounds
- Contained gold (M&I): 530,000 ounces
- Contained silver (M&I): 4.97 million ounces
Inferred resources add a further 16.9 million tonnes at 0.76% copper, 0.26 g/t gold, and 2.7 g/t silver, holding 281 million pounds of copper, 142,000 ounces of gold, and 1.5 million ounces of silver.
Key Insight: The 2026 estimate represents a 280% increase in measured and indicated tonnage relative to the 2025 estimate, a scale of growth rarely achieved between consecutive resource updates at a single project.
How Does the Resource Split Between Underground and Open-Pit Mining Scenarios?
| Mining Method | Tonnage (M&I) | Copper Grade | Gold Grade | Silver Grade |
|---|---|---|---|---|
| Underground | 26.0 Mt | 1.14% Cu | 0.49 g/t Au | 4.4 g/t Ag |
| Open Pit | 21.8 Mt | 0.59% Cu | 0.17 g/t Au | 1.8 g/t Ag |
| Total M&I | 47.8 Mt | 0.89% Cu | 0.34 g/t Au | 3.2 g/t Ag |
| Mining Method | Tonnage (Inferred) | Copper Grade |
|---|---|---|
| Underground | 9.8 Mt | 0.91% Cu |
| Open Pit | 7.1 Mt | 0.55% Cu |
| Total Inferred | 16.9 Mt | 0.76% Cu |
The grade differential between underground and open-pit material is significant. Underground resources grading 1.14% copper sit comfortably within the range considered economically robust for bulk underground mining methods. Open-pit material at 0.59% copper is more grade-sensitive, meaning its economic viability depends more heavily on operating cost control and by-product credit contributions from gold and silver.
What Metal Price Assumptions Underpin the 2026 Estimate?
The estimate was constructed using the following price deck:
- Copper: US$4.60/lb
- Gold: US$3,300/oz
- Silver: US$40/oz
- Open-pit NSR cut-off: CAD$30/tonne
- Underground NSR cut-off: CAD$80/tonne
The independent qualified person responsible for the estimate is Sue Bird of Moose Mountain Technical Services. A supporting NI 43-101 technical report is scheduled to be filed within 45 days of the announcement date. It is worth noting that the gold price assumption of US$3,300/oz sits above the long-run consensus price used by many conservative analysts, which has implications for how much of the open-pit resource retains economic status under more cautious pricing scenarios.
How Does the 2026 Estimate Compare to the 2025 Minto Resource?
A Year-on-Year Resource Growth Analysis
The prior NI 43-101 technical report, effective April 7, 2025, established 12.588 million tonnes of indicated resources at 1.20% copper and 23.658 million tonnes of inferred resources at 1.05% copper. The 2026 update supersedes that report entirely. For investors accustomed to interpreting drill results in the context of resource model evolution, the scale of this revision is unusual.
| Metric | 2025 Estimate | 2026 Estimate | Change |
|---|---|---|---|
| M&I Tonnage | ~12.6 Mt indicated | 47.8 Mt | +280% |
| Contained Copper (M&I) | Baseline | 940 Mlbs | +182% |
| Contained Gold (M&I) | Baseline | 530,000 oz | +184% |
| Contained Silver (M&I) | Baseline | 4.97 Moz | +188% |
| Inferred Copper | ~281 Mlbs | 281 Mlbs (separate pool) | Maintained |
Analytical Note: Investors should be aware that the 2025 technical report is no longer considered current under NI 43-101 standards. Any analysis or valuation work still referencing the 2025 figures is working from superseded data.
What Drove the Magnitude of Growth Between the Two Estimates?
Two roughly equal forces produced the expansion:
-
Geological discovery: New and expanded high-grade mineralised lenses identified through Phase 1 drilling contributed approximately half of the overall M&I tonnage increase. This is genuine resource growth in the purest sense, driven by rock that was previously unclassified or undrilled.
-
Economic assumption revision: Updated metal price assumptions and revised mine design parameters lifted previously sub-marginal material above cut-off thresholds, converting tonnage that existed in the ground all along into classifiable resource. This category of growth is real but conditional, it remains sensitive to commodity price cycles.
The Phase 1 drilling programme covered 52,288 metres across 175 holes. Combined with all historical work, the total geological database underpinning the 2026 estimate spans 428,388 metres across 1,956 drill holes, providing a substantial foundation of subsurface data. Furthermore, when contextualised against broader copper market trends, the timing of this resource expansion aligns with growing global demand for new copper supply.
Four Discovery Zones Driving the Resource Expansion
Where Did Phase 1 Drilling Generate the Most Significant Resource Growth?
Minto North: High-Grade Lens Expansion
Minto North holds the highest average grades within the updated resource envelope. The indicated resource here averages 1.39% copper, 0.75 g/t gold, and 6.57 g/t silver, with indicated contained copper growing by 238% relative to the 2025 estimate. The gold and silver grades at Minto North are particularly notable: at current metal prices, these by-product credits would materially reduce the net cost of copper production from this zone.
Minto Main: First-Time Resource Establishment
Minto Main represents a conceptually important development. This area had only sparse historical drilling, which meant it was effectively invisible to previous resource models. Phase 1 drilling established measured and indicated resources here for the first time, and mineralisation has been confirmed to remain open toward the west and northwest. The expansion potential in these directions is not yet quantified.
Area 118: New Discovery Beneath Existing Infrastructure
Area 118 sits beneath previously delineated resources and in close spatial proximity to active underground workings. A large inferred resource has been outlined here, and it has been designated a priority infill target for Phase 2 drilling. The geological logic is straightforward: proximity to existing underground development reduces the potential capital required to access the ore, making it one of the higher-value infill opportunities in the programme.
Ridgetop: Near-Surface Open-Pit Resource Growth
Ridgetop comprises a series of stacked, near-surface mineralised lenses sitting within the open-pit resource envelope. Indicated contained copper at Ridgetop expanded by 255% against the 2025 estimate. The near-surface geometry is an operational advantage for open-pit extraction, as shallower ore generally requires less strip ratio management in early mine life.
What Is the Spatial Scale of Mineralisation at Minto?
Multiple mineralised lenses are distributed across an area of approximately 3 kilometres by 3 kilometres. Mineralisation has been confirmed to depths of at least 650 metres below surface, and the deposit remains open laterally and at depth across the central mine area. This spatial configuration matters for mine planning: a broad, multi-zone system of this type offers sequential mining flexibility that a single-lens deposit does not.
What Is the Development Pathway Following the 2026 Resource Estimate?
From Resource to Feasibility: The Structured Advancement Plan
The development sequence following the 2026 Selkirk Copper Minto resource estimate proceeds through several defined stages:
- Updated PEA: Currently being developed using the 2026 MRE as its resource input, targeting a mine life of 12 to 15 years at 4,100 tonnes per day mill throughput.
- Technical report filing: The supporting NI 43-101 document is due within 45 days of the announcement.
- Feasibility study commencement: Scheduled for Q3 2026, progressing toward a definitive feasibility study that will require resource confidence upgrades from inferred to indicated classification in key zones.
- Phase 2 drilling integration: Results not yet in the resource model will feed into future estimates and the feasibility study resource base.
What Is Phase 2 Drilling Targeting and How Far Along Is It?
At the time of the announcement, the 50,000-metre Phase 2 programme was 75% complete, with 37,000 metres drilled. Key objectives include:
- Infill drilling at Area 118 to upgrade inferred resources toward indicated classification
- Achieving drill spacing consistent with indicated resource confidence standards
- Providing the resource confidence levels required to support feasibility study economic modelling
- Continuing to test expansion potential across the broader central mine area
Important: Phase 2 results are not incorporated into the 2026 MRE. This represents a meaningful body of unquantified upside that could materially alter the resource picture in a future update.
M. Colin Joudrie, President and CEO of Selkirk Copper Mines, has communicated that the Phase 1 programme demonstrated the capacity to grow mineable resources across the Minto property in a manner that is both cost-effective and timely, positioning the project for continued advancement through the study process.
The next major ASX story will hit our subscribers first
How Should Investors Interpret a 280% Resource Increase?
Frameworks for Evaluating Resource Growth at Redevelopment-Stage Projects
Not all resource increases carry the same investment signal. A structured framework helps separate genuinely value-accretive growth from optically impressive numbers that reflect shifting economic assumptions more than new mineralisation. In addition, understanding how mineral resource estimates are constructed provides critical context for evaluating whether headline tonnage figures translate into genuine project value.
Four lenses to apply to the 2026 Minto update:
-
Brownfield multiplier effect: At a project with existing processing infrastructure, each additional tonne of resource directly extends potential mine life rather than requiring proportional capital investment. This is the core brownfield advantage and it is frequently underweighted in junior mining valuations.
-
Geological versus economic growth: Approximately half of the M&I expansion reflects genuine drilling success. The other half reflects a revised price deck and cut-off methodology. Investors who rely solely on tonnage headlines may not appreciate this distinction.
-
Resource classification trajectory: The conversion pathway from inferred to indicated to measured is what enables financing and mine planning. The existence of 16.9 million inferred tonnes at Area 118 and elsewhere represents future optionality, not current mine plan material.
-
Polymetallic credit economics: At US$3,300/oz gold and US$40/oz silver, the by-product credits embedded in the underground resource at Minto North become a significant economic variable. A gold-equivalent calculation at these prices would substantially reduce the effective copper cost of production from the highest-grade zones.
What Risks and Limitations Should Be Considered?
No resource estimate analysis is complete without an honest accounting of its constraints:
-
Inferred resource limitations: Under NI 43-101 standards, inferred resources cannot be used in economic mine plans. The 16.9 million inferred tonnes require Phase 2 infill drilling before they can contribute to a feasibility study.
-
Price deck sensitivity: The use of US$4.60/lb copper and US$3,300/oz gold sits above the long-run price assumptions employed by some institutional analysts. Material priced above these thresholds using the current cut-off methodology could fall below cut-off if prices contract.
-
Superseded technical reports: The 2025 NI 43-101 technical report is no longer current. Investors should wait for the updated 43-101 filing within the 45-day window before drawing conclusions from the resource model's full technical underpinnings.
-
Phase 2 results pending: 37,000 metres of drilling have been completed but not yet incorporated into any resource model. The eventual impact of this work, whether expansionary or constraining, remains unknown.
This article contains forward-looking statements and resource estimates that are subject to change. Mineral resource estimates are not mineral reserves and do not have demonstrated economic viability. Readers should refer to the company's official NI 43-101 technical reports and regulatory filings for complete disclosure. This content does not constitute financial advice.
Frequently Asked Questions: Selkirk Copper Minto Resource Estimate
What is the total resource at the Minto Project as of 2026?
The 2026 Selkirk Copper Minto resource estimate defines 47.8 million tonnes of measured and indicated resources grading 0.89% copper, 0.34 g/t gold, and 3.2 g/t silver, containing 940 million pounds of copper, 530,000 ounces of gold, and 4.97 million ounces of silver. An additional 16.9 million tonnes of inferred resources grade 0.76% copper and contain 281 million pounds of copper.
How does the 2026 estimate differ from the 2025 NI 43-101 estimate?
The 2025 estimate reported 12.588 million tonnes of indicated resources at 1.20% copper and 23.658 million tonnes of inferred resources at 1.05% copper. The 2026 update increased measured and indicated tonnage by 280% and grew contained copper, gold, and silver by 182%, 184%, and 188% respectively. The 2025 report is no longer considered current under NI 43-101 standards.
Who prepared the 2026 Minto resource estimate?
The estimate was prepared by Sue Bird of Moose Mountain Technical Services, acting as an independent qualified person under NI 43-101 standards. A full technical report is due to be filed within 45 days of the announcement. For further context on the announcement, the full resource update has been covered in detail by industry analysts.
What are the cut-off grades used in the 2026 estimate?
The estimate applies a net smelter return cut-off of CAD$30 per tonne for open-pit resources and CAD$80 per tonne for underground resources, based on metal price assumptions of US$4.60/lb copper, US$3,300/oz gold, and US$40/oz silver.
What is the planned production rate and mine life at Minto?
The updated PEA is targeting a mine life of 12 to 15 years at a throughput rate of 4,100 tonnes per day, utilising the existing on-site processing plant. A feasibility study is scheduled to begin in Q3 2026. The first Minto economics since 2021 have attracted considerable interest from analysts monitoring the project's restart potential.
Is Phase 2 drilling included in the 2026 resource estimate?
No. The Phase 2 programme (50,000 metres total, 75% complete at the time of announcement) is not incorporated into the 2026 MRE. Results from this programme are expected to inform future resource updates and will be required to support the feasibility study's resource confidence thresholds.
Key Takeaways: Selkirk Copper Minto Resource Estimate Summary
-
280% growth in measured and indicated tonnage to 47.8 Mt, one of the largest single-update expansions in recent Yukon copper project history
-
Dual-pathway resource: underground at 1.14% copper and open-pit at 0.59% copper provide operational flexibility across different commodity price environments
-
Four growth zones: Minto North, Minto Main, Area 118, and Ridgetop each carry distinct grade profiles and geometry characteristics, with Minto North delivering the highest grades at 1.39% copper, 0.75 g/t gold, and 6.57 g/t silver
-
Phase 2 upside: 37,000 metres of additional drilling remain unincorporated into the current resource model, representing unquantified future optionality
-
Development timeline: updated PEA underway, feasibility study targeted for Q3 2026 commencement
-
Brownfield advantage: existing 4,100 tpd plant and 400-person camp reduce capital intensity of mine restart versus greenfield alternatives
-
Growth attribution: approximately half from drilling success, half from revised economic assumptions, a distinction material to how investors should weight the expansion
Readers seeking additional context on NI 43-101 mineral resource classification standards and their application to Canadian mining projects may find the CIM Definition Standards documentation and related technical guidance from the Canadian Institute of Mining, Metallurgy and Petroleum to be useful reference material.
Ready to Position Yourself Ahead of the Next Major Copper Discovery?
Discovery Alert's proprietary Discovery IQ model scans ASX announcements in real time, instantly identifying significant mineral discoveries across copper and 30+ other commodities — translating complex geological data into clear, actionable opportunities for investors at every level. Explore how major mineral discoveries have historically generated substantial returns on Discovery Alert's dedicated discoveries page, then begin your 14-day free trial to ensure you're never late to the next transformative resource update.