July 14, 2026
The Structural Forces Rewriting the Commodity Playbook in 2026
Commodity markets have always moved in cycles, but occasionally those cycles are interrupted by something deeper: a structural reset driven by forces that do not reverse when prices rise or sentiment shifts. The current moment in copper and gold markets has characteristics that distinguish it from a typical mid-cycle correction or demand surge. The copper supply deficit and gold outlook entering 2026 are shaped by a convergence of geological constraints, capital allocation failures, geopolitical realignments, and technology-driven demand that compound rather than offset each other.
Understanding why this moment is different from prior resource booms requires looking past the headlines and into the mechanics of how these markets actually function, where the real risks sit, and what institutional forecasters are both agreeing and disagreeing on.
When big ASX news breaks, our subscribers know first
What Is Actually Driving the Copper Supply Deficit in 2026?
The Supply Side Has Broken Down
The core issue in copper is not a sudden demand explosion. It is a supply system that has been running on fumes for years and is now visibly failing to keep pace. During the period of low copper prices between roughly 2012 and 2020, mining companies sharply curtailed exploration and greenfield development spending. The projects that were not funded a decade ago are the projects that cannot produce copper today, because a typical copper mine takes anywhere from 10 to 20 years from discovery to first production.
This pipeline vacuum is now manifesting in real output shortfalls at some of the world's most significant producing assets. The copper supply crunch is evident across multiple major operations:
- Grasberg (Indonesia): One of the world's largest copper and gold mines has experienced an estimated output reduction of approximately 350,000 tonnes, with full capacity restoration not expected until 2028 at the earliest. The transition from open-pit to underground block-cave mining at Grasberg has proven more operationally complex than initially modelled.
- Kamoa-Kakula (DRC): Widely heralded as the most significant new copper discovery in decades, this Congolese operation has faced throughput constraints that are expected to limit output below nameplate capacity through 2027-2028.
Adding a dimension that receives less attention than mine disruptions is the supply chain pressure created by China's suspension of sulfuric acid exports. Sulfuric acid is a critical reagent in the hydrometallurgical processing of oxide copper ores. Its reduced availability tightens refinery-level throughput independently of what is actually being extracted from the ground, creating a processing bottleneck that compounds the raw production shortfall.
Why Demand Is Not the Culprit, But Is Not Helping
A critical distinction for investors to understand: the copper supply deficit and gold outlook forming in 2026 is primarily a supply-side structural failure, not a demand-driven squeeze. However, multiple independent demand vectors are preventing the market from self-correcting through price-induced demand destruction:
- Artificial intelligence data centre buildout is requiring copper-intensive power infrastructure at a scale that was not anticipated even three years ago
- Grid-scale electrification programs and EV charging network deployment are consuming copper at rates that grow with every policy commitment to decarbonisation
- Renewable energy installations consume 3 to 5 times more copper per megawatt than conventional thermal generation, meaning every wind turbine or solar farm installed tilts the supply-demand balance further
"When a supply system collapses and demand simultaneously accelerates from multiple structurally unrelated sources, the resulting deficit cannot self-correct quickly. It requires years of capital deployment, permitting, and construction before new supply reaches the market."
How Large Is the Copper Deficit? Mapping the Institutional Forecasts
The honest answer is that institutional forecasters disagree significantly on the magnitude of the deficit, which itself is important information for investors. The range of views currently in circulation spans from a meaningful surplus to a historically unprecedented shortfall.
| Institution | 2026 Deficit / Surplus Forecast | Price Target |
|---|---|---|
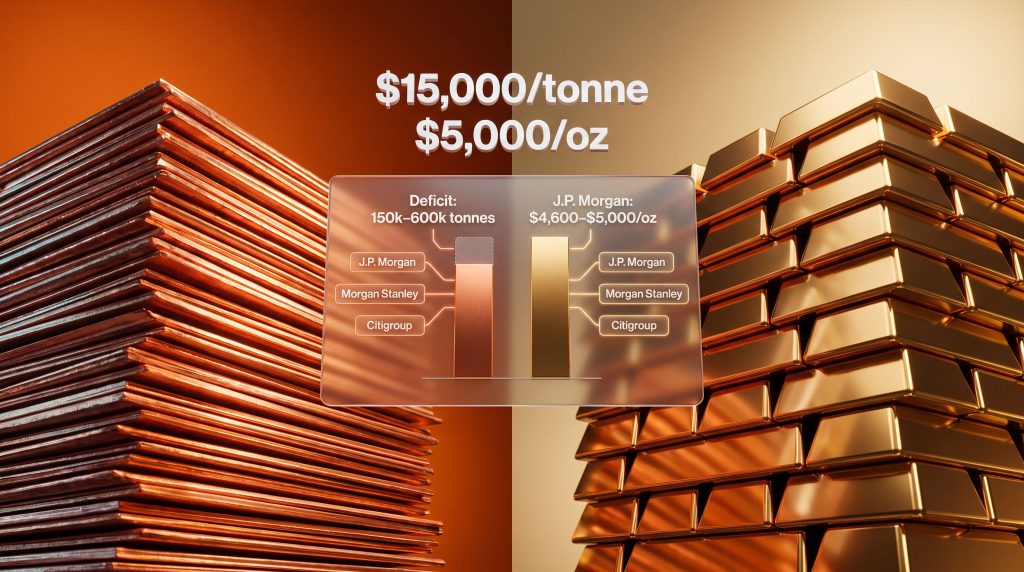
| J.P. Morgan | 330,000-tonne deficit | $12,000/tonne (Q1 2026) |
| Morgan Stanley | 600,000-tonne deficit (largest in 20+ years) | Bullish |
| Citigroup | Deficit scenario | $13,000-$15,000/tonne |
| S&P Global | Deficit | ~$12,100/tonne average |
| ICSG | 150,000-tonne deficit (revised from prior surplus forecast) | N/A |
| Goldman Sachs | 160,000-tonne surplus | Capped near $11,000/tonne |
Why Goldman Sachs Disagrees, and Why That Matters
Goldman Sachs occupies the contrarian position in this debate, forecasting a surplus rather than a deficit. Their view rests on the assumption that global supply, including contributions from newer projects and smelter capacity in China and elsewhere, will remain sufficient to prevent acute physical shortages in the near term. Furthermore, as Goldman Sachs has noted, even their more conservative stance acknowledges that supply risks are tilted to the downside.
The divergence between Goldman and the institutional consensus is not a minor rounding difference. It represents a $2,000 to $4,000 per tonne range in potential price outcomes, which translates directly into dramatically different return profiles for copper-exposed equities and futures positions. Before positioning around the copper supply deficit narrative, investors should examine which supply assumptions underpin each forecast rather than simply averaging the views.
The Long-Term Scarcity Horizon
Looking beyond 2026, the cumulative arithmetic of the copper deficit becomes the more compelling story. Projections from multiple analytical frameworks suggest cumulative shortfalls reaching approximately 3 million tonnes by 2036, and under a scenario where capital deployment into new projects remains constrained, the figure could approach 10 million tonnes by 2040.
These numbers reframe the investment thesis. Copper at these scales of structural scarcity begins to behave less like an industrial metal tracking global GDP growth and more like a strategic resource with limited near-term substitutability, a characteristic historically reserved for precious metals. In addition, those exploring copper investment strategies should carefully consider these long-term scarcity dynamics when constructing their positions.
The Gold Outlook for 2026: Three Structural Pillars
While copper's bull case is contested, gold's structural drivers entering 2026 are more broadly agreed upon across institutional analysts, even if the exact price trajectory involves uncertainty. The gold market outlook for this period rests on three distinct but reinforcing pillars.
Pillar 1: Central Bank Accumulation as a Price Floor
The shift in central bank behaviour toward gold is perhaps the single most underappreciated structural development in commodity markets over the past five years. Central banks globally transitioned from being consistent net sellers of gold reserves through the 1990s and 2000s to becoming reliable net buyers, a shift driven by the desire to diversify reserve holdings away from USD-denominated assets.
This demand is not price-sensitive in the conventional sense. Central bank gold demand is driven by reserve policy, geopolitical calculation, and long-term portfolio mandates rather than near-term price signals. The result is a persistent demand floor that limits downside even during periods when equity markets rally and traditional safe-haven demand would otherwise retreat.
Pillar 2: Geopolitical Risk Premium That Is Structural, Not Cyclical
The geopolitical landscape has shifted in ways that elevate gold's risk premium on a sustained basis rather than episodically. Trade fragmentation, regional conflicts, evolving sanctions regimes, and tensions in critical maritime chokepoints such as the Strait of Hormuz all contribute to a background level of uncertainty that keeps institutional and sovereign demand for gold elevated.
This is not the same as the short-term spikes in gold demand seen during discrete geopolitical events. It is a baseline repricing of risk that shows up in gold's floor price rather than its peak price.
Pillar 3: Mine-Level Supply Constraints
Global mined gold production reached a record 3,672 tonnes in 2025, yet total demand across physical, investment, and central bank channels continued to outpace that supply figure. The supply deficit in gold is less prominently discussed than copper's because gold has a large above-ground stock and a well-developed recycling market, but the mine-level shortfall is real and provides structural price support over multi-year time horizons.
Gold Price Targets: What Institutions Are Forecasting
| Institution | 2026 Gold Price Forecast |
|---|---|
| J.P. Morgan | $4,600-$4,700/oz average; $5,000/oz year-end target |
A year-end target of $5,000 per ounce would represent a significant milestone for gold as an asset class, effectively confirming its transition from a purely defensive safe-haven into a structural wealth preservation vehicle commanding a permanent premium in institutional portfolios.
Copper vs. Gold: Structural Similarities and Key Divergences
A growing thesis among commodity strategists is that copper may be entering a phase where its valuation dynamics begin to partially mirror those of precious metals, driven by scarcity characteristics rather than purely by industrial demand cycles. If copper reaches the $13,000 to $15,000 per tonne range projected by the most bullish institutional forecasters, it would represent a valuation re-rating with few precedents in modern commodity history.
However, the two markets diverge in critical ways that investors should not overlook:
| Dimension | Copper | Gold |
|---|---|---|
| Market Balance | Deficit of 150,000-600,000 tonnes | Structural deficit against record supply |
| Primary Demand Driver | Electrification, AI infrastructure, renewables | Central bank buying, geopolitical risk premium |
| Primary Supply Risk | Mine disruptions, decade-long pipeline vacuum | Record production still insufficient to meet total demand |
| Price Outlook | $12,000-$15,000/tonne (bull case) | $4,600-$5,000/oz |
| Key Bear Risk | Goldman surplus scenario, China economic slowdown | Near-term volatility during risk-on equity rallies |
| Investment Classification | Industrial asset transitioning toward scarcity narrative | Established strategic hedge and reserve asset |
Gold's price floor is anchored by non-economic demand from central banks and sovereign wealth funds. Copper's floor remains purely industrial, making it meaningfully more exposed to Chinese economic conditions. A sustained contraction in Chinese manufacturing activity or a continued correction in the property sector would materially alter the copper deficit calculus in ways that would leave gold largely unaffected.
How Should Investors Think About Portfolio Positioning?
The Case for Copper Exposure
The asymmetric risk-reward profile of copper in a confirmed deficit environment is compelling, but entry point and investment vehicle selection matter enormously. ASX-listed major resource producers with diversified copper exposure, such as BHP and Rio Tinto, provide access to the copper supply deficit and gold outlook theme with balance sheet depth and diversification that pure-play copper developers cannot offer.
Pure-play copper developers carry higher upside potential in a $15,000 per tonne scenario but require careful assessment of project timelines against the 2028 supply recovery horizon. A project that reaches production after the deficit has partially resolved due to new supply entering the market faces a very different price environment than the current forecasts suggest. J.P. Morgan's copper outlook provides further context on how these dynamics may evolve.
Gold as a Core Allocation
At J.P. Morgan's forecast range of $4,600 to $5,000 per ounce, gold exposure is no longer a speculative overlay position. It represents a core allocation for risk-managed portfolios seeking both wealth preservation and commodity cycle participation. ASX gold producers within the Top 200, including Northern Star Resources and Evolution Mining, are generating substantial free cash flow at current price levels, making the equity story as much about capital returns and balance sheet strength as commodity price upside.
The Genesis-Vault merger creating a $12.6 billion combined ASX gold producer signals that consolidation is accelerating as majors compete for scale and resource inventory. This M&A dynamic typically precedes the phase of a commodity cycle where equity valuation premiums expand alongside rising commodity prices.
Secondary Commodity Opportunities
Beyond copper and gold, three commodity themes warrant attention:
- Uranium: Structural supply constraints mirror copper's trajectory, with reactor restart programs in Japan and Europe creating demand that spot markets are struggling to satisfy. The uranium market trends reveal a divergence between long-term contract pricing and spot prices that represents a dislocation worth monitoring for entry opportunities.
- Rare Earths: Chinese export control mechanisms on rare earth elements are elevating strategic value independently of near-term demand fundamentals. Western procurement programs are creating a price support dynamic not present in purely market-driven commodities.
- Lithium: The lithium market remains oversupplied following the 2022-2023 demand surge and subsequent price collapse. Recovery timing is dependent on EV adoption rates in key markets and whether marginal cost producers exit in sufficient numbers to restore supply-demand balance. This is a longer-term recovery story requiring patience.
The next major ASX story will hit our subscribers first
Where the Consensus May Be Getting Ahead of Itself
Commodity markets have a well-documented tendency to price in structural deficits before those deficits fully materialise in the physical market. Investors who entered lithium and nickel at peak sentiment in 2022 experienced severe drawdowns as supply caught up faster than the bull case assumed and Chinese demand disappointed expectations.
Several risks deserve more weight than the current consensus narrative assigns them:
- China demand risk: The copper bull case is structurally credible but operationally dependent on Chinese industrial activity. Any sustained manufacturing slowdown changes the deficit arithmetic materially.
- Project acceleration risk: Elevated copper prices attract capital. If new projects advance faster than the current pipeline vacuum implies, the 2028 supply recovery could arrive earlier than the deficit narrative anticipates.
- Sentiment overshoot: The gap between the most bullish institutional price forecast ($15,000 per tonne) and Goldman's bear case ($11,000 per tonne) represents a 36% price range. That is not consensus. It is uncertainty with a bullish bias, which is a different thing entirely.
- Currency effects: A strengthening US dollar, independent of physical supply-demand dynamics, historically suppresses commodity prices denominated in dollars and can override fundamental signals for extended periods.
"Investors who treat the copper supply deficit as an investment certainty rather than a high-conviction probability are misreading both the institutional disagreement and the historical pattern of commodity sentiment cycles."
Frequently Asked Questions: Copper Supply Deficit and Gold Outlook
What is causing the copper supply deficit in 2026?
The deficit stems from a supply-side structural failure built over more than a decade of underinvestment in greenfield mine development. Operational disruptions at major producing assets, processing input constraints, and the extended timeline required to bring new mines into production have combined to create a shortfall that demand from electrification, AI infrastructure, and renewable energy is preventing from self-correcting.
How large is the projected copper deficit in 2026?
Institutional estimates range from 150,000 tonnes per the ICSG's revised forecast to 600,000 tonnes per Morgan Stanley's projection, with J.P. Morgan forecasting 330,000 tonnes. Goldman Sachs holds the contrarian view of a 160,000-tonne surplus. The range itself is informative about the degree of uncertainty in current supply-demand modelling.
What is the gold price outlook for 2026?
J.P. Morgan forecasts gold averaging $4,600 to $4,700 per ounce through 2026, with a year-end target of $5,000 per ounce, supported by persistent central bank buying, elevated geopolitical risk premiums, and a structural supply gap at the mine level.
Is copper becoming more like a precious metal?
Some analysts argue that copper's deepening scarcity profile, with cumulative deficits potentially reaching 10 million tonnes by 2040, is causing a gradual re-rating toward strategic scarcity asset status. However, copper remains fundamentally an industrial metal with significant exposure to economic cycle risk, particularly from China, making direct comparisons to gold's investment dynamics premature.
Which commodities offer the strongest longer-term opportunity?
Uranium presents a structurally similar supply deficit narrative to copper with growing demand from reactor restart programs. Rare earths are gaining strategic value from geopolitical supply chain concerns. Lithium represents a longer-term recovery opportunity pending demand-supply rebalancing over the next several years.
This article is intended for informational and educational purposes only and does not constitute financial or investment advice. Readers should conduct their own research and consult a qualified financial adviser before making any investment decisions. Forecasts and price targets referenced are from third-party institutional sources and are subject to change. Past commodity market dynamics are not necessarily indicative of future outcomes.
Want to Identify the Next Major ASX Mineral Discovery Before the Broader Market?
Discovery Alert's proprietary Discovery IQ model delivers real-time alerts on significant ASX mineral discoveries — instantly translating complex geological and market data into actionable insights across copper, gold, uranium, and beyond — so subscribers can position themselves ahead of the crowd. Explore Discovery Alert's dedicated discoveries page to see how historic mineral discoveries have generated substantial returns, and begin your 14-day free trial today to secure your market-leading edge.