July 14, 2026
The Geopolitics of Barrels: Why America's Oil Lead Is Structural, Not Cyclical
Every decade or so, global energy markets experience a shift so profound that the entire competitive landscape reorganises around it. The shale revolution was one of those moments. But unlike the oil shocks of the 1970s or the price collapses of the 1980s, which were largely temporary dislocations, the transformation of American oil output since 2008 represents something more durable: a fundamental rewiring of who controls global supply, at what cost, and with what geopolitical consequences.
Understanding why America extends its lead over Russia and Saudi Arabia in oil output requires moving beyond production rankings and into the underlying architecture of how these three systems actually work. Furthermore, the differences between these systems are structural, not cosmetic, and the oil price movements that result from this imbalance are reshaping global markets in real time.
When big ASX news breaks, our subscribers know first
The Numbers Behind the New Global Supply Hierarchy
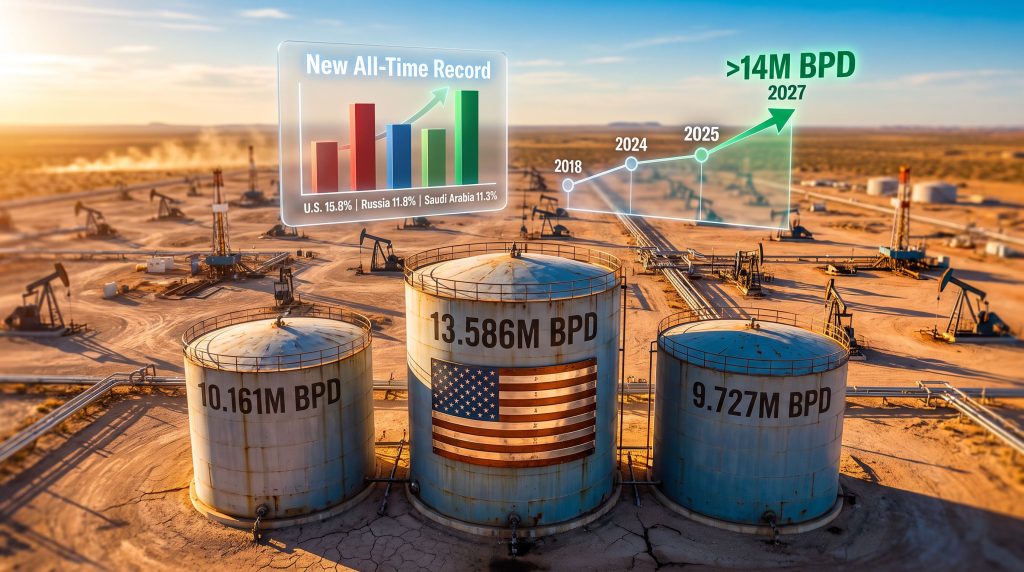
The headline figures from 2025 are striking on their own. According to data published by the U.S. Energy Information Administration and the Energy Institute's Statistical Review of World Energy 2026, U.S. crude oil and condensate production averaged 13.586 million barrels per day (bpd) last year, a 2.7% increase from 2024 and a new all-time global production record. That shattered the previous U.S. record of 13.2 million bpd set just a year earlier.
"The United States accounted for 15.8% of total global crude oil and condensate production in 2025, according to the Energy Institute's Statistical Review of World Energy 2026, making it not just the largest producer but the most consequential single supplier in the history of modern petroleum markets."
Russia and Saudi Arabia, the two closest rivals, were not even within striking distance:
| Metric | United States | Russia | Saudi Arabia |
|---|---|---|---|
| Crude Oil & Condensate (2025 avg.) | 13.586 million bpd | 10.161 million bpd | 9.727 million bpd |
| Global Share | 15.8% | 11.8% | 11.3% |
| Year-on-Year Change | +2.7% | -0.6% | +5.7% |
| U.S. Lead (million bpd) | — | ~3.4 million | ~3.9 million |
| Estimated Total Liquids (incl. NGLs) | ~22–24 million bpd | ~11–12 million bpd | ~11–12 million bpd |
Sources: EIA International Energy Statistics; Energy Institute Statistical Review of World Energy 2026
When natural gas liquids and other petroleum products are included, the gap widens dramatically. The United States produces an estimated 22 to 24 million bpd of total petroleum liquids, a figure that is effectively double the output of either Russia or Saudi Arabia on the same metric. This distinction matters because different measurement methodologies produce very different hierarchies, and the U.S. advantage expands at every level of the accounting.
How Shale Technology Permanently Changed the Production Equation
Tracing why America extends its lead over Russia and Saudi Arabia in oil output requires going back to one of the most underappreciated turning points in energy history: the reversal of the long U.S. production decline around 2008. After decades of falling output following the 1970 peak, American crude production began a sustained climb driven by a combination of horizontal drilling, hydraulic fracturing, and multi-well pad drilling technologies.
These were not incremental improvements. They fundamentally altered the economics of oil extraction by transforming previously uneconomic tight rock formations into commercially productive reservoirs at scale. For a deeper look at U.S. oil production trends and the forces shaping them, the historical context is essential.
The Shale Revolution: A Timeline of Structural Milestones
-
~2008 — U.S. domestic crude production begins reversing a multi-decade decline as shale technology achieves commercial viability at scale.
-
2018 — The United States surpasses Russia to claim the top position in global crude oil production, marking the culmination of the shale boom. According to Forbes, this represented a seismic shift in the global energy landscape.
-
2024 — A then-record production level of 13.2 million bpd is established, setting the stage for further growth.
-
2025 — A new all-time global production record of 13.586 million bpd is set; the U.S. captures 15.8% of global crude output.
-
2026 (EIA Forecast, July 9) — Production projected to remain near 13.7 million bpd, supported by continued Permian Basin growth and elevated prices.
-
2027 (EIA Forecast) — Output projected to exceed 14 million bpd for the first time in history.
A crucial and often overlooked dimension of U.S. shale is the concept of the production treadmill. Unlike conventional oilfields, which can sustain output for years or decades from existing wells with relatively modest reinvestment, shale wells typically decline 60 to 80 percent in their first year of production. This means that maintaining flat output requires continuous drilling activity, and growing output requires an accelerating pace of new well completions.
The fact that U.S. production grew by 2.7% in 2025 despite WTI averaging just $65 per barrel signals a meaningful structural reduction in breakeven costs across major shale plays.
"The productivity treadmill that characterises shale is simultaneously its greatest vulnerability and its most impressive achievement. The industry has managed to run faster on that treadmill each year, even as oil prices remained subdued."
The Permian Basin: A Nation Within a Nation's Oil System
No analysis of U.S. production dominance is complete without examining the Permian Basin of West Texas and southeastern New Mexico. This single geological formation produced approximately 6.6 million bpd in 2025, representing roughly 48% of all U.S. crude output, according to EIA data. To place that in context, the Permian alone outproduces many individual OPEC member nations.
Why the Permian Keeps Defying Expectations
Several compounding factors explain the Permian's extraordinary productivity trajectory:
-
Extended laterals: Operators have progressively increased the horizontal reach of individual wellbores, extracting more rock contact and more hydrocarbons per well.
-
Stacked pay zones: The Permian contains multiple productive formations layered vertically, including the Spraberry, Wolfcamp, Bone Spring, and Delaware Basin intervals, allowing multiple wells to be drilled from a single surface pad into distinct reservoir targets.
-
Infrastructure density: Decades of cumulative investment in pipelines, gathering systems, processing facilities, and export terminals have driven per-barrel logistics costs to levels that are extremely difficult for greenfield basins to replicate.
-
Operational efficiency compounding: Each generation of wells is drilled faster, completed more effectively, and produces at higher initial rates than the generation before it.
The Permian grew output by 4% in 2025 even as WTI prices averaged a relatively modest $65 per barrel. This is a critical data point for understanding the structural durability of U.S. production dominance. Earlier in the shale era, sustained growth at these price levels would have been considered unlikely.
Price Resilience in Context: The Permian Basin's ability to grow at $65/bbl WTI challenges the assumption held by many market participants that shale requires $70 to $80 oil to sustain expansion. Capital efficiency gains have moved the goalposts significantly, and this has direct implications for OPEC's market influence and its ability to manage global prices through supply discipline.
Why Russia and Saudi Arabia Are Falling Further Behind
The widening production gap is not solely a story of American success. It is equally a story of divergent constraints on the two nations that once competed most closely with U.S. output.
Russia: Infrastructure Attrition and the Compounding Cost of War
Russian crude oil and condensate production averaged 10.161 million bpd in 2025, representing a 0.6% annual decline compared to 2024, according to the Energy Institute. This may appear modest, but the directional trend is increasingly negative, and the International Energy Agency has revised Russia's production forecasts downward as Ukrainian drone and missile strikes on energy infrastructure have progressively degraded refining capacity and upstream operations.
The compounding effects are significant. Russia's decision to ban diesel exports amid heavy damage to its refinery network illustrates how infrastructure degradation cascades through the entire petroleum value chain. Production constraints at the wellhead, combined with export disruption from sanctions and physical attacks on tankers, create a structural ceiling on Russian output that will be difficult to reverse even if hostilities ceased tomorrow.
Saudi Arabia: Deliberate Restraint, Not Geological Limitation
Saudi Arabia's situation is fundamentally different in character, though the output gap from the U.S. is similarly wide. Saudi crude production averaged 9.727 million bpd in 2025, a 5.7% annual increase as OPEC+ began unwinding voluntary production cuts. Despite this recovery, Saudi output remained below Russia's and well below American levels.
The critical insight here is that Saudi Arabia's production gap relative to the U.S. is not a geological constraint. Saudi Arabia possesses vast proven reserves and the technical capacity to produce significantly more. The constraint is strategic: the kingdom operates within an OPEC+ quota architecture designed to balance market share considerations against price support objectives.
This creates a structural dilemma that becomes more acute as U.S. output climbs. Every additional barrel of American production that reaches the global market absorbs demand that would otherwise support OPEC+ pricing power. Saudi Arabia consequently faces a binary choice between cutting further to defend prices while ceding market share, or increasing output to reclaim market share while accepting lower prices.
| Factor | Russia | Saudi Arabia |
|---|---|---|
| Primary Output Constraint | Infrastructure damage from conflict | OPEC+ voluntary quota architecture |
| 2025 Production Change | -0.6% YoY | +5.7% YoY |
| Structural Production Ceiling | Declining near-term | Expandable but quota-dependent |
| Export Disruption Risk | High (sanctions + infrastructure attacks) | Moderate (Strait of Hormuz proximity) |
The Strait of Hormuz Crisis: A Geopolitical Dividend for U.S. Exporters
The geopolitical turbulence surrounding the Strait of Hormuz in 2026 produced an unexpected but logical consequence: a surge in global demand for American crude and petroleum products precisely because U.S. supply chains route entirely outside that chokepoint.
According to EIA data, U.S. petroleum exports jumped 15% in April 2026 compared to March, which had itself established a prior record. Crude oil exports specifically averaged 5.6 million bpd in April, representing a 21% premium above the previous record set in December 2023. By May 2026, the United States had effectively become the world's top oil exporter at approximately 10.5 million bpd, compared to Russia at approximately 7 million bpd and Saudi Arabia at approximately 5.9 million bpd.
"When Middle Eastern supply routes face physical or geopolitical disruption, American barrels fill the gap. This is not a coincidence but a structural feature of the global oil system that becomes more pronounced with each increment of U.S. export capacity expansion."
This dynamic adds a second dimension to U.S. energy power that extends well beyond production volumes. The combination of record output, diversified export infrastructure, and geographic insulation from Middle Eastern chokepoints positions American petroleum as the world's most reliable swing supply source during periods of regional instability.
The next major ASX story will hit our subscribers first
The 2026–2027 Production Outlook and Its Strategic Implications
U.S. Production Forecast Scenarios
| Scenario | 2026 Projection | 2027 Projection | Key Driver |
|---|---|---|---|
| Base Case (EIA, July 2026) | ~13.7 million bpd | >14 million bpd | Permian growth + elevated prices |
| Upside Case | ~14.0–14.2 million bpd | ~14.5 million bpd | Hormuz premium sustains drilling |
| Downside Case | ~13.4–13.5 million bpd | ~13.8 million bpd | Price collapse, rig count reduction |
A U.S. production trajectory toward 14 million bpd and beyond has profound implications for OPEC+'s market management capacity. Every incremental barrel of U.S. growth effectively narrows the space within which OPEC+ can influence global price levels. This is not a theoretical concern but an observable market dynamic that has already reshaped how Saudi Arabia and its partners approach production decisions.
Furthermore, the WTI and Brent futures markets reflect these dynamics in real time, pricing in both the structural growth of American supply and the geopolitical risk premium associated with Middle Eastern disruptions.
The speculative dimension worth considering is whether the Hormuz crisis could accelerate U.S. export infrastructure investment to the point where a permanent structural rebalancing of global supply flows occurs. If Asian buyers develop durable commercial relationships with American suppliers during the disruption period, the demand recovery for OPEC+ barrels when the crisis resolves may be structurally weaker than historical precedent would suggest.
Is U.S. Dominance Structurally Permanent or Cyclically Vulnerable?
Balanced analysis requires acknowledging both sides of this question.
Arguments Supporting Structural Permanence
-
Shale technology continues improving, with breakeven costs declining across major basins despite inflation in drilling services.
-
The Permian Basin's stacked pay zones represent decades of remaining productive inventory that has not yet been fully delineated.
-
U.S. export infrastructure, including deepwater crude terminals and LNG liquefaction capacity, continues to expand and locks in long-term commercial relationships with international buyers.
-
American barrels carry a geopolitical reliability premium in periods of Middle Eastern instability that no OPEC+ producer can replicate.
Arguments Highlighting Cyclical Vulnerability
-
A sustained WTI price collapse below approximately $50 per barrel could trigger meaningful rig count reductions and production plateaus, given that even an efficient shale treadmill has a price floor.
-
Regulatory shifts under future administrations could constrain drilling activity on federal lands, which represent a meaningful share of overall output.
-
Capital discipline among U.S. exploration and production companies has become more pronounced since 2020, with investors rewarding cash returns over volume growth, which could limit the pace of expansion even in favourable price environments.
-
The steep initial decline rates inherent in shale wells mean that any sustained reduction in drilling activity translates quickly into falling production, with limited lead time for course correction.
In addition, the broader context of trade war oil prices adds another layer of uncertainty, as demand-side shocks from geopolitical trade disputes can undermine the price conditions necessary to sustain aggressive drilling programmes.
Frequently Asked Questions: U.S. Oil Production Dominance
How Much Oil Does the United States Produce Per Day?
The U.S. produced an average of 13.586 million bpd of crude oil and condensate in 2025, a new all-time global production record. When natural gas liquids and other petroleum products are included, total U.S. liquids output reaches an estimated 22 to 24 million bpd.
When Did the U.S. First Become the World's Largest Oil Producer?
The United States surpassed Russia to claim the top position in global crude oil production in 2018, marking the culmination of the shale revolution. It has retained that position every year since, extending its lead substantially by 2025.
How Does U.S. Oil Production Compare to Russia and Saudi Arabia?
In 2025, U.S. crude output was approximately 40% higher than either Russia at 10.161 million bpd or Saudi Arabia at 9.727 million bpd. The U.S. accounted for 15.8% of global crude production, compared to Russia's 11.8% and Saudi Arabia's 11.3%.
What Is the Permian Basin's Role in U.S. Oil Production?
The Permian Basin produced approximately 6.6 million bpd in 2025, representing roughly 48% of total U.S. crude output. It grew 4% year-over-year despite WTI prices averaging just $65 per barrel, demonstrating meaningful breakeven cost improvements.
Will the U.S. Reach 14 Million bpd in Oil Production?
According to the EIA's July 2026 forecast, U.S. crude oil production is expected to remain near 13.7 million bpd in 2026 before exceeding 14 million bpd in 2027, supported by continued Permian growth and elevated prices associated with Middle East supply disruptions.
How Has the Strait of Hormuz Crisis Affected U.S. Oil Exports?
U.S. crude oil exports averaged 5.6 million bpd in April 2026, a 21% increase above the previous record set in December 2023. Total petroleum exports rose 15% month-over-month as global buyers redirected demand toward American barrels.
Key Takeaways: The Strategic Architecture of American Oil Power
-
The U.S. production advantage over Russia and Saudi Arabia reflects a fundamentally different production system built on technology-driven shale development, not simply favourable geology or temporary market conditions.
-
The Permian Basin alone produces more crude than most individual OPEC member nations, and its productive inventory spans decades.
-
Geopolitical disruptions affecting rival producers consistently amplify the U.S. competitive advantage, transforming crises elsewhere into export opportunities for American producers.
-
The trajectory toward 14 million bpd by 2027 would further entrench America extends its lead over Russia and Saudi Arabia in oil output, and materially constrain OPEC+'s pricing leverage in global markets.
-
U.S. export market share expansion represents a second dimension of energy power that extends well beyond production volumes, reshaping commercial relationships between American suppliers and international buyers in ways that may prove durable beyond the current crisis period.
Disclaimer: This article contains forward-looking statements, production forecasts, and scenario projections that are inherently speculative. EIA forecasts and third-party estimates are subject to revision based on market conditions, geopolitical developments, and regulatory changes. Nothing in this article constitutes investment advice. Readers should consult qualified financial professionals before making investment decisions related to energy markets or commodity-exposed securities.
Want to Capitalise on the Next Major Commodity Discovery Before the Market Moves?
While geopolitical shifts reshape global oil supply hierarchies, significant mineral discoveries on the ASX can generate equally compelling opportunities — and Discovery Alert's proprietary Discovery IQ model delivers real-time alerts the moment they are announced, transforming complex commodity data into clear, actionable insights for traders and investors at every level. Explore historic examples of exceptional discovery-driven returns and begin your 14-day free trial today to position yourself ahead of the broader market.