June 24, 2026
Why Independent Research Has Always Separated Profitable Investors From the Rest
In commodity markets, the quality of information you access rarely matches the confidence with which that information is delivered. Precious metals in particular attract an outsized volume of commentary, much of it shaped by promotional incentives rather than empirical data. Silver, more than almost any other commodity, has historically been a magnet for narratives that sound compelling but collapse under scrutiny. Understanding why that happens, and how a small number of research institutions have consistently avoided it, reveals something important about how commodity cycles actually work.
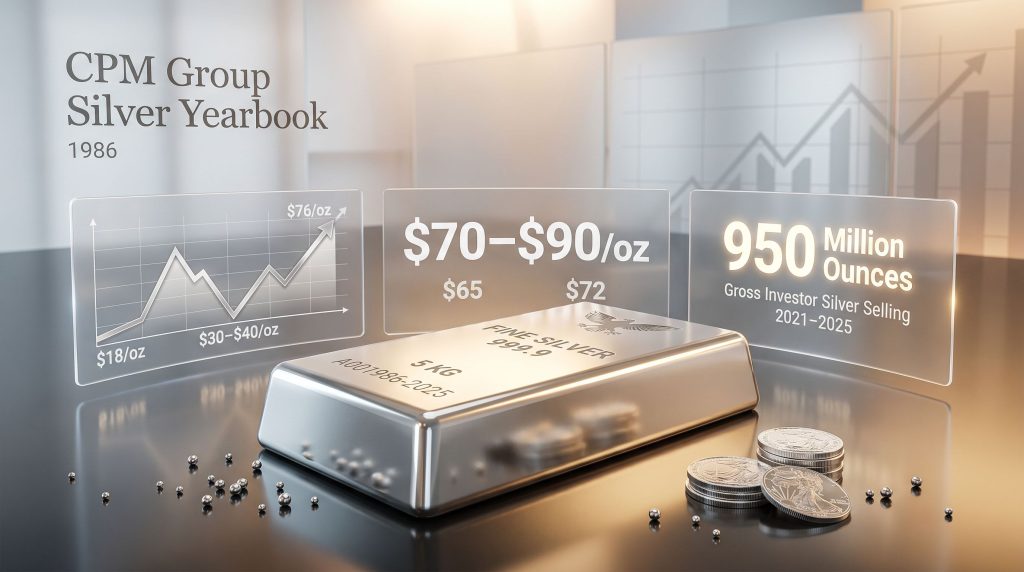
The CPM Group silver yearbook sits at the centre of this distinction. It is not simply an annual data compilation. It represents the continuation of a research programme that predates most modern precious metals commentary by several decades, rooted in institutional analysis that began before systematic silver market reporting was common practice.
When big ASX news breaks, our subscribers know first
Five Decades of Institutional Research: Where the CPM Group Silver Yearbook Comes From
From J. Aron and Company to an Independent Research Institution
The research lineage behind the CPM Group silver yearbook traces back to the late 1960s and early 1970s, when systematic silver market analysis was conducted at J. Aron and Company, a major commodities trading house that was later acquired by Goldman Sachs. The first major structured silver review and outlook report produced within that institutional framework appeared in December 1980, marking a significant milestone in formalised precious metals research.
In 1986, on May 30th, CPM Group was officially established as an independent commodities research and consulting firm, spun out of what had by then become Goldman Sachs's commodities research department. The founding premise was straightforward: provide honest, independent analysis free from the promotional pressures that distort so much commodity market commentary.
The 2026 Silver Yearbook marks 40 years of CPM Group's independent operation. When measured against most modern precious metals commentary, which rarely extends beyond a decade of institutional history, this research lineage represents a genuinely unusual depth of market perspective, spanning multiple commodity supercycles, financial crises, currency regime changes, and structural demand shifts.
Why Research Continuity Creates Analytical Advantages
Unbroken longitudinal datasets carry compounding value in commodity analysis. When a research institution has tracked silver supply, demand, and price behaviour across five decades, it builds pattern recognition that simply cannot be replicated by organisations working from five or ten years of data. Multi-decade tracking also eliminates much of the short-term analytical bias that distorts newer research, where recent price moves tend to dominate narrative construction.
There is also a critical distinction worth understanding: independent research and marketing-driven commodity reports serve fundamentally different purposes. The latter is frequently produced to support a commercial outcome, whether that is encouraging retail purchases, attracting investor flows into specific vehicles, or building a bullish narrative around a product or metal. The CPM Group silver yearbook has consistently operated outside this incentive structure, which has at times meant publishing analysis that contradicts prevailing market sentiment.
Research that tells investors what they want to hear is rarely the research that makes them money. The CPM Group's 40-year track record is built on the willingness to publish unpopular conclusions when the data supports them.
What the CPM Group Silver Yearbook Actually Covers
Core Components of the Annual Publication
The CPM Silver Yearbook is structured around empirical supply and demand analysis rather than narrative or sentiment-driven framing. Its core components include:
- Mine supply analysis: Global production trends, secondary recovery volumes, and refining activity tracked across producing regions
- Fabrication demand breakdown: Industrial applications, photovoltaic and electronics manufacturing, jewellery, and silverware consumption
- Investment demand: Bullion coin and bar activity, ETF flows, futures positioning, and both gross and net investor behaviour
- Price history and forward projections: Multi-year price modelling grounded in supply and demand equilibrium analysis rather than technical speculation
- Macroeconomic integration: How interest rate environments, inflation dynamics, currency movements, and geopolitical risk factors feed into silver price behaviour over time
How the Yearbook Compares to Competing Research
| Feature | CPM Group Silver Yearbook | Industry Marketing Reports |
|---|---|---|
| Independence from promotional interests | Fully independent | Often sponsor-funded |
| Multi-decade longitudinal data | Since late 1960s | Typically 5-10 year windows |
| Deficit/surplus claims validation | Empirically tested | Frequently overstated |
| Investor flow granularity | Gross and net basis | Usually net basis only |
| Forward price projections | Included with fundamental modelling | Varies by publisher |
| Rejection of narrative-driven frameworks | Consistent | Inconsistent |
The 2025 and 2026 Editions
The Silver Yearbook 2025 was released in May 2025 as a downloadable publication available through CPM Group's website. Furthermore, the 2026 silver market outlook followed in May 2026, continuing the annual release cycle. Both editions reflect the same foundational research methodology that has underpinned CPM Group's work since 1986.
CPM Group also publishes a complementary monthly Precious Metals Advisory covering gold, silver, platinum, palladium, and rhodium, which provides ongoing price range guidance and tactical market commentary between annual yearbook releases.
Gross vs. Net Investor Flows: The Methodological Detail That Changes Everything
Why Most Market Commentary Gets This Wrong
One of the most important but least understood distinctions in silver market analysis is the difference between gross and net investor flows. Most publicly available commentary focuses exclusively on net investor positioning, which is simply the difference between total buying and total selling. Net figures are easier to present and easier to understand, but they routinely conceal critical information about actual market dynamics.
CPM Group tracks gross investor flows, which measure the full volume of silver changing hands in both directions independently. This approach reveals selling pressure that net-only analysis makes invisible, providing a more accurate picture of where metal is actually coming from and going to within the market. For a deeper understanding of silver's dual nature as both an investment and industrial commodity, this granularity of analysis becomes particularly valuable.
Key methodological insight: Gross flow analysis can reveal that a market is experiencing heavy selling even during periods when net positioning appears stable or positive. This distinction has direct implications for price forecasting.
The 950 Million Ounce Figure That Explains Years of Market Behaviour
Between 2021 and 2025, CPM Group estimates that approximately 950 million ounces of silver were sold on a gross basis by investors. This is a figure that would be largely invisible in net-only analysis, yet it represents one of the most significant structural forces acting on the silver market across that entire period.
To put this in context: 950 million ounces represents a substantial proportion of annual global silver mine production sustained over multiple years. The existence of this supply overhang helps explain price behaviour during a period that many market commentators struggled to interpret accurately. In addition, silver supply deficits and demand drivers in 2025 add further layers to understanding this complex picture.
The 2021 Silver Episode: What It Reveals About Information Asymmetry
What the Campaign Actually Was
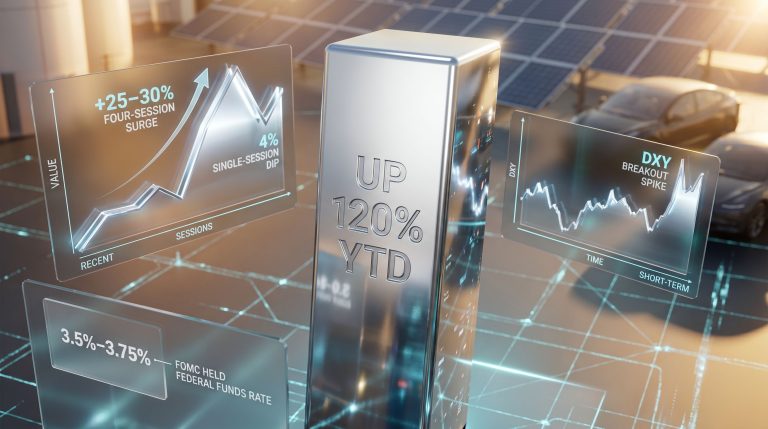
In early 2021, a coordinated social media campaign encouraged retail investors to purchase silver at scale, driving prices from approximately $18 per ounce to a range of $30 to $40 per ounce, with some individual purchases occurring near the top of that range. The campaign was built around claims about silver shortages and market manipulation that were not supported by independent empirical data.
The Price Path That Followed
| Period | Silver Price Range | Market Condition |
|---|---|---|
| Late 2020 | ~$18/oz | Pre-campaign baseline |
| Early 2021 | $30-$40/oz | Campaign-driven buying peak |
| 2022-2023 | ~$18-$24/oz | Post-campaign correction |
| 2024-2025 | $30-$76/oz | Macro-driven recovery |
The Real Cost of Narrative-Driven Investing
The silver price reaching $76 per ounce in 2025 and 2026 has been cited by some as retrospective validation of the 2021 buying campaign. CPM Group's analysis points out a critical flaw in this reasoning. An investor who purchased at $30 per ounce in early 2021 and held through the correction to $18 before eventually seeing prices recover to $76 experienced a fundamentally different financial outcome than an investor who recognised the campaign dynamics early, sold near the peak, and re-entered near $18 per ounce.
The round-trip through $18 represents a real holding cost, both financially and psychologically. The investor who used research-driven analysis to navigate both the entry and the exit captured a move from approximately $18 to $76, compared to a move from $30 to $76 for those who held throughout. That difference is not trivial. It illustrates precisely the measurable financial advantage that access to independent, data-driven research creates over narrative-driven decision-making.
An investor who bought at $30, sold near the peak when research indicated the underlying thesis was unsound, then re-entered near $18, captured roughly twice the upside of one who simply held through the cycle.
The CPM Group silver yearbook, and the firm's broader research ecosystem, exists precisely to provide this kind of analytical edge. It is not about being permanently bullish or bearish on silver. It is about understanding what the fundamentals actually support at any given time.
Silver Price Dynamics in Mid-2026: Where the Market Stands Now
Current Trading Levels and Short-Term Ranges
As of late May 2026, silver was trading near $75 to $76 per ounce on the July futures contract. CPM Group's published short-term trading range for the following three months sits between $70 and $90 per ounce, with acknowledged downside spike risks including potential moves to $72, $70, and even $65 per ounce in the near term.
These ranges are published through CPM Group's monthly Precious Metals Advisory and reflect a broad consolidation phase rather than a structural reversal in the longer-term precious metals cycle. However, understanding the gold-silver ratio alongside these ranges provides additional context for positioning decisions.
Why Precious Metals Pulled Back in Late May 2026
The late May 2026 pullback across gold, silver, platinum, and palladium reflected a collective shift in financial market sentiment rather than any fundamental deterioration in the metals themselves. Financial markets reduced their risk-aversion positioning as concerns about recessionary conditions and geopolitical disruptions temporarily moderated. Equity markets moved toward stronger highs as near-term anxiety around economic and political conditions eased.
This dynamic illustrates a principle worth understanding clearly: it is market perception of risk, not just underlying risk itself, that drives short-term precious metals pricing. Metals purchased as risk-averse assets experience selling pressure when that perceived risk temporarily recedes, even if the underlying structural factors remain unchanged.
CPM Group's view is that the current period of calm may represent a pause of several months, with political and economic pressures expected to re-intensify heading into the US midterm election cycle, potentially by September or October 2026.
The next major ASX story will hit our subscribers first
The Broader Precious Metals Complex: Gold, Platinum, and Palladium
Gold: Consolidation Between Major Technical Levels
Gold was trading near $4,565 per ounce in late May 2026, with CPM Group identifying a consolidation range between $4,400 and $4,800 to $4,900 as the base case for the June through August period. Technical analysts have identified support levels at $4,100, $3,800, and $3,400 as potential floors if downside pressure intensifies, though CPM Group has not specified these as its primary expectations. The precious metals market in 2025 provides further gold and silver context for investors monitoring these levels.
Platinum: A Market Processing Its Own History
The platinum market provides one of the more instructive case studies in the distinction between a tight physical market and a genuine structural deficit. From 2015 through mid-2024, platinum traded in a relatively contained range of approximately $800 to $1,100 per ounce. Marketing reports released around London Platinum Week in late May 2024 cited large deficits in the platinum market, prompting significant ETF investor buying that drove prices from roughly $1,000 to approximately $2,900 per ounce by January 2025.
The subsequent correction brought prices back to the $1,800 to $1,900 range, where they have largely stabilised. Notably, London Platinum Week 2026 did not produce the same surge in investor buying, suggesting the market may be collectively recalibrating its response to promotional deficit narratives.
CPM Group's long-term view on platinum is constructive, with projections extending to 2050 showing prices strengthening over the coming years. However, near-term consolidation between $1,800 and $2,200 remains the base case, with spike risks in both directions acknowledged.
Palladium: Finding Its Floor
Palladium has been finding support near $1,300 per ounce, with CPM Group's three-month range sitting between $1,300 and $1,600. Secondary support levels at $1,250 and $1,100 have been identified, with the suggestion that a spike below $1,300 could represent a short-term buying opportunity.
The Macroeconomic Backdrop Shaping Silver's Medium-Term Outlook
US GDP: A Revised Picture for Q1 2025
The US Bureau of Economic Analysis released its second estimate for Q1 2025 GDP at approximately 1.4%, revised upward from an initial estimate of around 0.4%. Consumer spending and business investment remained active contributors across the quarter. However, rising import volumes acted as a mathematical drag on the headline GDP figure, reflecting the complex interaction between trade policy and domestic output measurement.
Consumer Income vs. Consumer Spending: A Warning Signal
The divergence between disposable personal income and consumer spending is one of the more concerning signals in current US economic data. Key observations include:
- Disposable personal income contracted in three of the last seven months as of April 2025
- Real disposable personal income fell in both March and April 2025, declining 0.2% and 0.5% respectively
- Personal consumption expenditures remained elevated at approximately 2.4 to 2.5%, declining slightly from February and March but still historically high
- Consumer spending is outpacing income growth, indicating increased reliance on credit rather than genuine earnings expansion
When consumer spending rises while disposable income contracts, the underlying dynamic is debt accumulation, not wealth expansion. This pattern has historically preceded periods of consumer credit stress, not sustained economic strength.
This distinction matters for precious metals. An economy that appears strong on headline consumer spending but is increasingly credit-dependent carries different inflationary and risk characteristics than one driven by genuine income growth.
PCE Inflation and the Federal Reserve's Dilemma
The Federal Reserve places particular analytical weight on the Personal Consumption Expenditures (PCE) inflation index, which it considers a more reliable measure of inflationary trends than the Consumer Price Index alone. As of April 2025:
- Headline PCE inflation reached approximately 3.8%, continuing an upward trend
- Core PCE (excluding food and energy) reached approximately 3.2%
- Both measures remain well above the Federal Reserve's 2% target
These readings reduce the probability of near-term interest rate cuts. The upcoming Federal Open Market Committee meeting, which will be the first convened under new Federal Reserve Chair Kevin Warsh, will be closely watched for any signals about rate direction. Consequently, understanding how central banks influence gold and silver markets remains essential context for interpreting these policy signals.
There is a nuanced dimension to this environment that CPM Group identifies: higher interest rates increase the opportunity cost of holding non-yielding assets like silver, which would typically argue for downward price pressure. However, if the current inflation is structurally driven rather than demand-driven, rate increases may not function as an effective corrective tool. This creates an unusual macroeconomic environment where the standard transmission mechanism between rates and inflation may not operate predictably.
Who Should Buy the CPM Group Silver Yearbook?
Ideal Audience Profile
The CPM Group silver yearbook is designed for those who want research-grade analysis rather than promotional content. The ideal reader profile includes:
- Institutional investors and portfolio managers with direct or indirect precious metals exposure
- Mining sector analysts, corporate strategists, and exploration-stage company executives
- Commodity traders who require independent supply and demand data to underpin positioning decisions
- Serious retail investors who have moved beyond headline commentary and recognise the value of longitudinal, fundamental-driven research
CPM Group's Research Ecosystem
The Silver Yearbook sits within a broader suite of publications and advisory services:
| Publication | Frequency | Coverage |
|---|---|---|
| Silver Yearbook | Annual (May) | Global silver supply, demand, price |
| Gold Yearbook | Annual | Equivalent gold market coverage |
| Platinum Yearbook | Annual (July) | Platinum, palladium, rhodium |
| Precious Metals Advisory | Monthly | Price ranges, tactical guidance |
| Base Metals Advisory | Monthly | Six LME-traded base metals |
| Copper Supply, Demand & Price Projections | 10-year outlook (2026) | Long-range copper market modelling |
Frequently Asked Questions About the CPM Group Silver Yearbook
What Is the CPM Group Silver Yearbook?
The CPM Group silver yearbook is an annual, independently produced research publication covering the global silver market in depth. It includes analysis of mine supply, fabrication demand, investment flows, and multi-year price projections based on fundamental supply and demand modelling.
When Was the CPM Group Silver Yearbook 2026 Released?
The Silver Yearbook 2026 was released in May 2026 and is available as a downloadable publication through CPM Group's website.
How Long Has CPM Group Been Producing Silver Market Research?
CPM Group's institutional silver research lineage extends to the late 1960s and early 1970s through its predecessor organisation J. Aron and Company. CPM Group itself has operated as an independent research and consulting firm since May 30, 1986.
What Distinguishes CPM Group's Silver Research From Other Market Reports?
CPM Group operates independently of precious metals marketing organisations, mining companies, and commercial promotional interests. Its methodology prioritises empirical supply and demand data, including gross investor flow analysis, and it does not rely on deficit narratives or sentiment-based framing.
What Is CPM Group's Silver Price Outlook for the Remainder of 2026?
CPM Group's published short-term range for silver covers approximately $70 to $90 per ounce over the June through August 2026 period, with acknowledged downside spike risks to $65 per ounce. Longer-term price behaviour remains dependent on macroeconomic and geopolitical developments.
Does CPM Group Publish Research on Metals Other Than Silver?
Yes. CPM Group publishes annual yearbooks for gold and platinum (the latter incorporating palladium and rhodium), along with monthly advisory publications for both precious and base metals, and a recently released 10-year copper supply, demand, and price projection report.
Key Takeaways for Investors Following the Silver Market in 2026
- Silver is in a broad consolidation phase in mid-2026, with a CPM Group short-term range of $70 to $90 per ounce and acknowledged spike risks below $70
- The 950 million ounce gross selling figure between 2021 and 2025 represents a structural market force that net-only analysis would never have identified, demonstrating the practical value of CPM Group's methodological approach
- US macroeconomic data presents a mixed picture: GDP revised upward for Q1 2025, but contracting real disposable income alongside elevated consumer spending signals growing household debt dependency
- PCE inflation at approximately 3.8% headline and 3.2% core keeps near-term rate cut expectations low, creating an ongoing opportunity-cost headwind for non-yielding assets
- The platinum market's muted response to London Platinum Week 2026 promotional activity may signal a broader shift in how sophisticated investors evaluate deficit-narrative reports across the precious metals complex
- Independent, fundamental-driven research continues to demonstrate measurable advantages over sentiment or narrative-based approaches, as illustrated by the compounding financial difference between research-informed and campaign-driven silver investment decisions across the 2021 to 2026 cycle
This article is intended for informational and educational purposes only. Nothing contained here constitutes financial advice. All price ranges, projections, and market outlooks referenced from CPM Group publications are subject to change and carry inherent uncertainty. Past performance of any research methodology or market analysis does not guarantee future outcomes. Readers should conduct their own due diligence and consult a qualified financial adviser before making investment decisions.
Want To Catch The Next Major ASX Mineral Discovery Before The Broader Market Does?
Discovery Alert's proprietary Discovery IQ model delivers real-time alerts on significant ASX mineral discoveries, cutting through the noise to surface actionable opportunities the moment they are announced — the same analytical edge that separates informed investors from those reacting too late. Explore how historic mineral discoveries have generated substantial returns or start your 14-day free trial today to position yourself ahead of the market.